The development of small-interfering RNA-mediated gene-silencing strategies has made it possible to study the function(s) of essential gene products in human cells. In these functional studies, a certain target gene is transiently silenced in the cell type of choice with two different siRNAs that are directed at the same mRNA. Routinely, we employ one siRNA targeting the coding region and another one targeting the non-coding or untranslated region (UTR) of the respective mRNA and compare the phenotypes of these two cell pools with cells, which were treated with a non-targeting siRNA. The first aim always is to optimize gene-silencing conditions in a way that leads to 90% depletion of the protein of interest without affecting the three cellular parameters, growth, viability, and morphology. Since our major interest are proteins of the human endoplasmic reticulum (ER), we analyze as functional read-outs the effect of the silencing on i) the biogenesis of secretory- and membrane proteins, ii) the differential cellular proteome iii) the differential ensemble structure of ER membrane proteins, iv) cellular calcium homeostasis, v) cellular energy homeostasis, vi) cellular migratory potential, and vii) cellular invasive potential. The silencing with an UTR-siRNA allows subsequent cDNA-based complementation as gold-standard for demonstrating specificity of the observed effects and carries the additional benefit of facilitating analysis of the consequences of disease-linked mutant variants.
- human cells
- siRNA-mediated gene silencing
- plasmid-mediated complementation
- target protein function(s)
- cellular proteostasis
- membrane protein structure
- calcium homeostasis
- ATP/ADP exchange
- cell migration/invasion
- medical implications
One gene silencing protocol to interrogate a plethora of essential aspects in HeLa cell biology
Johanna Dudek, Monika Lerner and Richard Zimmermann
The development of small-interfering RNA-mediated gene-silencing strategies has made it possible to study the function(s) of essential gene products in human cells. In these functional studies, a certain target gene is transiently silenced in the cell type of choice with two different siRNAs that are directed at the same mRNA. Routinely, we employ one siRNA targeting the coding region and another one targeting the non-coding or untranslated region (UTR) of the respective mRNA and compare the phenotypes of these two cell pools with cells, which were treated with a non-targeting siRNA. The first aim always is to optimize gene-silencing conditions in a way that leads to 90% depletion of the protein of interest without affecting the three cellular parameters, growth, viability, and morphology. Since our major interest are proteins of the human endoplasmic reticulum (ER), we analyze as functional read-outs the effect of the silencing on i) the biogenesis of secretory- and membrane proteins, ii) the differential cellular proteome iii) the differential ensemble structure of ER membrane proteins, iv) cellular calcium homeostasis, v) cellular energy homeostasis, vi) cellular migratory potential, and vii) cellular invasive potential. The silencing with an UTR-siRNA allows subsequent cDNA-based complementation as gold-standard for demonstrating specificity of the observed effects and carries the additional benefit of facilitating analysis of the consequences of disease-linked mutant variants.
1. Introduction
The development of small-interfering RNA-mediated gene-silencing strategies has made it possible to study the function(s) and mechanism of essential gene products in human cells [1][2]. To exclude unspecific siRNA effects, a certain target gene, such as the SEC61A1 gene that codes for the a-subunit of the heterotrimeric Sec61 complex in the ER membrane (Table 1), is transiently silenced in the cell type of choice with two different siRNAs that are directed at the same mRNA of interest (Figure 1) [3][4][5][6]. As a first step, we search libraries of commercial siRNAs for one siRNA targeting the coding region and a second one targeting the non-coding or 5´-untranslated region (5´-UTR) of the respective mRNA and aim for 90% depletion of the target protein without affecting cell growth, cell viability, and cell morphology. We do so by testing several different siRNAs targeting the same gene, different siRNA concentrations (between 10 and 40 nM final concentration) and incubation times (between 48 and 120 h). Typically, we reach this goal with two sequential siRNA transfections at the start of the experiment and 24 h later and a total silencing time between 72 and 96 h (Figure 2). In the experiments addressing the function(s) of the target protein, we compare the phenotypes of the two depleted cell pools with cells, which were treated with a non-targeting siRNA (Table 2). Routinely, cell growth, viability and morphology as well as depletion efficiency are monitored. With respect to protein function(s), we analyze the effect(s) of target protein depletion on i) the ER import of model precursor polypeptide(s) in cells or in cell-free assays involving semi-permeabilized cells (SPCs) and in vitro translations systems, ii) the total cellular proteome (by label-free quantitative mass spectrometry/MS and differential protein abundance analysis), iii) the ER- or cellular ultrastructure (by cryo-electrontomography/CET), iv) the cellular calcium homeostasis (by Ca2+-imaging in cytosol or ER), v) the cellular energy homeostasis (by ATP-imaging in cytosol or ER), and the vi) cellular migratory- and vii) invasive-potential. Silencing with an UTR-siRNA allows complementation with an expression plasmid for the target cDNA lacking the UTR. This rescue experiment represents the gold-standard for demonstrating specificity of the observed effects of the depletions (Figures 1, 2). For this, we use expression plasmids that code for the cDNA of interest upstream of an internal ribosome entry site (IRES) and the coding region for a fluorescent protein (such as green fluorescent protein or GFP) (Figure 1). Notably, however, this strategy allows monitoring transfection and expression efficiency but cannot be used for imaging applications, which employ dyes with similar fluorescence properties as GFP. In this case, different fluorescent proteins are used or the IRES plasmid is only used for the initial experiments, which optimize the conditions. In the last 15 years, we have interrogated the functions and molecular mechanism(s) of more than 30 ER proteins in HeLa cells using siRNA-mediated gene silencing [3][4][5][6][7][8][9][10][11][12][13][14][15][16][17][18][19][20][21][22][23][24][25][26][27][28][29][30][31][32][33][34][35][36].
In addition, the rescue experiments allowed us the analysis of the consequences of disease-linked mutations [11][30][37][38]. Because of the essential functions of the Sec61 channel, it is not surprising that there are genetically determined human diseases, which are linked to the SEC61A1 gene. Examples are the Sec61-channelopathies and several tumor diseases [37][38][39][40][41][42][43][44][45][46][47][48][49][50][51][52][54][55][56][57][58][59][60][37][38][39][40][41][42][43][44][45][46][47][48][49][50][51][52][53][54][55][56][57][58][59][60]. Mammalian cells, which are highly active in protein secretion, are particularly sensitive towards problems in Sec61 channel closure and, therefore, constantly on the verge to apoptosis. This has been seen associated with dominant negative effects in the course of i) hypogammaglobulinemia or common variable immunodeficiency in plasma cells with the Sec61aV85D exchange, ii) tubulo-interstitial and glomerulocystic kidney disease in kidney cells with the Sec61aV67G, Sec61aT185A, or Sec61aF458V exchanges, iii) neutropenia in neutrophils with the Sec61aV67G or Sec61aQ92R exchanges, and iv) polycystic liver disease with the Sec61aR236C exchange. In addition, professional secretory cells appear to be particularly sensitive to imbalances in the Sec62 to Sec63 ratio, which apparently result in over-efficient Sec61 channel closure and, thus, an increased migratory potential that can lead to cancer as seen after over-expression of SEC62 in prostate or lung cancer.
Table 1. The proteins of interest with their genes (unless there are more than 3) and function(s).
Table 1. The proteins of interest with their genes (unless there are more than 3) and function(s)
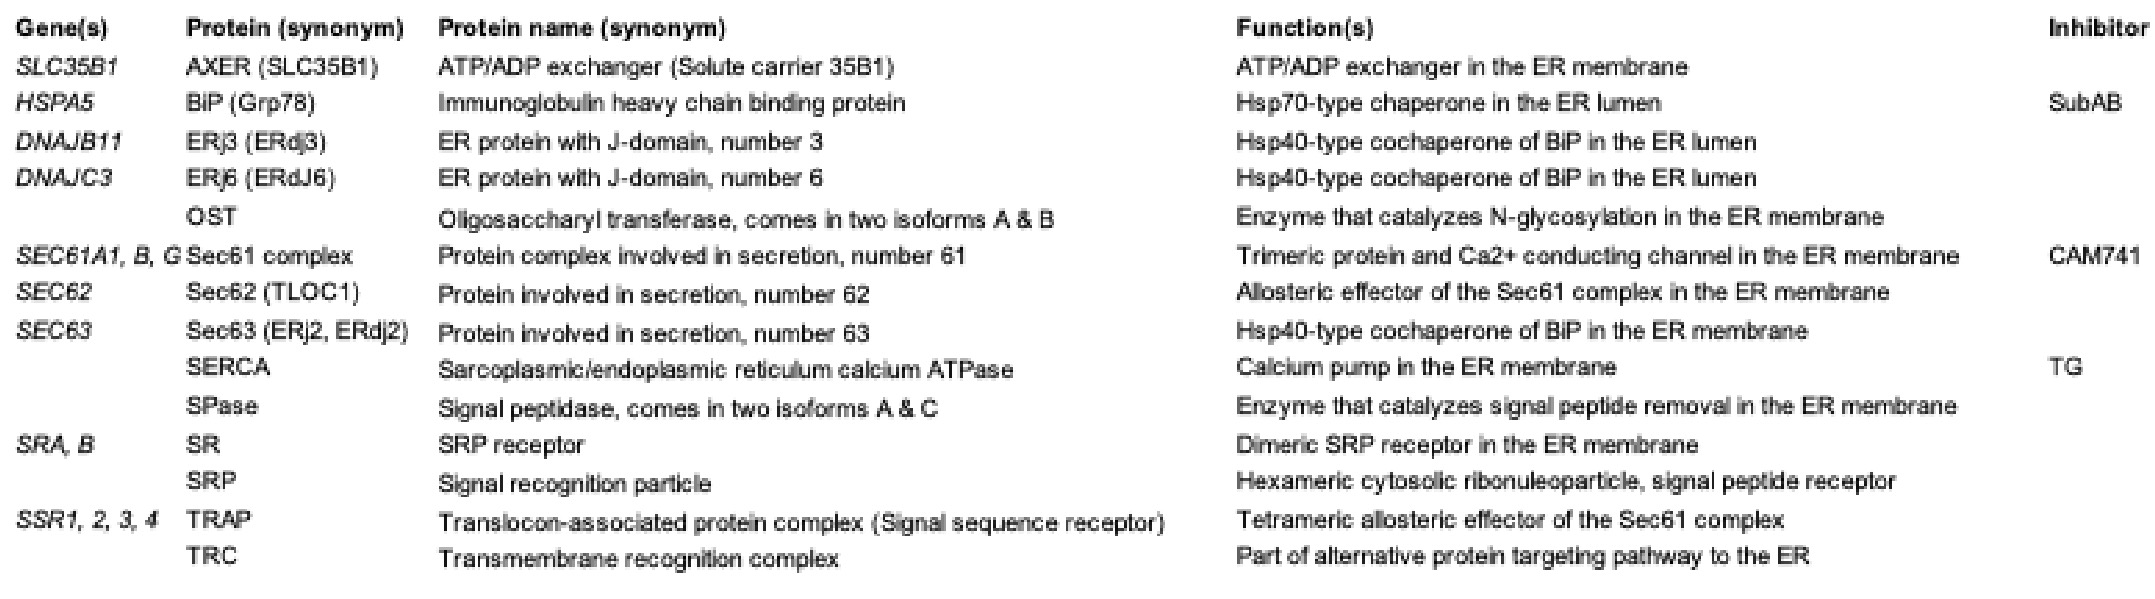
Table 2. The cell biological questions and the methods to address them in HeLa cells.
Table 2. The cell biological questions and the methods to address them in HeLa cells
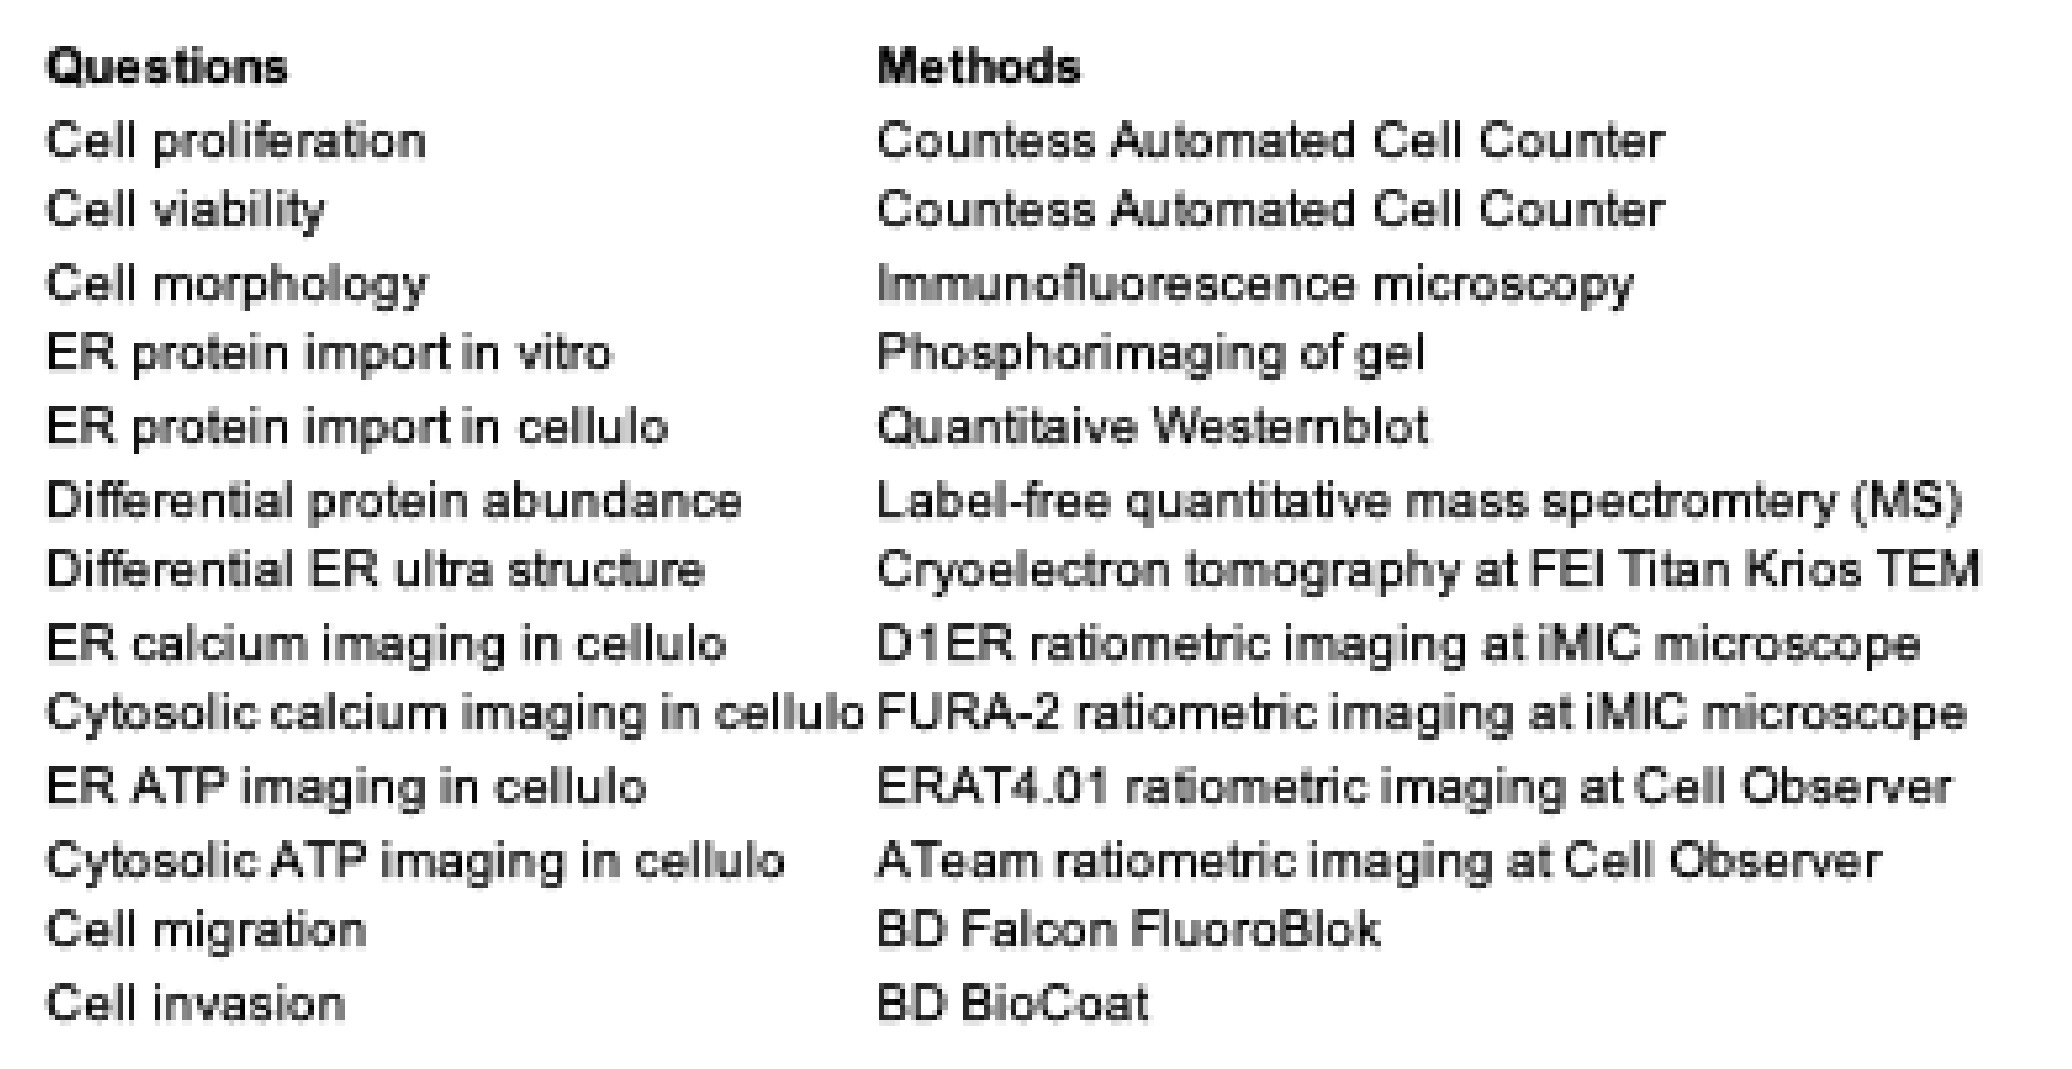
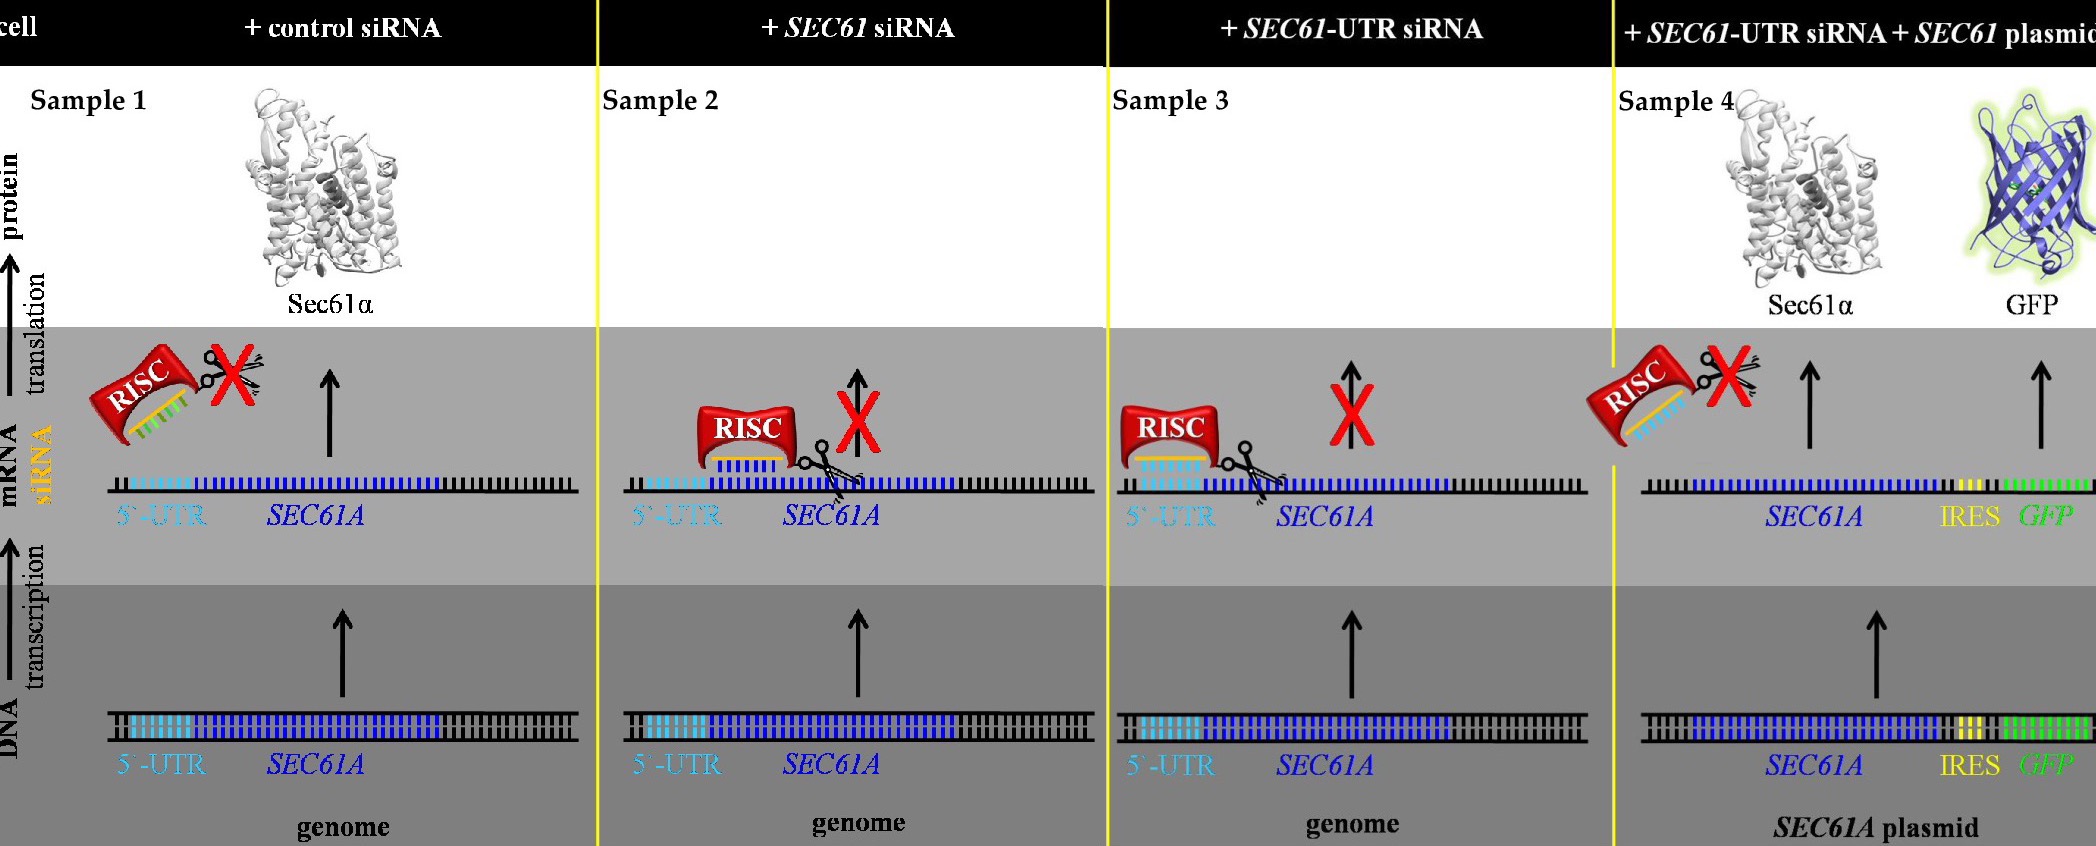
Figure 1Figure 1. The overall gene silencing strategy with its four cell pools, using SEC61A1 mRNA as a target example. One cell pool is transfected with non-targeting or control siRNA, a second one with SEC61A1 targeting siRNA, a third one with SEC61A1-UTR targeting siRNA, and a fourth one with SEC61A1-UTR targeting siRNA plus a SEC61A1-expression plasmid that comprises the SEC61A1-cDNA lacking the 5´-UTR, an internal ribosomal entry site (IRES), and the GFP coding region. The IRES allows the separate synthesis of GFP. RISC, RNA-induced silencing complex.
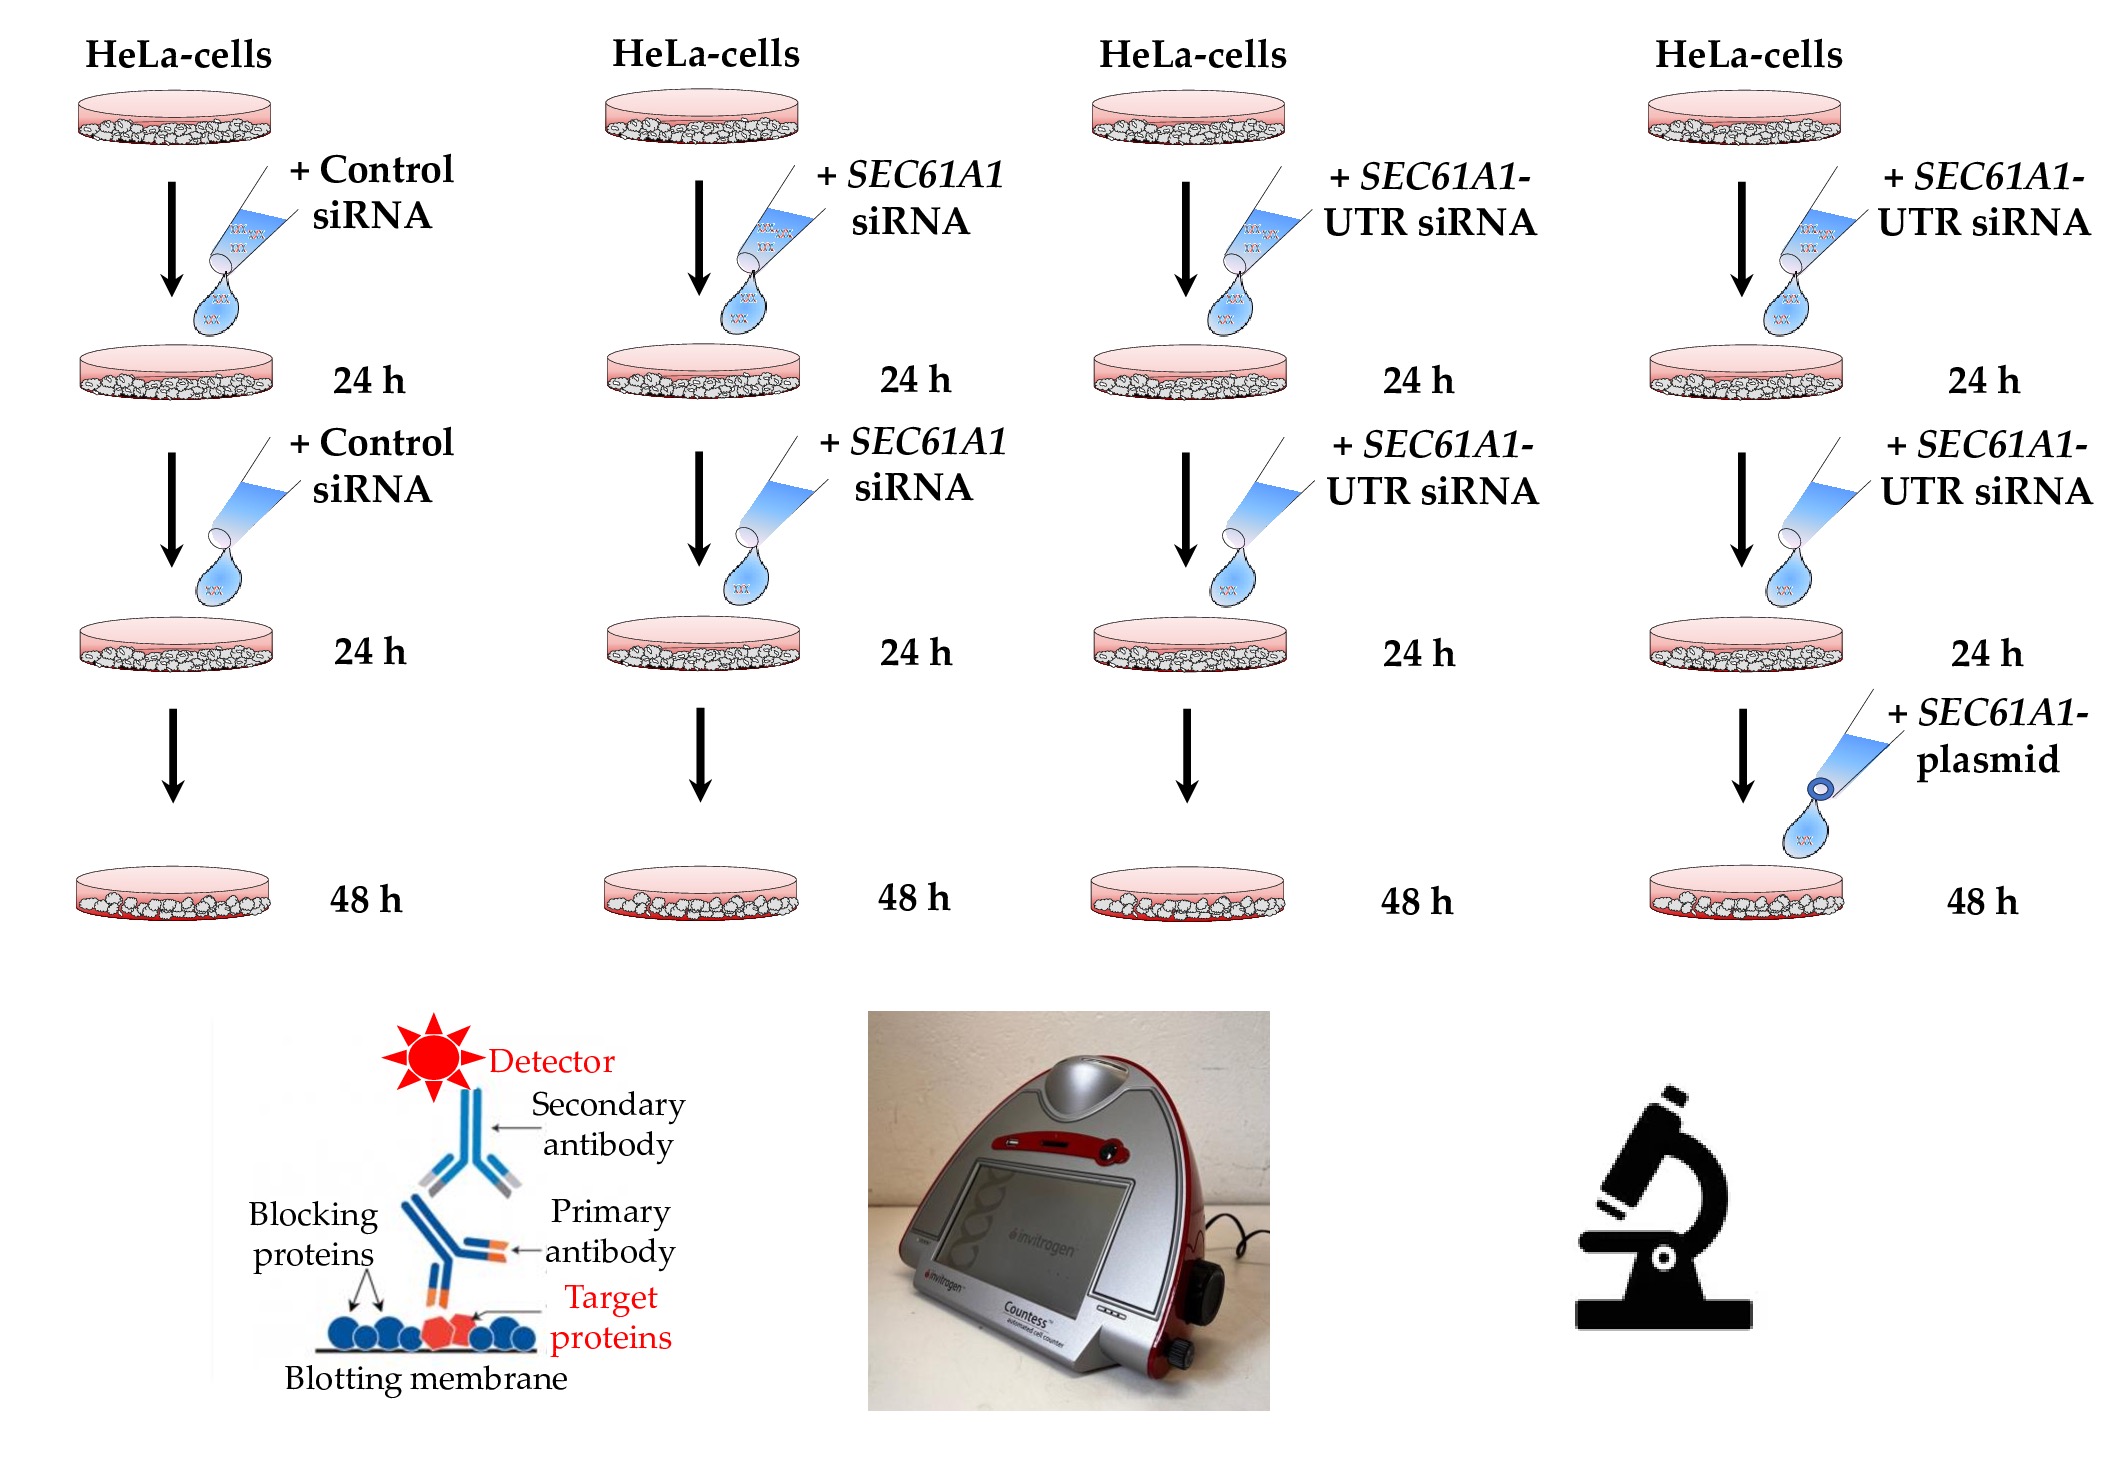
Figure 2. The experimental details. Aims of gene silencing are 90% depletion of the target protein in both siRNA-treated samples in combination with negligible effects on cell growth, viability and cellular and ER morphology in all samples. The three routine analyses are visualized in the bottom part of the cartoon and typically carried out in triplicates.
2. Materials and Methods
2.1. Materials
All plastic and glass wear has to be sterile and, therefore, should be bought as such or autoclaved or sterilized by the user in advance. Furthermore, gloves are worn throughout all experiments and cells are handled in laminar flow hoods. Several aspects of the handling can be seen in a video (https://www.jove.com/v/2730/live-cell-calcium-imaging-combined-with-sirna-mediated-gene-silencing, last accessed September 29, 2025). Routinely, all chemicals should be purchased of the highest available quality.
2.1.1. HeLa cells can be obtained from the American Type Culture Collection, ATCC (Cat. no. CCL-2) or the German Collection of Microorganisms and Cell Cultures GmbH, DSMZ (Cat. no. ACC 57) and are suitable for all our own experiments that are described here. Various other human cells, such as HEK293 cells from BHT011 (DSMZ; AC 279), PC3 cells (DSMZ; Cat. no. ACC 465) were also successfully silenced following the protocol, which had been optimized for HeLa cells. Cells should be tested for mycoplasma contamination by a commercial mycoplasm detection kit, passaged only up to 25 times and, then, replaced by a new cryo-stock and every five years replaced by a new batch. Alternatively, we have successfully used murine NIH3T3 cells (ATCC no. CCL-92). Notably, any mammalian cell may be used in this approach; however, in our hands adherent cells are better suited than non-adherent cells.
2.1.2. HeLa cells should be cultivated in Dulbecco´s Modified Eagle´s Medium (DMEM) from Invitrogen Corporation, Carlsbad, CA, USA containing 10% fetal bovine serum (FBS) from Biochrom AG, Berlin, Germany and 1% penicillin/streptomycin (PAA Laboratories GmbH, Pasching, Austria). Typically, FBS is pre-treated for 30 min at 56 °C. The serum quality is crucial for cell viability, particularly in combination with transfection reagents. Notably, we test new batches of serum for their ability to support cell growth after transfection with control siRNA and control plasmid. Furthermore, different cells may have different serum requirements. Therefore, prior to using a novel cell type, we test different sera in combination with siRNA or plasmid transfection.
2.1.3. Validated siRNAs can be obtained from commercial sources (Invitrogen Corporation, Carlsbad, CA, USA or Qiagen, Hilden, Germany). As a negative control, the AllStarsTM Negative Control siRNA from Qiagen can be used. Dissolve the siRNAs (targeted siRNAs and control siRNA) in RNase-free deionized water to prepare a 20 µM stock solution. Mix using a vortex and observe solubilization visually. Store 50 µl aliquots at -20 °C. Although siRNAs can be designed by available algorithms, we routinely use either validated siRNAs or predesigned siRNAs. Both can be acquired from commercial sources. We note, however, that the validation is typically done by the companies at the mRNA level only. Therefore, it is advisable to test several different siRNAs that are targeting the same gene.
2.1.4. To rescue the phenotype of SEC61A1 silencing, the SEC61A1 cDNA can be inserted into the multiple cloning site (MCS) of a pCDNA3-IRES-GFP vector containing the cytomegalovirus (CMV) promoter, the MCS, the IRES, and the GFP coding sequence. The plasmids can be purified using the Jet Star Plasmid Purification MIDI Kit according to the manufacturer´s recommendations (Genomed GmbH, Löhne, Germany). Validated TrueORF cDNA plasmids can be used as alternative and obtained from commercial sources, such as OriGene Technologies (Rockville, Maryland, USA). In our hands, plasmids for transfection of HeLa cells are best purified from E. coli strain DH5a.
2.1.5. Many different transfection reagents are available from commercial sources and used in combination with OptiMEM (Invitrogen Corporation, Carlsbad, CA, USA). For HeLa cells, we use HiPerFectTM from Qiagen (Hilden, Germany) for siRNAs and FuGENETM HD from Promega Corporation (Heidelberg, Germany) for plasmids. Notably, transfection conditions must be optimized for each siRNA, each plasmid and each cell line.
2.1.6. Reagents for characterization of cells: BrdU Assay, WST Assay and LDH+ assay (Roche Diagnostics GmbH, Mannheim, Germany) and Nuclear-IDTM Blue/Green cell viability reagent, Apoptosis/Necrosis Detection Kit (Enzo Life Sciences, Lausen, Switzerland).
2.1.7. PCR reagents: Superscript II, oligo-dT Primer (Invitrogen Corporation, Carlsbad, CA, USA) and QIAamp RNA Blood Mini Kit, QuantiTect SYBR Green PCR Kit (Qiagen, Hilden, Germany), MicroAmp Fast 96-well reacton plates (Applied Biosystems, Carlsbad, USA).
2.1.8. Western blotting reagents: Immobilon P (Millipore GmbH, Schwalbach, Germany), rabbit anti-GAPDH antibody (Santa Cruz Biotechnology, Santa Cruz, CA, USA), mouse anti-b-actin antibody (Sigma Aldrich Chemie GmbH, Taufkirchen, Germany), and ECLTM Plex goat-anti-rabbit IgG-Cy5 conjugate, ECLTM Plex goat-anti-mouse IgG-Cy3 conjugate (GE Healthcare Life Sciences, Freiburg, Germany).
2.1.9. Reagents for studying protein transport in cells: validated TrueORFTM cDNA plasmids coding for DDK-tagged model precursor proteins and murine anti-DDK antibody (OriGene Technologies, Rockville, Maryland, USA), MG132 (Calbiochem, Merck, Darmstadt, Germany).
2.1.10. Reagents for studying protein transport in cell-free systems: RNAsin (Promega, Heidelberg, Germany) nulease treated rabbit reticulocyte lysate system or coupled transcription/translation or TNTTM system (both Promega, Heidelberg, Germany), 35S-methionine (revvity, Hamburg, Germany).
2.1.11. Reagents for mass spectrometry: Guanidine-hydrochloride (GnHCl; Promega, Heidelberg, Germany), 10 mM Tris(2-carboxyethyl)phosphine hydrochloride (TCEP; Pierce, Thermo Fisher Scientific, Darmstadt, Germany), 40 mM 2-chloroacetamide (CAA; Sigma-Aldrich Chemie GmbH, Taufkirchen, Germany).
2.1.12. Reagents fo calcium imaging: Fluo5N-AMTM, FURA-2-AMTM, Ionomycin, and Thapsigargin (ThermoFisher Scientific, Darmstadt, Germany); D1ER can be obtained from addgene, USA; https://www.addgene.org/Roger_Tsien/ last accessed October 31, 2025.
2.1.13. Reagents fo ATP imaging: ATeam and ERAT4.01 (NGFI Next Generation Fluorescence Imaging GmbH, Graz, Austria).
2.1.14. 24-well plates for cell migration (FluoroBlokTM) and invasion (BioCoat MatrigelTM) are from Corning (Thermo Fisher Scientific, Darmstadt, Germany).
2.2. Methods
As a start, a set of siRNAs directed against a certain target mRNA (including siRNAs directed against the untranslated region (UTR)) should be evaluated in comparison to a negative control siRNA, such as a mismatch or scrambled sequence, with respect to silencing efficiencies and various biological readouts (Figure 2). The gene-silencing efficiencies should be measured on the mRNA and protein level by quantitative methods, i.e. quantitative RT-PCR and quantitative Western-blot analysis, and subjected to appropriate statistical analysis [6][61]. To determine the suitable time point for protein function experiments, however, it is mandatory to determine the protein levels. Next, active siRNAs are titrated to determine the lowest possible levels. As original biological readouts, the effects of silencing of a specific gene on cell proliferation, cell viability, and cell and ER morphology should be routinely assessed in time-course experiments [5][6]. These experiments should identify a set of at least two active siRNAs (preferably, including a UTR-directed siRNA) and define the appropriate experimental time-window for the analysis of protein function. The latter is particularly important in the case of essential components. Protein function should be analyzed in intact cells and, ideally, in suitable in vitro systems, such as an in vitro translation system and SPCs prepared from the knock-down and control cells in case of analysis of ER protein import. As an ultimate or gold standard control, any defect observed with at least one siRNA directed against the coding region of the target gene plus one UTR-targeting siRNA should be rescued by complementation of the UTR-siRNA-treated cells with a plasmid that allows expression of the respective cDNA (and is lacking the UTR) (Figures 1,2 2). Ideally, the expression level of the cDNA of interest in the UTR-siRNA background should be comparable to the expression level of the target gene in completely untreated cells according to Western-blot analysis. Typically, we use internal ribosomal entry site (IRES)-green fluorescent protein (GFP) vectors that allow for quantitation of the plasmid transfection efficiency (Figure 1).
Silencing is originally evaluated by quantitative RT-PCR and Western-blot analysis. At the protein level, the maximum silencing effect is typically seen 72-96 h after the first transfection, while it usually takes less than 48 h for the mRNA to be efficiently degraded. Notably, in the case of protein complexes we have observed knock down of all subunits of the complex at the protein level in the absence of degradation of the non-silenced mRNAs [15][21][24]. Therefore, these effects can be assigned to protein degradation.
2.2.1. Cell Cultivation
2.2.1. Cell cultivation
Directly before transfection with siRNA, seed 5.2 x 10⁵ HeLa cells in a 6-cm culture dish in DMEM containing 10% FBS and 1% penicillin/streptomycin and incubate at 37 °C in a humidified environment with 5% CO2 (final volume 3.9 ml).
2.2.2. Gene Silencing
2.2.2. Gene silencing
Transfect the cells with targeted siRNA, targeted UTR siRNA, or a negative control siRNA using HiPerFect Reagent according to the manufacturer’s instructions (final concentration of siRNA: 20 nM). The handling of the gene silencing procedure can be seen in a video (https://www.jove.com/v/2730/live-cell-calcium-imaging-combined-with-sirna-mediated-gene-silencing, last accessed September 29, 2025).
Prepare siRNA-transfection mix freshly in a separate Eppendorf reaction cup prior to the actual transfection procedure. Add 20 µl HiPerFect transfection reagent to 4 µl of each siRNA (20 µM) that is dissolved in 80 µl of OptiMEM. Mix by gentle vortexing and incubate at room temperature for 10 min. Add the siRNA-transfection mix (0.104 ml) dropwise to the seeded 5.2 x 10⁵ HeLa cells (3.9 ml) and gently swirl the culture dish. After 24 h, change the medium (3.9 ml) and transfect the cells for a second time with fresh siRNA-transfection mix (0.104 ml). At the time of cell harvest, determine cell number and viability e.g. by employing the Countess® Automated Cell Counter (Invitrogen Corporation, Darmstadt, Germany).
Notably, cell proliferation can also be quantitatively analyzed in real-time with an xCELLigenceTM RTCA SP system with RTCA 2.0 software and 96-well E-plates (Agilent Technologies GmbH, Bremen, Germany), which is particularly useful when many conditions have to be tested, as in the case of screening of small molecule inhibitors.
Consider alternative means of inactivating single gene products, such as toxins, to gain independent support for your functional observations. Notably, in the case of silencing of HSPA5, which codes for BiP, the proteolytic cleavage of BiP in the ER of intact cells by treatment with the subtilase cytotoxin SubAB or an inactive variant (SubAA272B) that served as negative control turned out to be the method of choice for ER protein import experiments [11][23]. The advantage is that the toxin works fast and efficient and thus does not have the side effects of HSPA5 long term silencing. Obviously, CRISPR/Cas 9 mediated knock out strategies provide another alternative.
2.2.3. Evaluation of Gene Silencing by Quantitative RT-PCR
2.2.3. Evaluation of gene silencing by quantitative RT-PCR
Isolate mRNA using the QIAamp RNA Blood Mini Kit. Perform reverse transcription of mRNA with Superscript II RT and Oligo-dT12-18 primers; purify the resultant cDNA using the PCR Purification Kit and adjust to a final concentration of 50 ng/µl. Perform quantitative real-time PCR e.g. with the QuantiTect SYBR Green PCR Kit and specific primers for GAPDH (fwd: 5`-AACGTGTCAGTGGTGGACCTG-3`; rev: 5`-AGTGGGTGTCGCTGTTGAAGT-3`) in a StepOnePlusTM 96-well system (Applied Biosystems, Carlsbad, USA). Determine each value in triplicate and use a total of 50 ng cDNA per well in a 10 µl reaction volume and the primer concentration is 2 µM each. Calculate relative gene expression in treated compared to control cells using the DDCT-method with GAPDH serving as internal control [10]. Alternatively, SOX (Hs01053049_s1) and BMI-1 (Hs00180411_m1) can be used.
2.2.4. Evaluation of Gene Silencing by Quantitative Western Blotting
2.2.4. Evaluation of gene silencing by quantitative Western blotting
To study protein function depletion of the protein of interest is key. To quantify proteins of interest in lysate from cultured cells, use 2 x 10⁵ cells for Western-blot analysis employing the respective primary antibodies e.g. from rabbit or mouse. Visualize the primary antibodies with an ECLTM Plex goat-anti-rabbit IgG-Cy5 conjugate and e.g. the Typhoon-TrioTM imaging system in combination with Image Quant TL software 7.0 (GE Healthcare, Freiburg, Germany). Alternatively, peroxidase-coupled anti-rabbit IgG or anti-mouse IgG can be employed in combination with Super Signal West Pico Chemiluminescence Substrate and the Fusion SLTM imaging system with accompanying software (peqlab, Erlangen, Germany). Use antibodies that are directed against GAPDH or ß-actin as controls for the fact that similar cell equivalents are compared.
Notably, quantitative Western blotting requires that the whole assay is carried out in the linear range, i.e. it must be established for every single primary antibody/secondary antibody combination that quantitative differences are accurately monitored. This monitoring is best carried out by running serial dilutions of a cell suspension next to a protein mass standard for the protein of interest on SDS-PAGE. After transfer of the proteins to Immobilon P, the protein is visualized by fluorescence or chemiluminescence imaging. Typically, the signal is proportional to the mass of the protein of interest only over a certain range of the serial dilution of the cell suspension. Ideally, a number of cells corresponding to the middle of the linear range is used in routine assays. It is recommended that every once in a while, part of the serial dilution is run on the same gel as the samples from a gene-silencing or complementation experiment.
We note that employing primary antibodies in the Western-blot evaluation of knock- down efficiencies allows for simultaneous evaluation of the antibodies. Subsequently, the antibodies are also evaluated with targeted siRNA- versus control siRNA-treated cells in immunofluorescence microscopy. As a rule, we use only those antibodies for fluorescence microscopy and immunocytochemistry that show a significant differential effect for targeted siRNA- versus control siRNA-treated cells.
2.2.5. Evaluation of Cellular and ER Morphology by Immunofluorescence Microscopy
2.2.5. Evaluation of cellular and ER morphology by immunofluorescence microscopy
Cells should be fixed with paraformaldehyde, washed and an indirect immunofluorescence staining performed e.g. with affinity purified rabbit antipeptide antibody directed against the human Sec62 (C-terminal 11-mer plus an N-terminal cysteine) and Alexa-Fluor-594-coupled secondary antibody from goat. Analyze cells by microscopy using e.g. an Elyra SIM ElyraTM SIM PSI microscope (Zeiss, Jena, Germany) with Plan Apochromat oil DIC M27 objective 63x/1.4, iXonEM + 885 EMCCD camera (Andor Technology, Belfast, UK) and ZEN 2011 lite software [5].
2.2.6. Complementation and Its Application in the Analysis of Disease-Causing Mutations
2.2.6. Complementation and its application in the analysis of disease-causing mutations
As the ultimate or gold standard control for siRNA experiments, the phenotype of e.g. SEC61A1 silencing should be rescued by the SEC61A1 cDNA (Figures 1,2 2) [6] [6]. The cDNA should be inserted into the multiple cloning site (MCS) of a pCDNA3-IRES-GFP vector containing the CMV promoter, the MCS, the IRES, and the GFP coding sequence. At 48 h after the first siRNA transfection, exchange the medium for a second time and transform the cells with either an empty vector or the SEC61A1 expression plasmid using FuGENE HD according to the manufacturer’s protocol (final ratio of vector to FuGENE HD is 4 µg vector to 16 µl FuGENE HD). Notably, the gene-silencing and successful plasmid rescue experiments allow for the future analysis of rationally designed or disease-linked mutations in ER transport components [5]. The complementation can be seen in a video (https://www.jove.com/v/2730/live-cell-calcium-imaging-combined-with-sirna-mediated-gene-silencing, last accessed September 29, 2025).
Prepare plasmids freshly in a separate Eppendorf reaction cup prior to the transfection procedure. Add 16 µl FuGENE HD transfection reagent to 4 µg of each plasmid that is dissolved in 80 µl of OptiMEM. This mix should be gently vortexed and incubated at room temperature for 10 to 15 min. Add the plasmid mix (0.1 ml) dropwise to the HeLa cells (3.9 ml) and gently swirl the culture dish. Notably, transfection conditions must be optimized for each siRNA, each plasmid, and each cell line.
Transfection efficiency can be visualized as GFP fluorescence and should be above 80%.
2.2.7. Defining the Experimental Time Window for Functional Assays
2.2.7. Defining the experimental time window for functional assays
Cell proliferation, viability, and apoptosis/necrosis should also be analyzed in time-course experiments with commercially available assays following the manufacturer’s instructions. We use the BrdU Assay in a 96-well format with 2.5 x 10⁴ cells, the WST Assay in 12-well plates with 1 x 10⁵ cells, and the LDH+ assay according to the manufacturers´ protocols. In addition, cells can be microscopically evaluated using the Nuclear-IDTM Blue/Green cell viability reagent and the Apoptosis/Necrosis Detection Kit, respectively, according to the manufacturer´s protocol.
ER stress is analyzed by Western blotting using antibodies directed against proteins over-produced after induction of the unfolded protein response. More immediate and sensitive assays are directed at the detection of the CHOP mRNA and the spliced form of the XBP1 mRNA, respectively by quantitative RT-PCR and the detection of phosphorylated eIF2a by Western-blot analysis [5].
Evaluation of cellular and ER morphology after gene silencing by immunofluorescence microscopy as described above (2.2.5.) [5].
On the basis of the results from these experiments, the silencing time for subsequent experiments is determined. In general, we aim for a maximum silencing efficiency at the protein level in combination with a minimum impact on cell growth, viability, morphology, and cellular defense mechanisms that indicate general cellular problems. The idea is to minimize secondary effects as far as possible.
3. Examples of Functional Assays
3.1. Comparative Analysis of Depleted and Control Cells by Quantitative Western Blot and Immunofluorescence Microscopy for the Validation of Antibodies
3.1. Comparative analysis of depleted and control cells by quantitative Western blot and immunofluorescence microscopy for the validation of antibodies
Antibodies should be validated prior to use in immunofluorescence or Western blot. We note that the anti-Sec62 antibody is specific for Sec62 under denaturing as well as native conditions, i.e. Western blot and fluorescence microscopy signals are not present or drastically reduced after silencing of the SEC62 gene.
3.2. Comparative Analysis of Depleted and Control Cells for ER Protein Import in Intact Cells or Cell-Free Translation Systems with SPCs
3.2. Comparative analysis of depleted and control cells for ER protein import in intact cells or cell-free translation systems with SPCs
ER protein import, which is typically accompanied by enzymatic removal of the signal peptide (SP) from the precursor polypeptide and/or its N-glycosylation (i.e. a change in molecular mass and, thus electrophoretic mobility), can be evaluated in silenced cells under steady-state conditions (Table 1). For this, cells should be transfected with plasmids that code for certain model substrate precursor proteins and a tag for easy detection, such as the Myc-DDK-tag (2.2.6.) (Figure 3a) [24]. Because precursor polypeptides in the cytosol are prone to degradation by the proteasome, the experiments with intact cells should be carried out after incubation of the cells with the proteasome inhibitor MG132 for the last 6 to 8 h. In our hands, HeLa cells tolerate a final concentration of 10 µM MG132 for this time period [24][30]. Be aware that MG132 induces the unfolded protein response. Therefore, the drug has to be used with caution. Special consideration has to be given to reproducibility. Therefore, experiments should routinely be carried out for different batches of cells.
For plasmid driven over-production of model precursor polypeptides, HeLa cells should be cultured in the presence of siRNA for a total of 96 h. After 72 h, the cells should be transfected with the respective pCMV6-entry-vector, coding for an additional carboxy terminal Myc-DDK-tag or with pCDNA3-IRES-GFP IRES-GFP vector using Fugene HD as described in 3.6. After 88 h MG 132 (10 µM) should be added for 8 h. Optionally, Tunicamycin (2 µg/ml) can be added after 73 h and prior to MG132 to inhibit N-glycosylation.
Notably, protein import into the ER can also be studied in a cell-free assay that employs rabbit reticulocyte lysate and SPCs, which should be prepared from depleted or control HeLa cells (Figure 3b) [62]. For this, cells should be prepared from equal cell numbers by washing in PBS, and subsequent treatment with digitonin for 5 min at 0 °C. A pellet of 20 x 106 cells should be resuspended in 1 ml ice-cold KHM buffer (110 mM potassium acetate, 2 mM magnesium acetate in 20 mM HEPES/KOH, pH 7.2) and supplemented with 22 µl digitonin stock solution (40 mg/ml DMSO). The SPCs should be added to the translation mixture, which contains rabbit reticulocyte lysate, 35S-methionine, and an in vitro synthesized mRNA (in case of nuclease treated reticulocyte lysate) or expression plasmid (in case of TNT lysate) and incubate for 60 min at 30°C according to the manufacturer´s recommendations [5][14][19][23][27][37][38][39][5][14][19][23][27][37][38]. Subsequently, protease-accessibility assays can be performed with 50 µl aliquots of translation reaction for 60 min at 0°C in 80 mM sucrose supplemented or not with combinations of proteinase K (50 µg/ml) plus trypsin (50 µg/ml) and Triton-X100 (0.1%) or H2O. Proteolysis is stopped by the addition of phenylmethylsulphonyl fluoride (final concentration: 20 mM) and incubation continued for 5 min at 0°C. Focusing on membrane proteins, SPCs can be subjected to alkaline extraction. For this, SPCs from 100 µl aliquots should be re-isolated by centrifugation, resuspended in 100 mM sodium carbonate (pH 11.5), and incubated for 1 h at 4 °C. Subsequently, the solution is subjected to centrifugation for 1 h at 200,000 x g and 2 °C to separate the extracted from integral membrane proteins.
Notably, aliquots of SPCs can be frozen in liquid nitrogen and stored at -80 °C for later use.
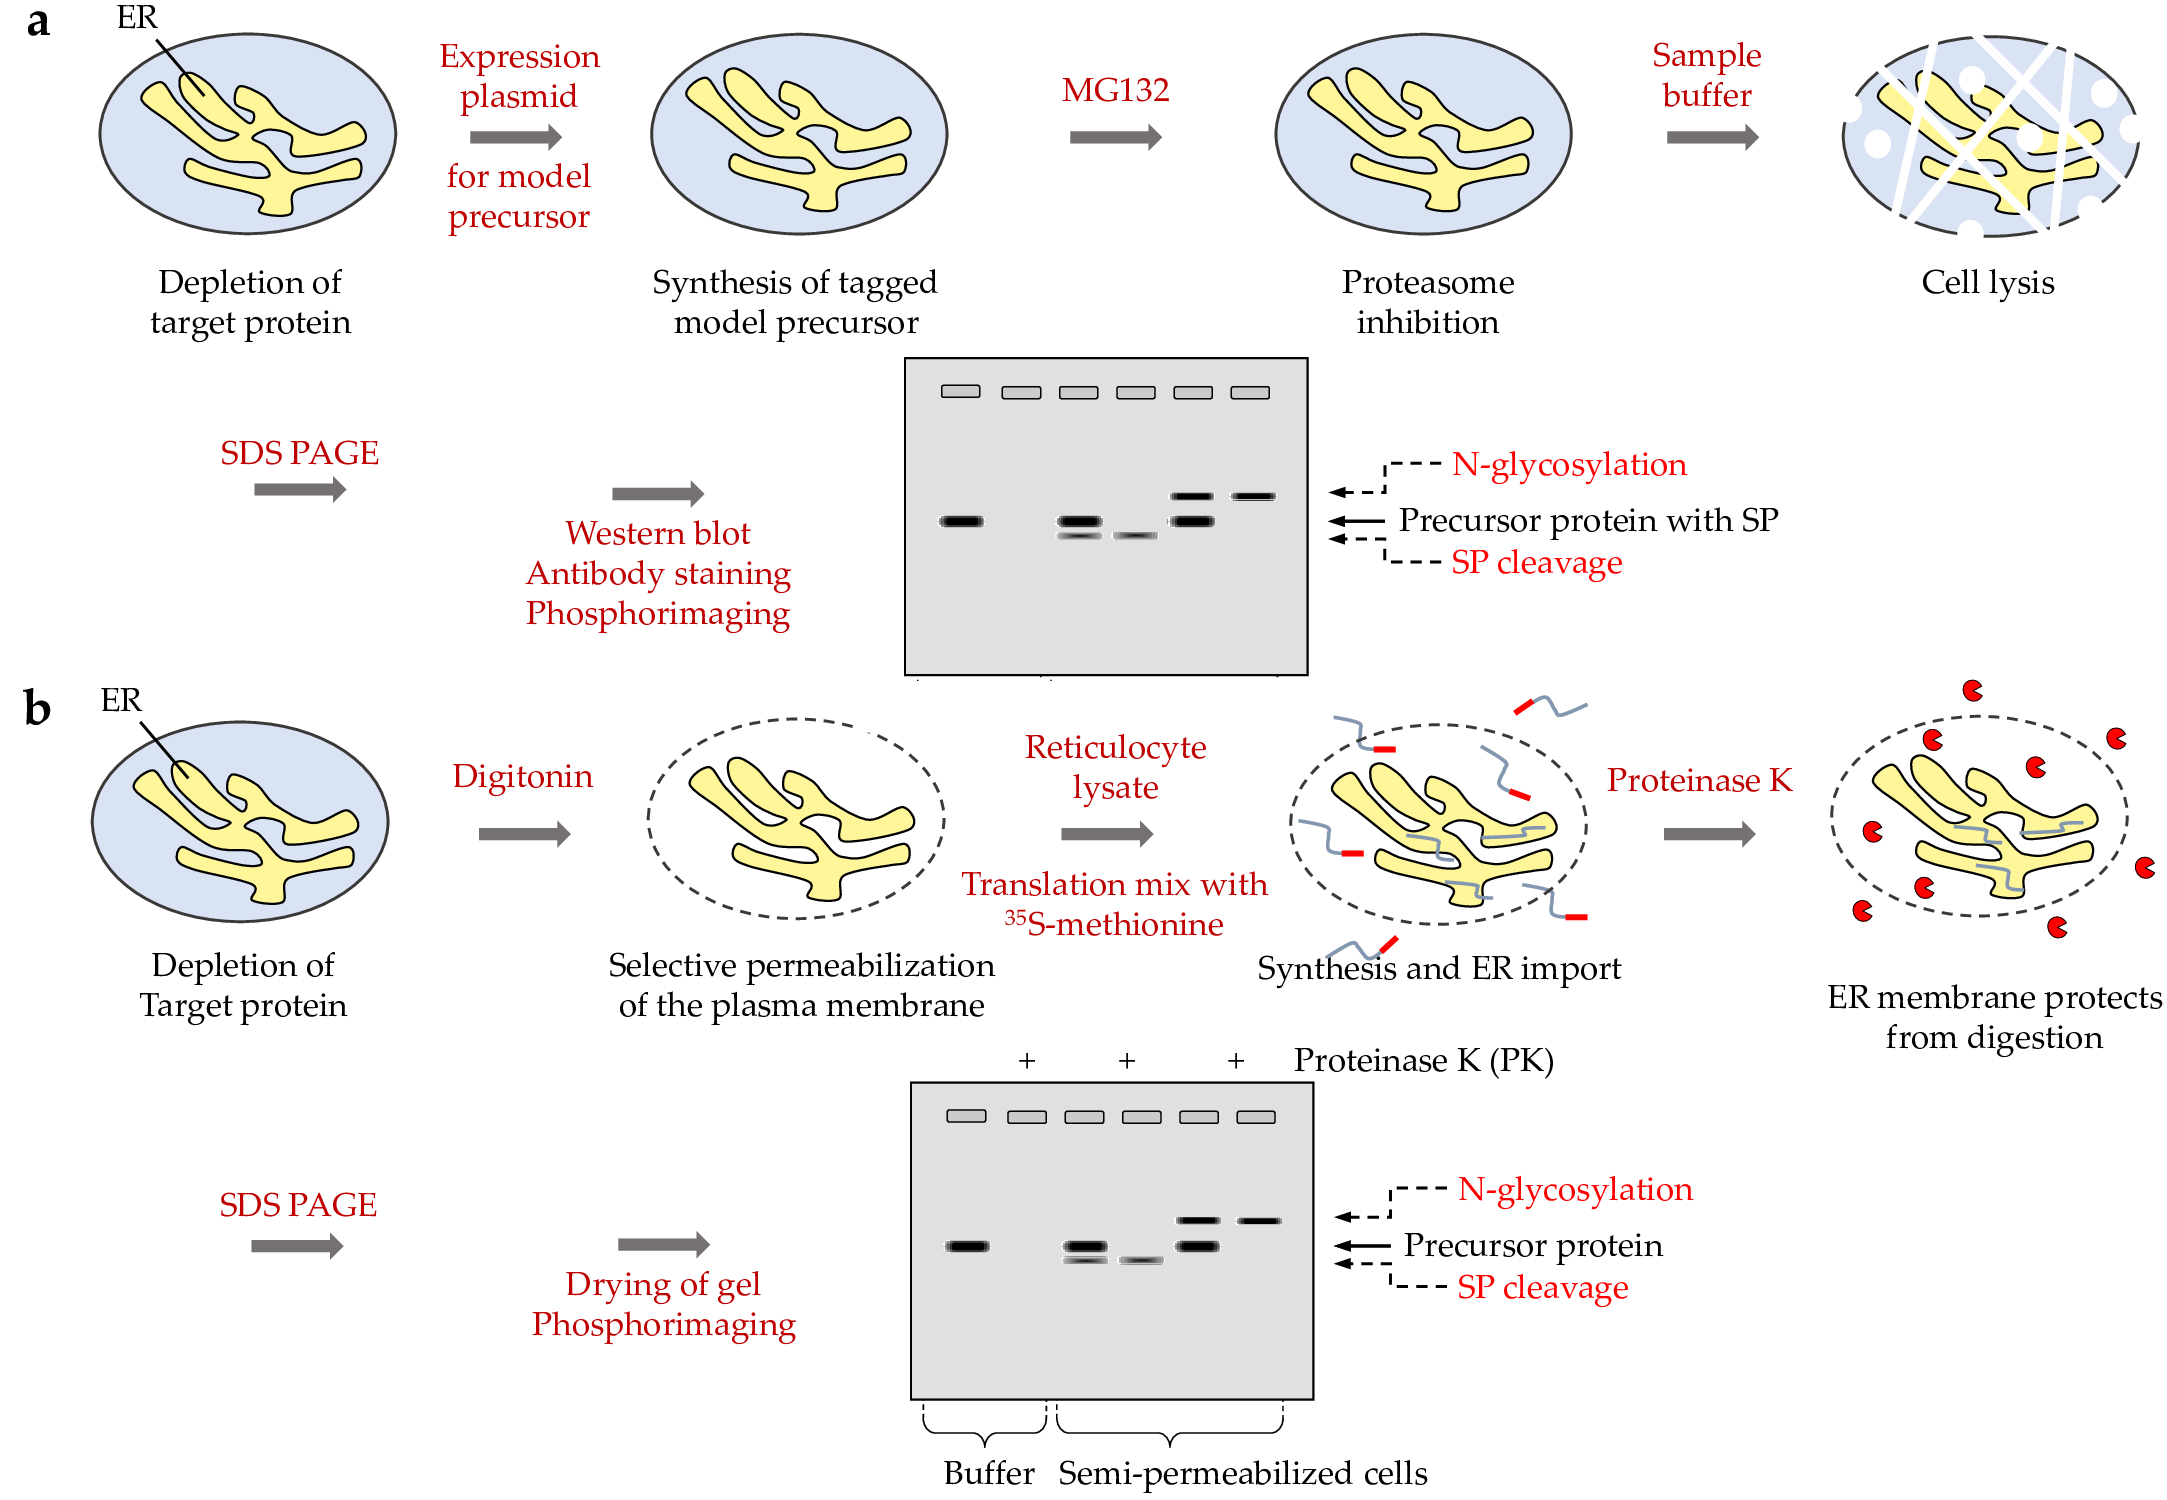
Figure 3. Experimental strategies for studying ER import of model precursor proteins in cells and in vitro, respectively. (a) The cartoon depicts the strategy and methods that are involved in the analysis of ER protein import in intact cells, i.e. under almost physiological conditions. (b) The cartoon depicts the strategy and methods that are involved in the analysis of ER protein import in cell-free translation systems with 35S -methionine and SPCs [62]. The two grey squares represent images of Western blots with the protein bands that were visualized by specific antibodies. SP, signal peptide.
3.3. Differential Protein Abundance Analysis of Depleted and Control Cells after Label-Free Quantitative MS
3.3. Differential protein abundance analysis of depleted and control cells after label-free quantitative MS
After growth for 72 or 96 h, 1 × 10⁶ cells (corresponding to roughly 0.2 mg protein) should be harvested by centrifugation, washed twice in phosphate-buffered saline (PBS), and lysed in 400 µl of lysis buffer, i.e. 6 M Guanidine-hydrochloride (GnHCl), 10 mM Tris(2-carboxyethyl)phosphine hydrochloride (TCEP), 40 mM 2-chloroacetamide in 100 mM Tris, pH 8.5., by heating for 3 min to 95 °C and subsequent bath sonication for 40 min at room temperature [24][29][30][31][32][33][34][35][36][24][29][30][31][32][33][34][35]36].
At this stage, samples were frozen in liquid nitrogen and shipped to the collaboration partners on dry ice for MS. The subsequent analytical steps, such as differential protein abundance- and SP-analysis, are described in reference 24.
3.4. Differential CET of Depleted and Control Cells
3.4. Differential CET of depleted and control cells
CET can be carried out for rough microsomes that were prepared from depleted or control HeLa cells [15][21]. For this, 30 x 106siRNA treated cells or 15 x 107 untreated cells should be harvested and washed once with PBS and twice with HEPES buffer (50 mM HEPES/KOH pH 7,5; 0.25 M sucrose; 50 mM KOAc; 6 mM MgOAc; 4 mM PMSF; 1 mM EDTA; 1 mM DTT; 0,1 mg/ml Cycloheximide; 0.3 U/ml RNAsin; protease inhibitor cocktail). After homogenization using a glass/Teflon homogenizer the suspension should be centrifuged at 1,000 g for 10 min. The supernatant should be centrifuged at 10,000 g for 10 min. The new supernatant should be layered onto a 0.6 M sucrose cushion (50 mM HEPES/KOH pH 7,5; 0,6 M sucrose; 100 mM KOAc; 5 mM MgOAc; 4 mM DTT; 0,1 mg/ml Cycloheximide; 40 U/ml RNAsin) and centrifuged at 230,000 g for 90 min. All steps after the first washing step were carried out on ice.
The resulting membrane pellet should be resuspended in HEPES buffer and stored at -80°C until its shipment to the collaboration partners on dry ice. The subsequent analytical steps are described in reference 15.
Notably, CET can also be carried out for intact depleted or control cells. For this purpose, cell culture samples were frozen and stored in liquid nitrogen until their shipment to the collaboration partners on dry ice for CET.
3.5.
Differential Live Cell Calcium Imaging in Cytosol or ER of Depleted and Control Cells
Differential live cell calcium imaging in cytosol or ER of depleted and control cells
For calcium imaging in the cytosol, prepare calcium-free buffer (140 mM NaCl, 5 mM KCl, 1 mM MgCl2, 0.5 mM EGTA, 10 mM glucose in 10 mM HEPES-KOH, (pH 7.35)). Solubilize FURA-2 AM in DMSO to obtain an 1 mM stock solution. Mix using a vortex until the solution is homogenously light yellow. Protect cup from light. Dilute the FURA-2 AM stock solution into 1 ml DMEM medium containing 10% fetal bovine serum (FBS) and 1% penicillin/streptomycin to a final concentration of 4 µM for loading of HeLa cells. Dissolve Thapsigargin (TG) in DMSO to obtain a 1 mM Stock solution. Store aliquots at -20 °C. Prior to use, dilute stock solutions into calcium-free buffer to a final concentration of 100 µM. Thus, final DMSO concentration for live cell imaging does not exceed 0.1%. Dissolve trifluoperazine (TFP) in DMSO to a concentration of 10 mM and store aliquots at -20 °C. The complete procedure can be seen in a video (https://www.jove.com/v/2730/live-cell-calcium-imaging-combined-with-sirna-mediated-gene-silencing, last accessed September 29, 2025).
Gene silencing and expression for plasmid-based complementation should be performed for 96 h as described above (2.2.2., 2.2.6.), except for the placement of a glass cover slip to the bottom of the culture dish. Prior to measurement, transfer the cover slip coated with transfected cells in a separate 3.5 cm culture plate (Figure 4). Load the cells with 4 µM FURA-2 AM in 1 ml DMEM for 45 min at 25 °C in the dark [3][4][7][13][17][25][28][37][38]. Fix a 25 mm cover slip in the iMIC metal chamber, wash cells twice and incubate in a calcium-free buffer (each time 300 µl). Start collecting data on an iMIC microscope with polychrome V by alternately exciting at 340 nm and 380 nm and measuring the emitted fluorescence at 510 nm (Filter set: beamsplitter, 565 nm; emitter, 605/70 nm). Sample images containing 20-50 cells/frame every 3 s. Record FURA-2 signals as the ratios F340/F380, where F340 and F380 correspond to the background-subtracted fluorescence intensity at 340 and 380 nm, respectively. After 1 min, treat cells with puromycin (500 µM) in calcium-free buffer or with the same buffer. Alternatively, treat cells with a small molecule inhibitor (such as 10 µM TFP or 100 µM Ophibolin A) or with the calcium-free buffer. After ratiometric measurements are carried out for 2 or 10 min, add the SERCA inhibitor TG (1 µM) and continue the measurements. Eventually, cytosolic [Ca2+] is estimated from ratio measurements by an established calibration method. Analyze data with Excel 2007 and Origin 6.1 [4].
Notably, live cell calcium imaging can be carried out in the ER, using Fluo5N or the genetically encoded D1ER, which was kindly provided by R.Y. Tsien.
3.6. Differential Live Cell ATP-Imaging in Cytosol or ER of Depleted and Control Cells
3.6. Differential live cell ATP-imaging in cytosol or ER of depleted and control cells
Live-cell imaging of ATP in the cytosol and ER lumen can be performed using the genetically encoded ATP sensors ATeam and ERAT4.01, respectively (Figure 4) [25]. SLC35B1 silencing and expression for plasmid-based complementation in HeLa cells should be performed for 96 h as described above (Table 1) (2.2.2., 2.2.6). In addition, 24 h before measurement (72 h after the first siRNA transfection), the cells should be transfected with 1 µg of the plasmids encoding the respective ATP sensor using Fugene HD. Then, 8 h after the last transfection, cells should be seeded on 25 mm glass coverslips. Prior to the ATP measurements, the cells should be incubated at room temperature for at least 2 h in loading buffer (135 mM NaCl, 5 mM KCl, 2 mM CaCl2, 1 mM MgCl2, 20 mM HEPES, 2.6 mM NaHCO3, 0.44 mM KH2PO4, 0.34 mM Na2HPO4, 10 mM D-glucose). Coverslips should be placed in a perfusion chamber, and imaging should be performed at room temperature in Ringer’s buffer (145 mM NaCl, 4 mM KCl, 2 mM MgCl2, 2 mM CaCl2, 10 mM Hepes, 10 mM glucose, pH 7.4). Then cells are imaged using a Cell Observer High Speed microscope. The sensors should be excited using 420 nm, 505 nm, and white light LEDs, while emission light should be collected with CFP and YFP single-band filters. Images of all channels are acquired every 3 s, and FRET-ratios are calculated with AxioVision Software [25]. Background fluorescence should be subtracted, and the values should be corrected for bleed-through and bleaching. Data can be analyzed using a statistical Software (such as Microsoft Excel 2013), and P values should be determined using unpaired t-tests.
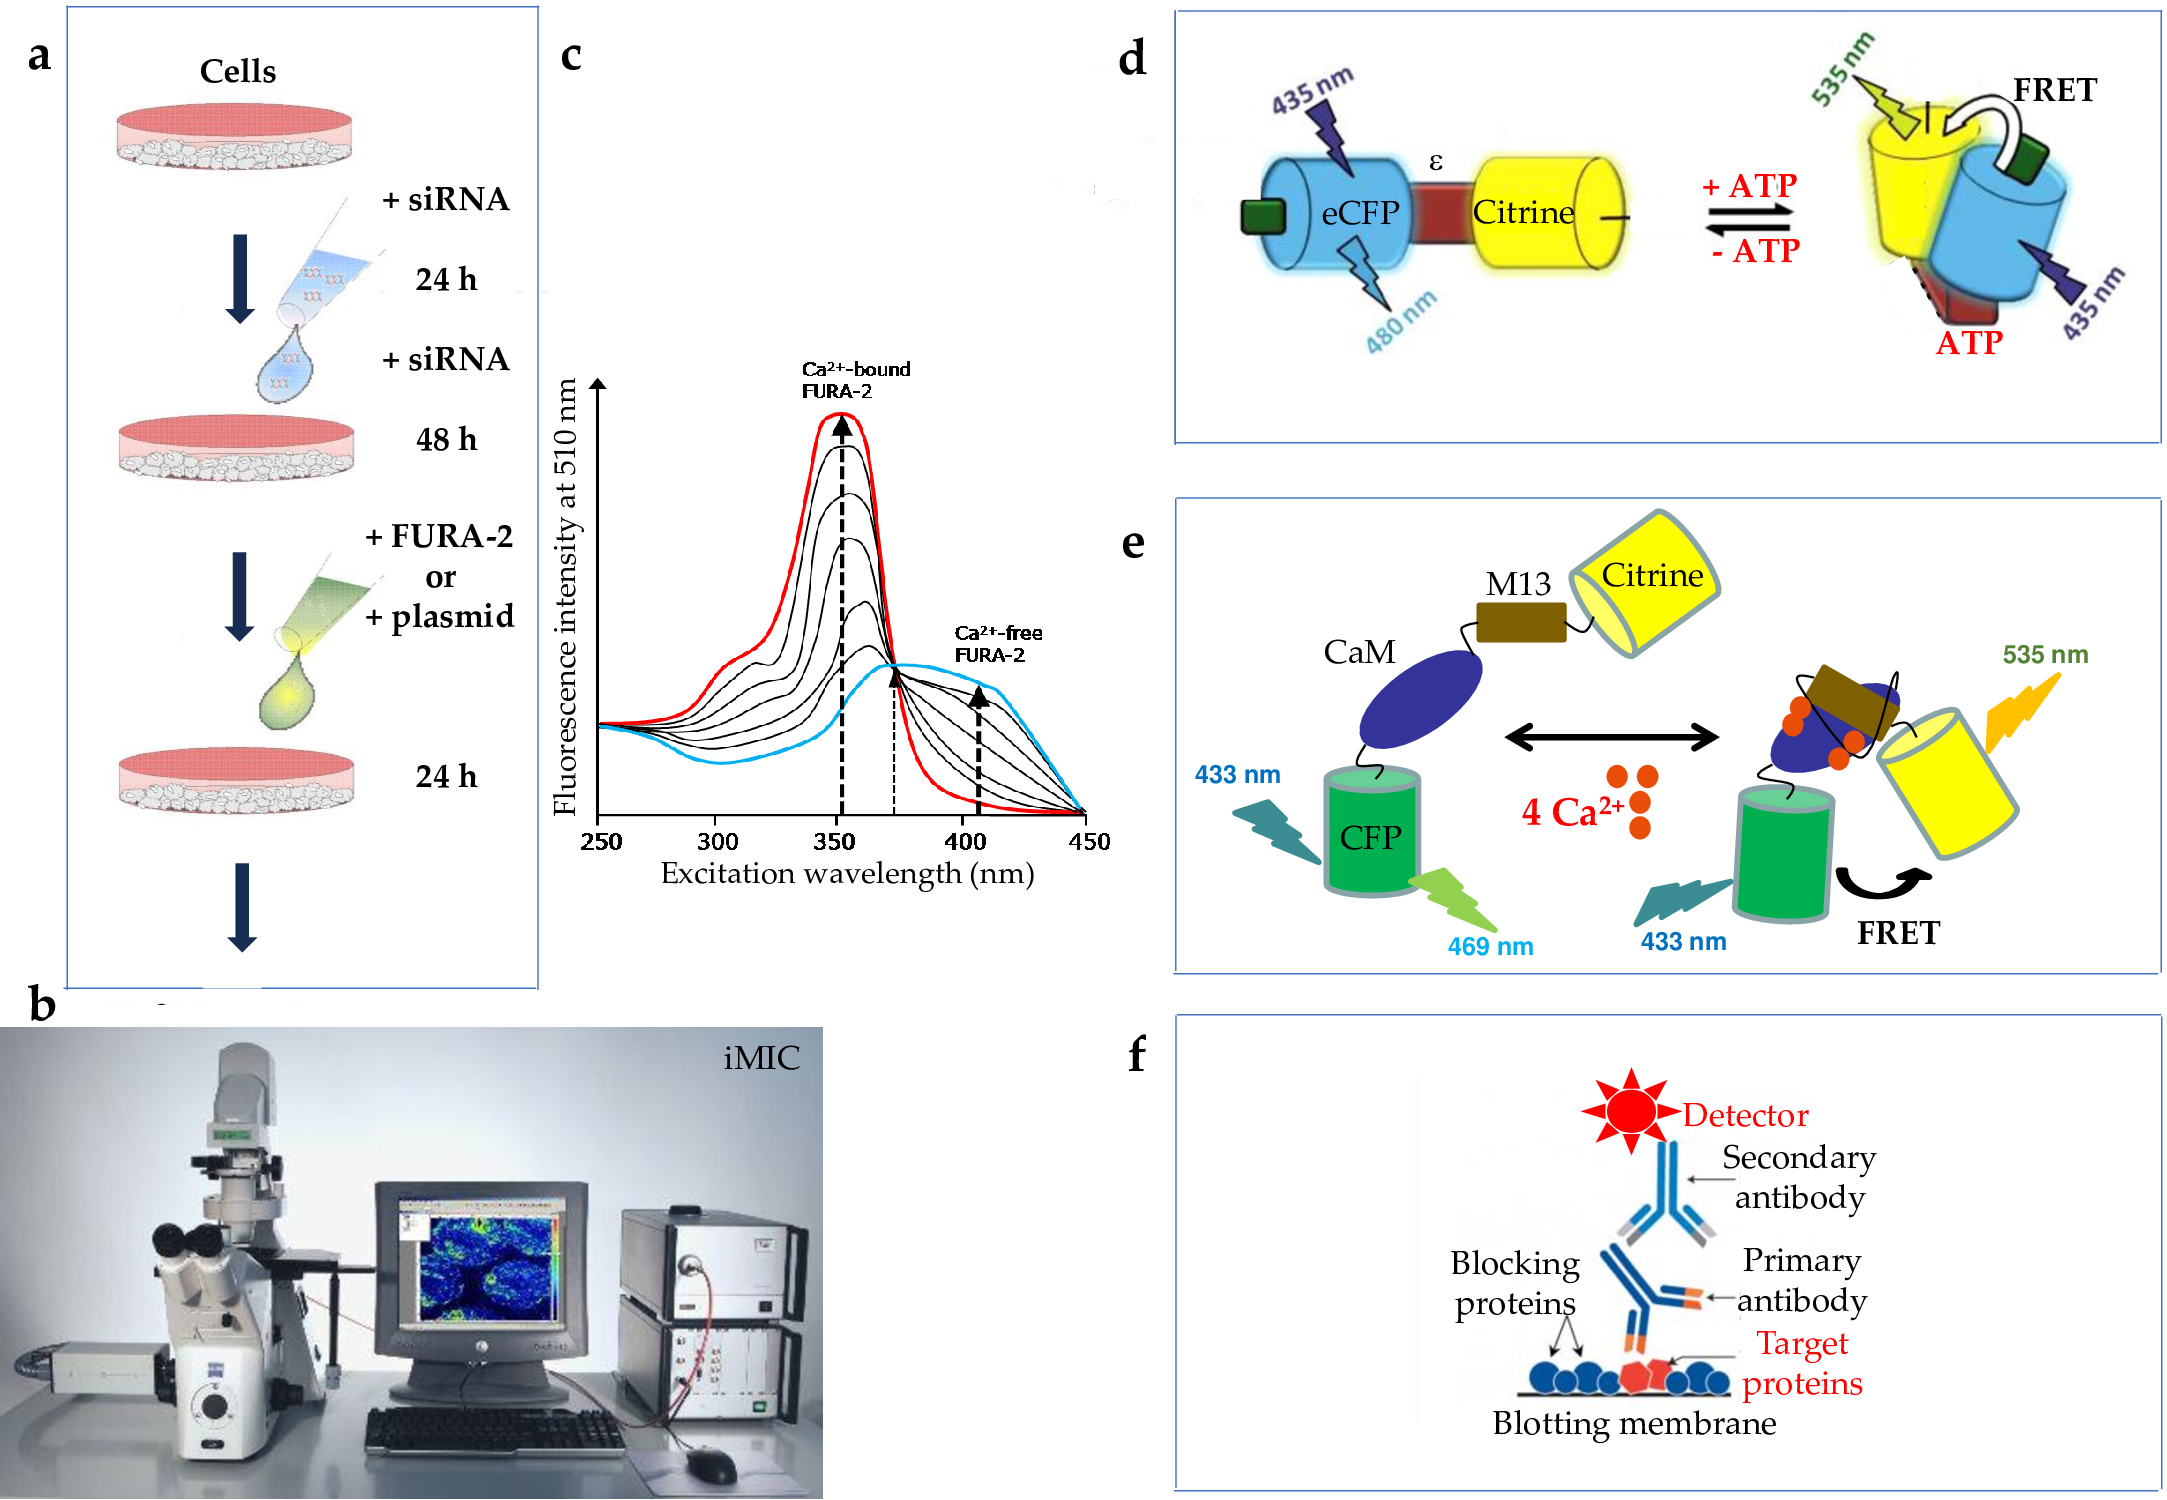
Figure 4. Experimental strategies for studying ER calcium and ATP content, respectively. (a) After gene silencing in cells as described in Figure 2b for 72 h, ratiometric dyes such as FURA-2 (c) or genetically encoded sensors (d, e) were added. After 24 h, live cell calcium imaging or ATP imaging were carried out employing an iMICTM system with Axiolab microscope (Zeiss, Jena, Germany), with 20x/0.75 M27 Fluar objective, polychrome V alternately exciting at 340 nm and 380 nm and measuring the emitted fluorescence at 510 nm) and TILLvisION 4.5 software (Till photonics, Gräfelfing, Germany) (b) and Cell ObserverTM High Speed microscope (Zeiss, Jena, Germany) with 40x oil Fluar objective, Evolve 512 EMCCD camera (Photometrics), sensors exciting at 420 nm or 505 nm, white light LEDs (Colibri), Semrock HC filter colleting emission light with CFP, YFP single-band filters, and AxioVision Software (not shown), respectively. (f) Silencing was monitored by Western blot.
3.7. Differential cell migration analysis for the identification of novel oncogenes and their possible small molecule inhibitors in depleted and control cells
Cell migration can be tested with the BD Falcon FluoroBlok system in 24-well inserts which is based on the Boyden chamber principle (Figure 5a,b b) [8][9][10][13][22]. The bottom of the inserts is formed by a fluorescence-blocking PET membrane with 8 µm pores, which allow the migration of cells. A total of 2.5 x 10⁴ cells treated with control siRNA or targeting siRNAs, e.g. directed against SEC62, in DMEM-medium containing 0.5% FBS is loaded into the inserts. The inserts should be placed in the 24-well plates, comprising DMEM-medium with 10% FBS as an attractant. After 24, 48, or 72 h the cells that had migrated through the pores should are fixed with methanol and stained with propidium iodide or DAPI. Migrated cells on the underside of the membrane can be imaged by fluorescence microscopy using the Nikon Eclipse TETM 2000-S inverted fluorescence microscope with Digital Sight DS-Fi1 camera (2/3 inch color, 5.24 megapixel) (Nikon, Düsseldorf, Germany). The images can be subjected to semi-automatic quantitative analysis via the NIS Elements AR 3.2 software.
Notably, cell proliferation has to be tested in parallel in order to differentiate between effects of the targeting siRNA on proliferation and migration, respectively. This can be done using the Countess® Automated Cell Counter or by employing the xCELLigenceTM RTCA SP system with RTCA 2.0 software and 96-well E-plates (Agilent Technologies GmbH, Bremen, Germany) (Figure 5c) [8][9][10][13][22].
Alternatively, cell migration can be quantitatively analyzed in real-time with an xCELLigenceTM RTCA DP system with RTCA 1.2 software and 16-well CIM devices (Agilent Technologies GmbH, Bremen, Germany). In this system, 1.0 x 10⁴ or 2.0 x 10⁴cells treated either with siRNA (Sec62 or control) or left untreated, are seeded in the upper chamber in the normal culture medium of the respective cell line without FBS. This upper chamber is placed on the lower part of the CIM device containing growth medium supplemented with 10% FBS as an attractant or without FBS (negative control). Migration of the cells should be followed over a time period of up to 18 h in real-time as changes of the impedance signal in a CIM device measured on the backside of the membrane and cell proliferation monitored in a 96-well E-plate of the xCELLigence SP system [8][10][13][22].
3.8. Differential Cell Invasion Analysis for the Identification of Novel Oncogenes and Their Possible Small Molecule Inhibitors in Depleted and Control Cells
3.8. Differential cell invasion analysis for the identification of novel oncogenes and their possible small molecule inhibitors in depleted and control cells
Cell invasion can be tested in a BD BioCoat Matrigel Tumor Invasion System with matrigel coated 24-well inserts (Figure 5a,b b) [8]. A sample of 2.5 x 10⁴ cells treated with control siRNA or targeting siRNAs, e.g. SEC62 siRNAs, are placed in this system in DMEM-medium containing 0.5% FCS. The inserts are set into DMEM-medium with 10% FCS as an attractant. After 48 h, the cells are fixed with methanol and stained with propidium iodide. Invaded cells can be imaged by fluorescence microscopy using the Nikon Eclipse TE 2000-S inverted fluorescence microscope with NIS Elements AR 3.0 software. To quantify invasion, the described system should be used on a 6-well scale. In this case 3.5 x 10⁵ cells should be loaded into the inserts. After 48 h invasive cells are stripped off with trypsin/EDTA and counted.
Notably, cell proliferation has to be tested in parallel to differentiate between effects of the targeting siRNA on proliferation and invasion, respectively. This can be done using the Countess® Automated Cell Counter or by employing the xCELLigence SP system in 96-well E-plates (Figure 5c) [8].
Alternatively, cell invasion can be quantitatively analyzed in real-time with an xCELLigenceTM RTCA DP system with CIM devices (Figure 5d) [8].
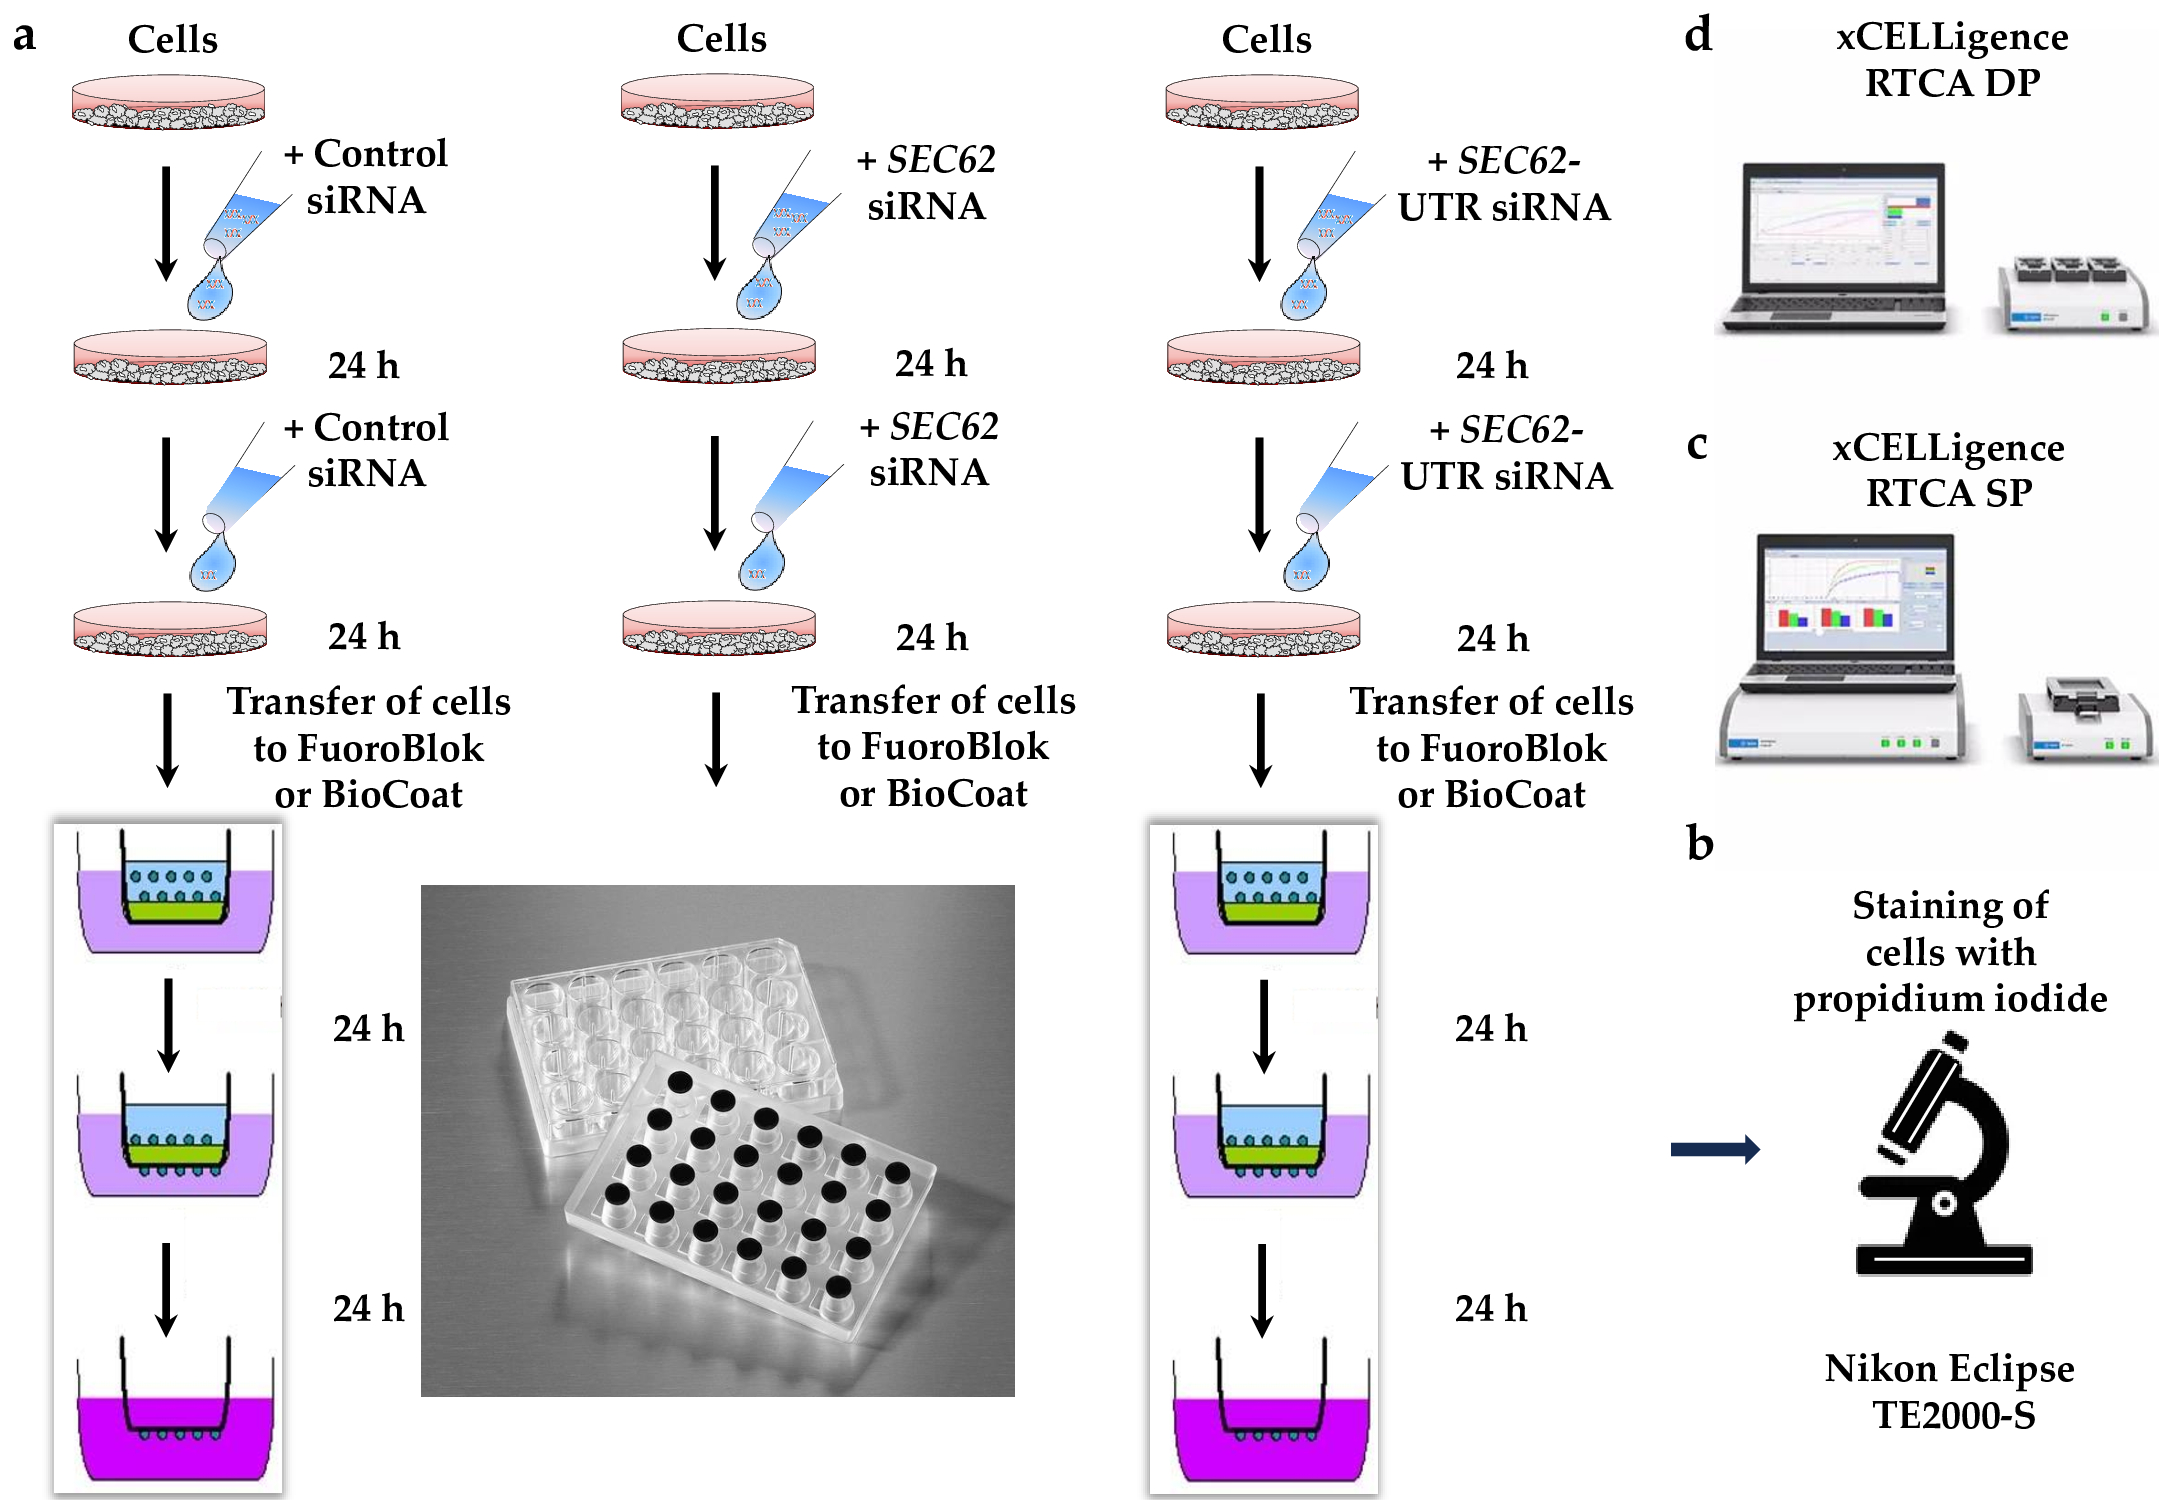
Figure 5. The experimental details of cell migration and invasion. (a) After gene silencing as described in Figure 2 for 48 h, cells are transferred to the inserts of the BD FluoroBlok or BD BioCoat Matrigel system and the inserts are placed into 24-well plates, which contain medium with 10% FBS as a chemoattractant [8]. The lower part represents the principle of the Boyden chamber and a 24-well plate. (b) After 48 h, the cells that accumulated at the underside of the inserts are fixed in methanol and stained with propidium iodide or 4´6-diamino-2-phenylindole (DAPI). Next the cells are imaged and automatically counted using the inverted Nikon fluorescence microscope and NIS Elements software. (c) In parallel, cell proliferation is monitored under the different conditions using the Countess® Automated Cell Counter or by employing the xCELLigence RTCA SP system with 96-well E-plates[8]. (d) Alternatively, migration and invasion are monitored using the xCELLigence DP system with 16-well CIM devices [8].
4. Representative Results and Ttheir Interpretations
4.1. Mechanisms of Biogenesis of Model Secretory or Membrane Proteins at the ER of Intact Cells or SPCs
4.1. Mechanisms of biogenesis of model secretory or membrane proteins at the ER of intact cells or SPCs
The original aim of our research into the biogenesis of small presecretory proteins was prompted by the identification of the first components that are involved in targeting of presecretory proteins to the ER in mammalian cells, namely the cytosolic ribonucleoparticle SRP and its ER-membrane resident receptor, SRP-receptor (SR) [23][26]. A key feature of this system is that it delivers nascent polypeptide chains with N-terminal signal peptides (SPs) together with the translating ribosomes to the polypeptide-conducting channel in the ER membrane, the Sec61 complex, and coined the term cotranslational ER protein import. However, since there are about 40 amino acid residues of nascent polypeptide chains hidden in the ribosome and SPs typically comprise about 30 amino acid residues, small presecretory proteins, i.e. presecretory proteins with a content of less than 70 amino acid residues, appeared as unlikely substrates of this targeting system. Therefore, we became interested in the components and mechanisms that are involved in posttranslational targeting of the approximately 200 small precursors to and their subsequent translocation into the human ER. The analysis was carried out in cell-free translation systems that contained purified canine pancreatic microsomes and, after siRNA technology entered the stage, SPCs, which were selectively depleted of a certain transport component. Indeed, because of their size small presecretory proteins can use the SRP/SR system only inefficiently and, instead, use alternative targeting systems, the TRC/GET- or SND-pathway or may be directly targeted to Sec62. Even so, these precursors turned out to be translocated into the ER by the Sec61 complex, which told us that this polypeptide-conducting channel is not per se mechanistically linked to translation and that there must be other driving forces involved in this posttranslational translocation [5]. Briefly, subsequent cell-free studies characterized the two resident ER-membrane proteins Sec62 and Sec63 and the ER-lumenal Hsp70-type chaperone BiP as auxiliary factors of some small precursors, such as preproapelin [23]. Simultaneously, we observed that replacement of wildtype Sec61a with mutant Sec61aY344H, which is linked to diabetes in mice, had the same effect as BiP depletion [11]. Furthermore, we found that the Sec61 channel inhibitor CAM741 also mimicked the effect of BiP depletion [23].
Interestingly, similar studies led to the conclusion that the biogenesis of some large presecretory proteins, such as pre-ERj3, involves the same components and mechanisms as the small ones and that this can be observed in intact human cells [5][11][30]. Thus, even some SPs of large precursors are not “strong” enough to trigger Sec61-channel opening on their own and therefore require help from auxiliary transport components, such as Sec62, Sec63 and BiP. The gold standard control of complementation of the respective UTR siRNA by a SEC62 or SEC63 expression plasmid confirmed the conclusion [30]. Furthermore, we observed that mutant variants of Sec63 that did not allow the interactions between Sec63 and Sec62 or Sec63 and BiP were unable to rescue the depletion phenotype of the wildtype proteins [23][30]. In addition, replacement of wildtype Sec61a with mutant Sec61aY344H in the same cellular model had the same effect as BiP depletion. Therefore, we concluded that BiP supports Sec61 channel opening by binding to the ER lumenal loop 7 of Sec61a, which harbours tyrosine 344. In analogy to the ER import of preproapelin, the precursor-specific translocation defect of pre-ERj3 after BiP depletion was mimicked by the Sec61-inhibitor CAM741. Therefore, we suggested that BiP supports the same essential step in Sec61-gating that is inhibited by CAM741 also for the large precursor polypeptide. Furthermore, we suggested that the allosteric effectors of the Sec61 channel act by lowering the activation energy for channel opening and that certain disease-linked mutations of the Sec61a subunit as well as some Sec61 channel inhibitors, such as CAM741, may increase the activation energy for channel opening for preproapelin as well as pre-ERj3. In both cases, a cluster of positively charged residues downstream of the SP appeared to contribute to the phenotype [23][30].
Notably, the in cellulo experiments also led to the discovery that some precursor proteins, which are destined to the secretory pathway, are imported into mitochondria under conditions of inhibition of ER protein import, such as Sec61 depletion [12]. This may serve the same cellular purpose as degradation by the proteasome, at least in the short term.
4.2. Rules of Engagement for Components of Global Biogenesis of Secretory and Membrane Proteins at the Human ER
4.2. Rules of engagement for components of global biogenesis of secretory and membrane proteins at the human ER
The successful establishment of siRNA strategies for the analysis of ER protein import in HeLa cells (4.1.) allowed us to globally address the questions of which import components are involved in the targeting of what type of precursor proteins and which components facilitate Sec61 channel opening in the biogenesis of what kind of soluble and membrane proteins [24][29][30][31][32][33][34][35][36]. The approach was to combine the siRNA strategy with quantitative proteomic analysis of depleted and control cells and subsequent differential protein abundance analysis. It was based on the reasonable expectation that precursors, which depend on a certain component, accumulate in the absence of this component are therefore degraded by the ubiquitin/proteasome system.
As a proof of concept, HeLa cells were depleted of the Sec61-complex using two different SEC61A1-targeting siRNAs [24]. We assessed the proteomic consequences of this knock-down via label-free quantitative proteomics and differential protein abundance analysis relative to cells treated with non-targeting (termed control) siRNA. About 7,000 different proteins quantitatively characterized by MS, representing roughly 50% of the cellular proteome. Of these proteins, approximately 5,000 were detected in all samples and were therefore statistically analyzed. They included good representation of proteins with cleaved SP (6%), glycoproteins (8%), and membrane proteins (12%). Statistical analysis of the ratio changes after targeting versus non-targeting siRNA treatment (q<0.05, i.e. permutation false discovery rate-adjusted p-value) revealed that Sec61α depletion significantly affected the steady-state levels of 824 proteins: 482 negatively and 342 positively. As expected, Sec61α itself was negatively affected. The proteomic approach confirmed that the Sec61β and Sec61γ subunits were degraded upon depletion of Sec61α. Among the other negatively affected proteins, Gene Ontology (GO) terms assigned 61% to organelles of the endocytic and exocytic pathways, representing a strong enrichment compared to the value for the total quantified proteome (26%). We also detected significant enrichment of precursor proteins with SP (6.5-fold), N-glycosylated proteins (5.4-fold), and membrane proteins (3.0-fold). This suggested that the precursors of these proteins, 197 with SP and 98 with SP-equivalent transmembrane helix (TMH), are substrates of the Sec61-complex and were therefore degraded by the proteasome upon Sec61 depletion. Also as expected, the positively affected proteins included compensatory components, including the two subunits of the SRP receptor. Bioinformatic analysis predicts that ~30% of the total quantified proteome comprises Sec61 substrates. Hence, our experimental approach underestimated the number of different precursor polypeptides that rely on the Sec61-complex.
Thus, our experimental strategy in human cells was successfully used to analyze the client spectrum or precursor preference of the Sec61-complex—an essential transport component (Figure 6a). These results further set the stage for subsequent analysis of many precursor-specific transport components, including the TRAP-complex [24]. In the latter case, SP analysis of TRAP clients revealed above-average glycine-plus-proline content and below-average hydrophobicity as the distinguishing features. Thus, TRAP may act as SP receptor on the ER-membrane’s cytosolic face, recognizing precursor polypeptides with SPs with lower helix propensity and/or low hydrophobicity, and triggering substrate-specific opening of the Sec61-channel. Inspection of the data also showed a tendency towards lower overall hydrophobicity and higher glycine and proline (GP) content for TMH of TRAP dependent membrane proteins. This is discussed in further detail below in the context of the recently determined TRAP architecture, in which individual TRAP subunits were assigned positions within the overall density of the mammalian TRAP-complex in native ER membranes by the combination of gene silencing and CET (see 4.3.) [15][21].
The gold standard control of the respective TRAPB-UTR siRNA by a TRAPB expression plasmid confirmed the conclusion in experiments that were carried out as described in 4.1. for a set of TRAP dependent precursor polypeptides [24]. Furthermore, these kind of experiments with mutant variants of these precursors confirmed that the observed effect of the GP-content is indeed responsible for the phenotype.
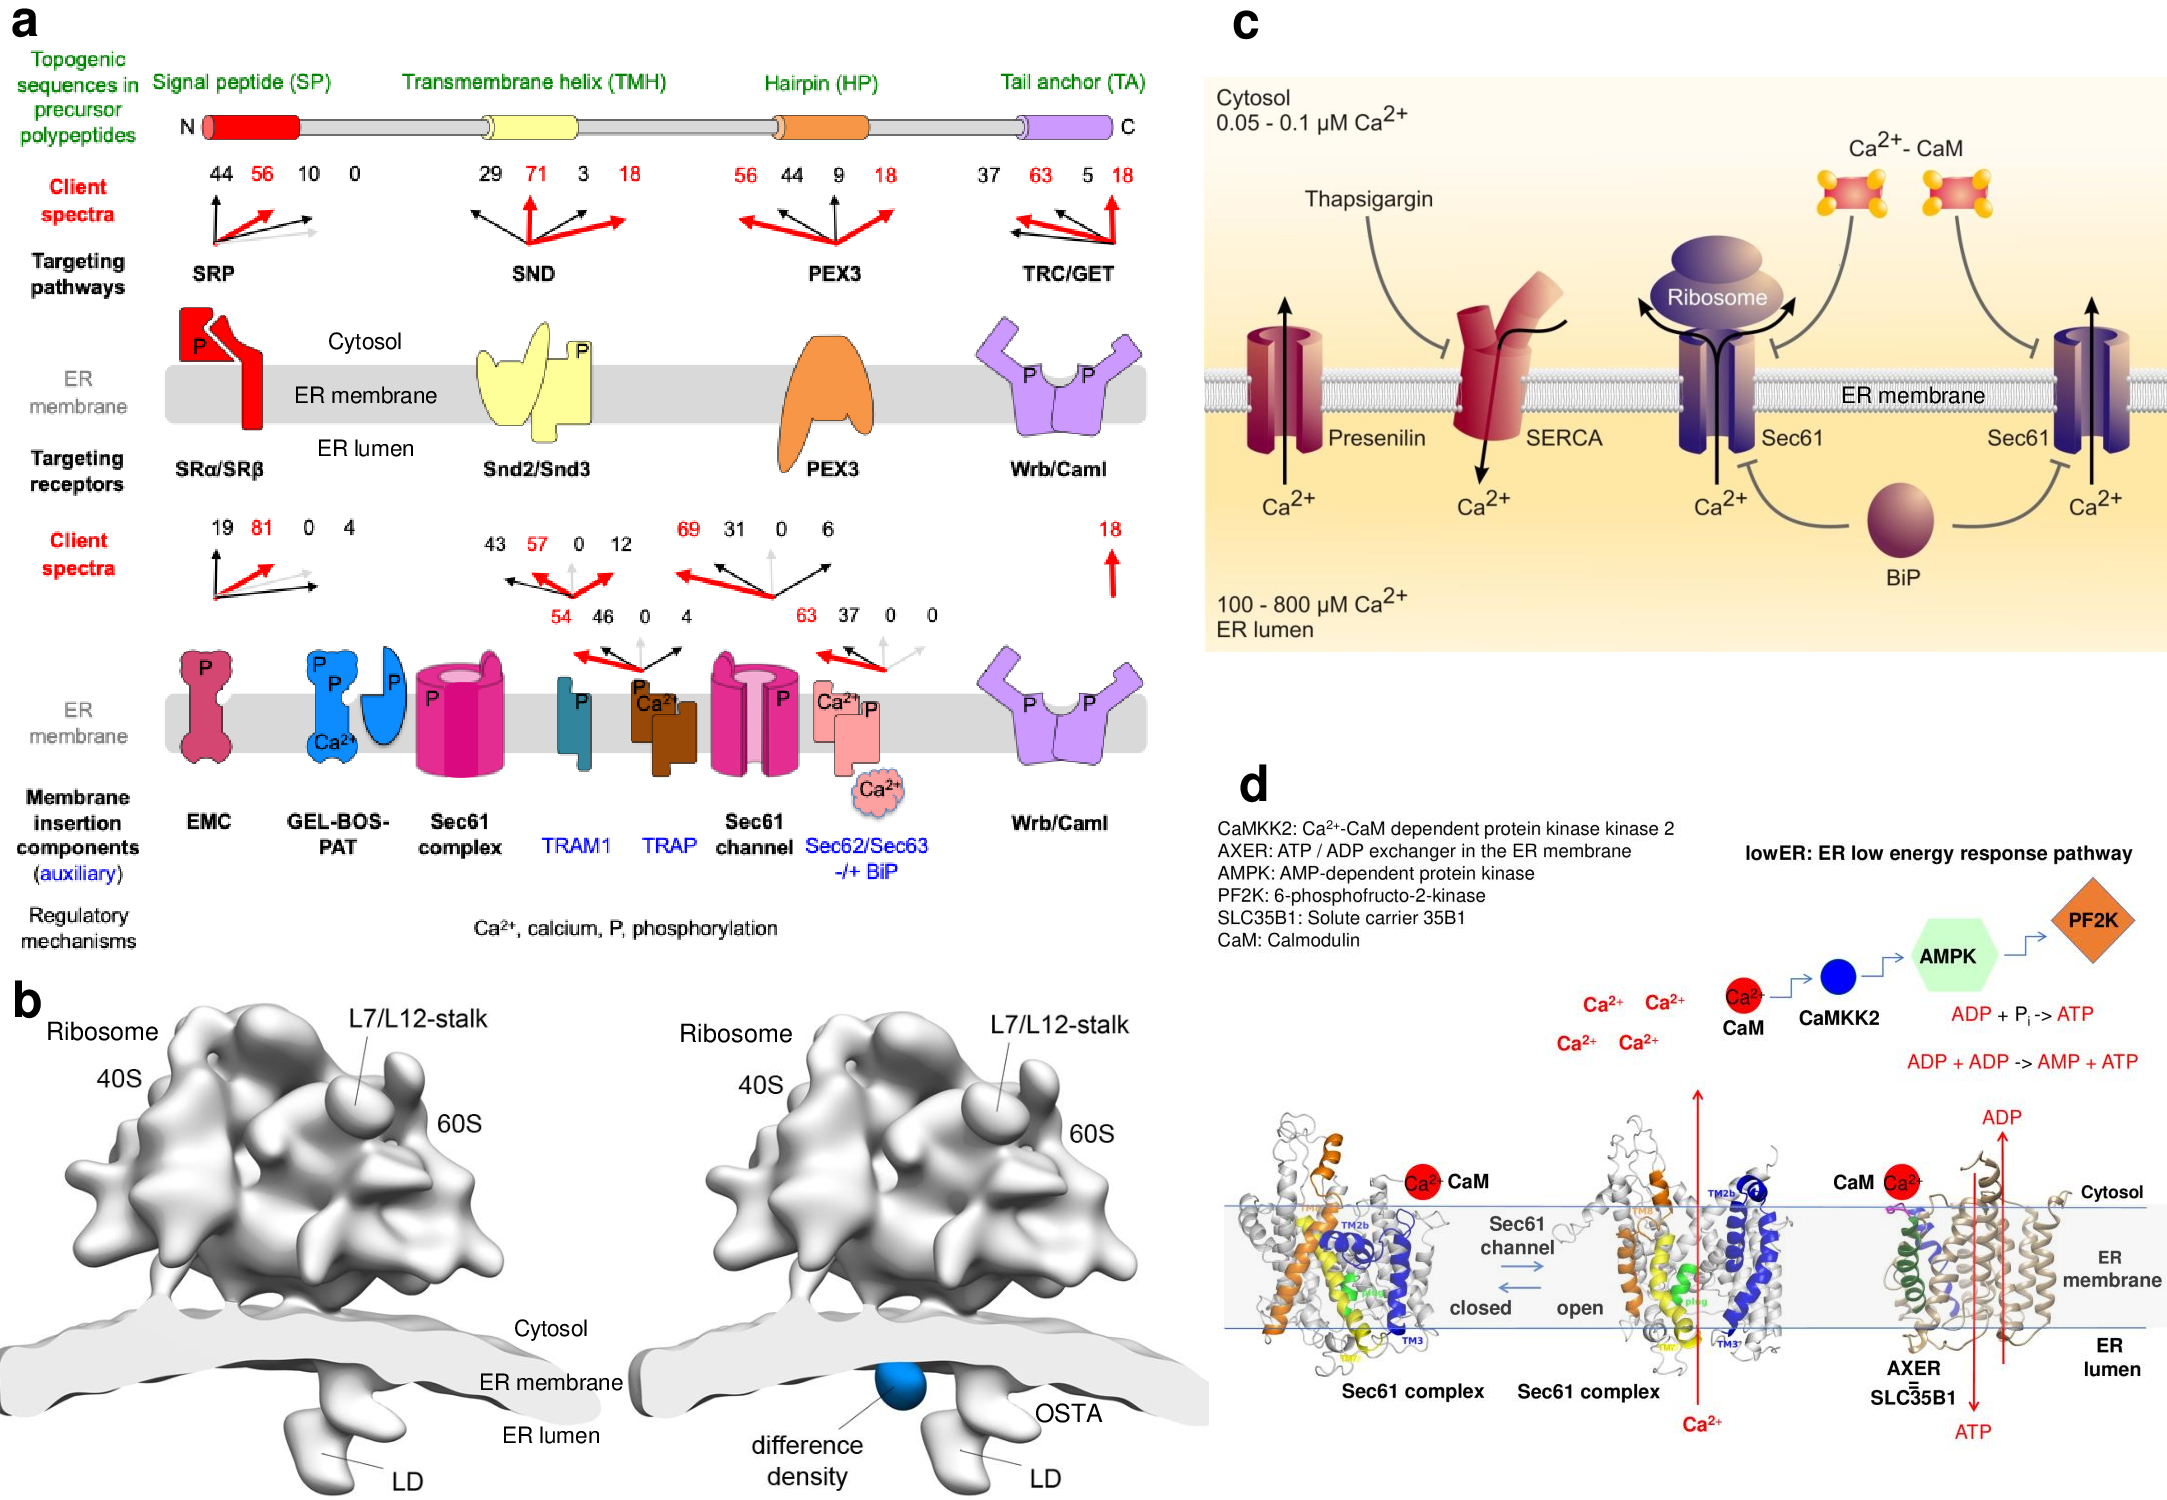
Figure 6. Summary of interpretations. (a) The experimental strategy was as follows: siRNA-mediated gene silencing using two different siRNAs for each target and one non-targeting (control) siRNA, respectively with six/nine replicates for each siRNA; label-free quantitative proteomic analysis; and differential protein abundance analysis to identify negatively affected proteins (i.e. clients) and positively affected proteins (i.e. compensatory mechanisms). The cartoon summarizes the client spectra or precursor preferences of several ER targeting and import components [24][29][30][31][32][33][34][35][36]. The red arrows highlight top scoring numbers > 10, light grey arrows represent the number 0 and are shown to indicate that fact. (b) HeLa cells were treated with TRAPβ- or control-siRNA. The subtomogram average for microsomes, isolated from TRAPβ depleted HeLa cells is shown with (left) and without (right) the difference density to the control, isosurface rendered at 6σ (blue). All structures were filtered to a resolution of 40 Å. (c) Working model for passive efflux of calcium from the ER via the open Sec61 channel and its suppression by Calmodulin and BiP [3][5][7][11]. (d) Working model for ATP/ADP exchange between cytosol and ER. Human SLC35B1 provides ATP to the ER and was named ATP/ADP exchanger in the ER membrane or AXER [25]. Furthermore, we characterized a regulatory circuit that is able to maintain the ATP supply in the ER ad hoc and was termed ER low energy response or lower [25].
4.3. Identification and Structural Characterization of Proteins in Ensembles of ER Membrane Proteins
4.3. Identification and structural characterization of proteins in ensembles of ER membrane proteins
The idea was to complement our studies on protein import into the human ER with structural analysis of components that are involved in this process in human cells [15][21]. As a proof-of-principle for the identification of proteins in ensembles of membrane proteins by CET, TRAPβ was chosen as a target due to the previously established position of TRAP in the detergent-extracted translocon by single particle analysis after cryo-EM. Western blotting indicated a nearly quantitative depletion of the target protein as well as all other TRAP subunits. Consistent with the control dataset, translocons including (43 %) and lacking (57 %) lumenal density (LD) were present in the TRAPβ knockdown data. Only particles including LD were retained for the final average. Different from the control, essentially the entire density assigned to TRAP disappeared (Figure 6b), which is also highly significant in the difference map to the control. Thus, the [51][52][53][54][55][56][57][58][59][60][61][62][63][64][65][66][67][68] position of human TRAP, previously assigned based on the purified and solubilized ribosome-Sec61-TRAP complex, was confirmed in situ and we concluded that a 60 kDa lumenal density can be localized accurately using in situ CET in combination with gene silencing. Similar experiments were carried out for OST.
We have attempted to interpret our present findings, which were described in 4.2., on a structural basis in the context of the TRAP architecture, in which individual TRAP subunits were assigned positions within the overall density of the mammalian TRAP-complex in native ER membranes [15][21][34][35][36]. As visualized by CET, TRAPγ assumes a central position in the mammalian TRAP-complex, contacting eL38 and a short rRNA expansion segment on the ribosome, thus coordinating the remaining TRAP subunits with the ribosome and the other translocon components: the Sec61-complex (contacted by TRAPαβ) and OST (contacted by TRAPd). The bacterial ribosomal components uL24 and H59 were observed to coordinate the SP for SRP binding. Assuming a similar SP position in the human system, the N-terminal SP tip may be close enough to interact with eL38 and the cytosolic domain of TRAPγ during the hand-over of the SP from SRP to Sec61. According to this hypothetical scenario, TRAP may support the insertion of SP into the Sec61-channel in the productive hairpin (rather than head-first) configuration. We further propose that high GP content and low hydrophobicity may extend the time that SPs dwell on the cytosolic surface of the Sec61-channel, and that TRAP can compensate for this by stabilizing SPs (and TMHs) on the cytosolic side and by potentially facilitating Sec61-channel gating on the lumenal side. This raises the question of how TRAP signals the presence of an SP-bearing ribosome to the Sec61-channel, and supports Sec61-channel gating. In vitro experiments support the concept that auxiliary components, such as TRAP, facilitate Sec61-channel opening in a substrate-specific manner, i.e. for precursor polypeptides with weak SPs. Strikingly, the ER-lumenal domains of the TRAPαβ-subcomplex contact loop 5 in the hinge region between the N- and C-terminal halves of Sec61α, and thus may facilitate Sec61-channel opening to allow initiation of protein translocation. This is consistent with our respective live-cell Ca2+ imaging experiments after TRAP depletion. Thus, the high-resolution structure emphasized the similarity of Sec61 interactions of heterotetrameric TRAP and Sec62, Sec63, and BiP that may be suggestive of a similar mechanism (see 4.1.).
4.4. Channels for Passive ER Calcium Efflux from the ER and Their Regulatory Mechanisms
4.4. Channels for passive ER calcium efflux from the ER and their regulatory mechanisms
Our observations that the Sec61 channel is permeable to Ca2+ and its efficient opening mediated by allosteric effectors (4.1.) [63] [63]raised our interest in the questions if the Sec61 complex is a significant contributor to passive Ca2+ efflux from the ER and if its efficient closing is also facilitated by effectors [70][71][74][77][80][84][94]. The ER is one of the two main reservoirs for releasable Ca2+in the cell and usually maintains free Ca2+ concentrations at least three orders of magnitude higher than in the cytosol (Figure 6c). When the SERCA, which pumps Ca2+ into the ER, is blocked by TG, the Ca2+ concentration in the ER decreases spontaneously, unmasking the Ca2+ leakage or passive Ca2+ efflux from the ER.
In our work, we first investigated whether silencing the SEC61A1 gene affected Ca2+ leakage from the ER [3]. After silencing the SEC61A1 gene using two different siRNAs in HeLa cells for 96 hours, Ca2+ leakage from the ER was greatly decreased. Thus, we characterized the Sec61 channel as an ER Ca2+ leak channel in human cells and estimated its contribution at 60%. Furthermore, we identified Calmodulin as limiting Ca2+ leakage in a Ca2+-dependent manner by binding to an IQ motif in the cytosolic N-terminus of Sec61α [7]. Next, we manipulated the concentration of the ER-lumenal chaperone BiP in cells in different ways (siRNA or toxin) and used live cell Ca2+ imaging to monitor the effects of reduced levels of BiP on ER Ca2+ leakage. Regardless of how BiP concentration was lowered, the absence of available BiP led to increased Ca2+ leakage from the ER at the level of the Sec61 complex [11]. When we replaced wildtype Sec61a with mutant Sec61aY344H in the same model cell, however, Ca2+ leakage from the ER increased and was no longer affected by manipulation of the BiP concentration [11]. We conclude that BiP also limits ER Ca2+ leakage through the Sec61 channel by binding to the ER lumenal loop 7 of Sec61a.
Based on these experiments, we expected one of the Hsp40-type cochaperones of BiP to contribute to the limiting of Sec61-mediated Ca2+ efflux from the ER (Table 1) [17]. Since depletion of the membrane resident J-domain protein Sec63 did not have this effect, we investigated whether knock down of the ER lumenal Hsp40s enhances Ca2+ efflux from the ER in HeLa cells. Since ERj3 and ERj6 were found to associate with the Sec61 complex, we first treated HeLa cells with two different ERJ3 or ERJ6siRNAs and carried out Ca2+ imaging as described above. In contrast to the control siRNA, the ERJ3 and ERJ6 siRNAs significantly enhanced the TG-induced Ca2+ efflux. Thus, the ER lumenal BiP cochaperones, ERj3 and ERj6, contribute to the suppression of Ca2+ leakage from the ER in human cells. We wondered whether simultaneous depletion of ERj3 and ERj6 has a more pronounced effect on Ca2+ efflux from the ER, as compared to the separate knock downs, and found this to be the case. Thus, there is cochaperone specificity involved in gating of the Sec61 channel, Sec63 being involved in channel opening and ERj3 and ERj6 in channel closing [17].
Within several molecular pathways for Ca2+ leakage that co-exist in ER membranes (such as mediated by presenilin), Sec61 translocons are unparalleled because they support both translocation of proteins into the ER and Ca2+ leakage from the ER, suggesting a dynamic coupling between ER membrane permeability and protein synthesis. Furthermore, the Sec61 translocons are ubiquitous and highly abundant. Therefore, it is not surprising that the Sec61-mediated Ca2+ leakage from the ER has been implicated in the etiology of various hereditary diseases as well as cancers [37][38][41][44][46].
4.5. Transporters for ATP/ADP Exchange between Cytosol and ER and Their Regulatory Mechanisms
4.5. Transporters for ATP/ADP exchange between cytosol and ER and their regulatory mechanisms
Because of the observed involvement of BiP in ER Sec61 channel opening as well as its closing (Figure 6c, 4.1.) and the known ATP dependence of BiP, we addressed the questions of how ATP is imported into and ADP exported from the ER [25].
Screening databases for solute carriers (SLCs) that are located in the ER membrane drew our attention to SLC35B1. Human SLC35B1 has up to three different isoforms that are encoded by different mRNA variants. It is a member of the nucleotide-sugar transporter family and was predicted to have ten transmembrane helices and to be structurally related to members of the drug/metabolite transporter (DMT) superfamily. To test whether SLC35B1 might act as an ATP/ADP transporter, we expressed cDNAs for SLC35B1 and SLC35B1/Isoform 2 in E. coli cells. The two heterologously expressed SLC35B1 isoforms were highly specific for ATP and ADP, which suggested that both SLC35B1 isoforms act in an antiport mode [25]. To further substantiate this transport mechanism, membrane proteins of the respective transfected cells were solubilized in detergent and reconstituted into liposomes. Both, SLC35B1 and SLC35B1/Isoform 2 were able to facilitate the import of ATP or ADP into proteoliposomes, loaded with ADP or ATP, whereas no import was detectable in absence of loading substrates [25]. This fact confirmed that the two SLC35B1 isoforms catalyze the strict antiport of ATP and ADP.
To directly address whether SLC35B1 acts as a transporter of chemical energy in the ER membrane of human cells, HeLa cells were treated with two different SLC35B1-targeting siRNAs for 96 h, and the knockdown efficiencies were evaluated by quantitative RT-PCR (qRT-PCR) analysis. The analysis showed that mRNA depletion was efficient: the 5´ untranslated region (UTR)-targeting siRNA knocked down the residual SLC35B1 level to ~10% and the coding region-targeting siRNA to ~20%. Next, the energy status of SLC35B1-depleted cells was characterized with time-resolved live cell recordings of ER ATP levels using the ER-targeted, genetically-encoded ATP FRET sensor ERAT4.01. ATP levels were detected and compared in the ER of HeLa cells treated with one of two different SLC35B1-targeting or control siRNAs, followed by ERAT4.01 transfection. SLC35B1 knockdown was correlated with significantly lower ATP levels in the ER compared to control cells. TG, which inhibits SERCA in the ER membrane and stimulates Ca2+ release from the ER, led to the expected increase in the ER ATP levels. The succeeding application of 2-deoxy-glucose (2-DG), which reduces the availability of ATP in the cytosol due to inhibition of glycolysis, induced the expected drop in ER ATP levels. In contrast, the response of SLC35B1 knockdown cells to both Tg and 2-DG was less pronounced. Thus, SLC35B1 knockdown in HeLa cells reduced ATP levels in the ER and these levels could not be replenished by Tg-induced Ca2+ efflux from the ER.
To further substantiate the observed siRNA effects, we performed complementation analyses. Specifically, the ATP imaging experiments that were conducted in the presence of the SLC35B1-UTR-targeting siRNA were repeated in the presence of SLC35B1- or SLC35B1/Isoform 2-expression plasmids that lacked the UTR. Under these complementation conditions, the ATP levels in the ER were rescued to the levels in the control conditions, and the rescued cells responded to Tg and 2-DG with the expected increase and decrease, respectively, in ATP levels in the ER, similar to the control cells [25].
In summary, the results from the heterologous expression experiments, SLC35B1 knockdown in HeLa cells in combination with live cell imaging of ATP levels in the ER, and complementation experiments strongly suggested that SLC35B1 and SLC35B1/Isoform 2 represent ATP/ADP exchangers in the human ER membrane that are responsible for net import of chemical energy into the ER (Figure 6d) [25]. Meanwhile, this was independently confirmed and the structure of AXER was solved by cryo-EM [64][65].
4.6. Identification of Novel Oncogenes That Play a Role in Cell Migration and Invasion and of Their Small Molecule Inhibitors
4.6. Identification of novel oncogenes that play a role in cell migration and invasion and of their small molecule inhibitors
Our cellular analyses of ER protein import and passive ER calcium efflux from the ER introduced us to the field of Sec61 complex associated human diseases, which we termed Sec61 channelopathies [39][41][44]. First, we addressed the reasons for the devastating effects of mutations in SEC61A1 or SEC63 in autosomal dominant severe congenital neutropenia or plasma cell deficiency, and autosomal polycystic liver disease (ADPLD), respectively [5][37][38][66]. In the case of the SEC61A1 mutations we observed a combination of selective ER protein import defects and increased Ca2+ leakage from the ER as possible disease cause [62][63]; in the case of SEC63 associated ADPLD we also found selective ER protein import defects and detected a connection to the Wnt signaling pathway [38][66].
However, over the past 15 years, increasing evidence also suggested a relevant role of SEC61, SEC62 and SEC63 genes in the development and tumor cell biology of human malignancies [42][46][50][51][52][53][54][55][56][57][58][59][60]. Most extensive evidence for a causative role of a protein translocation component in the development and tumor cell biology of human cancers exists for Sec62. In 2006, a first study found SEC62 copy number gains in 7 of 13 prostate cancer samples as well as elevated Sec62 protein levels in three prostate cancer cell lines [50]. In the following years, amplification and over-expression of the SEC62 gene were reported for various other cancer entities, including non-small cell lung cancer [8][10], thyroid cancer [8][10], head and neck squamous cell carcinoma [22][52], ovarian cancer [51][59], breast cancer [51][55][60], atypical fibroxanthoma [54], cervical cancer [56], vulvar cancer [57], and melanoma [58].
One hallmark of tumor cells is their potential to migrate and to grow invasively. Therefore, in our first experiment we compared the invasive potential of prostate cancer-derived PC3-cells transfected with control siRNA or with SEC62-specific siRNAs in the BD BioCoat Matrigel Tumor Invasion System [8][8]. Unspecific effects caused by siRNA were excluded by the use of two different SEC62 targeting siRNAs in individual experiments. Remarkably, invasion of the cells was reduced to 13% for the SEC62-siRNA treated and 3% for the SEC62-UTR siRNA-treated cells at a residual Sec62 protein level of about 8% to 12%, respectively. In a next step we tested whether this effect was due to a reduced viability, reduced proliferation or increased rate of necrosis. The viability of the transfected cells was only slightly reduced within the time range of the experiment, proliferation was reduced to 57% (SEC62 siRNA) or 75% (SEC62-UTR siRNA) and necrosis remained within the range that was observed for the control transfected cells. Next, we used the BD Falcon FluoroBlok Insert System without matrigel coating [8]. Under these experimental conditions, silencing of the SEC62 gene also led to a significant reduction of the migratory potential of PC3-cells compared to untreated PC3-cells or PC3-cells transfected with control siRNA while cell viability was hardly affected. Overall, a significant inhibition of cancer cell migration by SEC62 gene silencing was reported for prostate cancer cells [8], non-small cell lung cancer cells as well as thyroid carcinoma cells [10], cervical cancer cells [53], and head and neck squamous cell carcinoma cells [22]. Strikingly, SEC62 over-expression stimulated the migratory potential of otherwise poorly migrating cells such as HEK293, HeLa, Huh-7 and FaDu cells [8][13][22].
In summary, depletion of Sec62 from all so far tested SEC62 over-expressing tumor cell types by treatment with SEC62-targeting siRNAs led to reduced migratory as well as invasive potential. Furthermore, treatment of SEC62 over-expressing tumor cells, such as prostate- lung- and thyroid- cancer cell lines, with the small molecule and Calmodulin antagonist trifluoperazine (TFP) phenocopied the effect of SEC62-targeting siRNAs [13]. Therefore, murine tumor models for tumor growth or metastasis were evaluated with respect to their responsiveness to treatment with TFP. One first in vivo study reported a significant inhibition of seeding and growth of a subcutaneously injected head and neck squamous cell carcinoma cell line (FaDu) in BALB/cAnNRj-Foxn1nu/Foxn1nu mice by treatment with TFP [67]. A second in vivo study focusing on lymphatic metastases addressed if the migration inhibition, which was found for various cancer cells in vitro, manifests as a clinically relevant phenotype in a living organism and observed a tendency of the drug to suppress metastasis rate as well as to reduce metastasis size in an orthotopic xenograft mouse model of hypopharyngeal squamous cell carcinoma [68]. Since the Calmodulin antagonist TFP was in clinical use for the treatment of psychiatric illnesses for many years, there already exists extensive experience with a human application of this drug. Furthermore, the repurposing of this substance as a tumor therapeutic has already been developed by some groups in recent years and has been investigated with promising results [46].