Fluorescence polarization holds considerable promise for bioanalytical systems because it allows the detection of selective interactions in real time and a choice of fluorophores, the detection of which the biosample matrix does not influence; thus, their choice simplifies and accelerates the preparation of samples. For decades, these possibilities were successfully applied in fluorescence polarization immunoassays based on differences in the polarization of fluorophore emissions excited by plane-polarized light, whether in a free state or as part of an immune complex. However, the results of recent studies demonstrate the efficacy of fluorescence polarization as a detected signal in many bioanalytical methods.
- bioreceptors
- antibodies
- aptamers
- rapid assays
- fluorescence
- immunoassays
Note:All the information in this draft can be edited by authors. And the entry will be online only after authors edit and submit it.
1. Introduction
Currently, various analytical systems are being actively developed and widely used for the detection of various substances based on their ability to bind to selective receptor molecules (antibodies, aptamers, lectins, etc.) and to generate a detectable signal induced by this binding [1][2][3][4][1–4]. Such a signal can be a change in color, fluorescence, conductivity, or another property, induced by a label included in the detected complexes. In most cases, for effective detection of the label, analysis formats are implemented that include the separation of the detected complexes from unreacted labeled molecules or components of the tested sample that can affect the analytical signal. Attaining this separation requires using various carriers and multi-stage manipulations such as centrifugation, washing, which makes the analysis time consuming and laborious. In this regard, homogeneous non-separating bioanalytical test systems have undoubted advantages. However, distinguishing the bound and unbound labels in the sample medium is not always easy. This problem can be successfully solved by fluorescence immunoanalytical methods based on changes in fluorescence intensity, primarily from the effect of fluorescence resonance energy transfer or fluorescence polarization (FP) [5][6][5,6]. The mode based on the FP registration seems more efficient because it depends less on the individual properties of the interacting reagents.
The principle of fluorescence polarization immunoassay (FPIA) has been successfully applied to many analytical problems. Back in 1989, a review of FPIA developments listed 195 references [7]. The FPIA and imethodology has been successfully implemented in numerous commercial analytical systems. FPIA’s well-studied capabilities and limitations have made it a common method that occupies a strictly defined niche in a number of bioanalytical methods [5][8][5,8]. Zhang et al. [5] in a comprehensive review presented its detailed characterization as a means of detecting chemical contaminants in food and environmental analyses.
2. Conventional FPIA, Its Advantages and Drawbacks
FPIA was first proposed by Dandliker et al. [10]. Traditional FPIA is based on competitive binding of specific antibodies with the tested analyte and an analyte labeled with a fluorescent label (tracer). The reaction mixture is excited with polarized light, and the fluorescence emission is measured in the direction perpendicular to the excitation beam. Upon excitation with linearly polarized light, the tracer will fluoresce with depolarized light because, by the time of emission, the tracer molecules in the solution are oriented randomly. For the antibody–tracer complex, rotation slows down significantly, providing residual polarization of the emitted light (Figure 12). Therefore, the P value depends on the ratio of bound and free forms of the tracer and is determined by the concentration of the tested analyte.
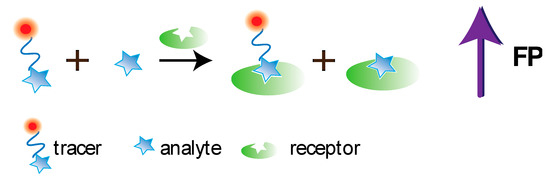
Figure 12. Principle of conventional FPIA.
The degree of FP change depends on the label, the average lifetime of the molecule in an excited state, the molecular weight of the analyte and the nature of the complex. Therefore, the choice of a fluorescent label is of key importance. It must have a high fluorescence intensity (i.e., high quantum yield and large extinction coefficient), be chemically and photostable under analytical conditions and easily conjugated to the analyte, and not interfere with the ligand–receptor interaction. For the endogenous fluorescent quenchers present in the sample not to interfere with the determination, their excitation and emission wavelengths must differ from the wavelengths of the fluorescent label. In addition, to reduce the effect of light scattering, the label must have a large Stokes shift [5]. When the temperature and viscosity of the solution are constant, the FP will depend only on the size of the fluorescent molecule. In the case of a competitive assay, the higher the receptor concentration, the higher the ligand concentration required to prevent the formation of the labeled ligand–receptor complex, which leads to a deterioration in the assay sensitivity [5]. Accordingly, to achieve maximum sensitivity, it is necessary to use the minimum amount of the receptor, which ensures reliable registration of the FP change during the transition of the labeled ligand into the complex with the receptor. The most commonly used fluorophore is fluorescein isothiocyanate (FITC). The inclusion of FITC-containing derivative of antigen into immune complexes leads to significant changes of FP as can be seen from Figure 23.
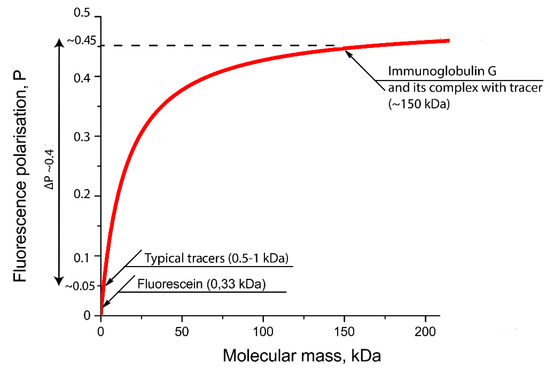
Figure 23. Dependence of the FP of the molecular weight of FITC-labeled preparations calculated on the basis of the Perrin equation (the formula and parameters for drawing are taken from [11]).
FPIA is a homogeneous analytical method that does not require separating the resulting compounds. It allows for determining the analyte concentration within a few minutes.
The method of FPIA is characterized by many advantages inherent in immunochemical methods: for example, versatility for determining low molecular weight substances (for many of which specific antibodies have already been obtained) or the ability to determine either single compounds or a group of compounds depending on the specificity of the antibodies used. Moreover, FPIA has the following unique features:
- It is a simple homogeneous method that requires no washing and separation steps.
- The analysis time is limited only by the pipetting because the kinetic constant of binding of small analyte molecules to antibodies in solution usually varies from 107 to 108 1/M s.
- The P value is a relative and dimensionless parameter that smooths fluctuations in instrument measurements and leads to very high reproducibility of results. The variation coefficients usually do not exceed 3–5%.
- Fluorescent labels can be synthesized quite easily and remain stable during storage for many years.
- However, the following features of conventional FPIA should be considered as its drawbacks.
- The assay typically needs in high concentration of reactants for reliable measurements of the FP; due to this FPIA is less sensitive as compared with other immunoanalytical techniques.
- Some compounds of the matrix can absorb excitation and emitted light, as well as exhibit their own fluorescence in the same spectral region as the used fluorophore; as a result, measurement results are distorted.
- The technique may be applied only to detect low molecular weight compounds, as well as it is based on significant difference of molecular weights for fluorophore-labeled antigen and its complex with antibody.
- It is a simple homogeneous method that requires no washing and separation steps.
- The analysis time is limited only by the pipetting because the kinetic constant of binding of small analyte molecules to antibodies in solution usually varies from 107 to 108 1/M s.
- The P value is a relative and dimensionless parameter that smooths fluctuations in instrument measurements and leads to very high reproducibility of results. The variation coefficients usually do not exceed 3–5%.
- Fluorescent labels can be synthesized quite easily and remain stable during storage for many years.
However, the following features of conventional FPIA should be considered as its drawbacks.
- The assay typically needs in high concentration of reactants for reliable measurements of the FP; due to this FPIA is less sensitive as compared with other immunoanalytical techniques.
- Some compounds of the matrix can absorb excitation and emitted light, as well as exhibit their own fluorescence in the same spectral region as the used fluorophore; as a result, measurement results are distorted.
- The technique may be applied only to detect low molecular weight compounds, as well as it is based on significant difference of molecular weights for fluorophore-labeled antigen and its complex with antibody.
3. Alternate Modes of FPIA
3.1. Single-Reagent FPIA
A specific mode of FPIA is so-called single-reagent FPIA, which uses a tracer–antibody complex. After adding such a reagent to the tested sample, the analyte displaces the tracer from the complex, which is detected as a FP decrease (Figure 34).
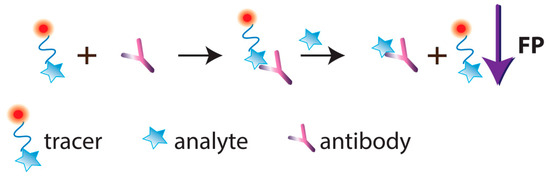
Figure 34. Schematic illustration of single-reagent FPIA.
The assay duration and the minimum detectable concentration for the single-reagent FPIA are less than those for the traditional method. The single-reagent method is extremely simplified, the immune complex is significantly more stable during storage, and the calibration curve can be used for quantitative determinations for several days without recalibration [5]. It has been shown that the immune complex can be stored at room temperature for several months. Moreover, the single-reagent FPIA provides a stable calibration curve that can be used over a long period. In this regard, for the determination of an analyte in one sample, there is no need to obtain a new calibration curve, as in other immunochemical methods.
However, the applicability of this approach is limited. Because the single-reagent FPIA is based on the tracer’s displacing from its complex with antibodies, analytical systems with high-affine antibodies cannot be transformed to the single-reagent FPIA. And even in the cases of antibodies having a high kinetic dissociation constant, a displacement of the tracer is a time-consuming step (about 10–30 min), which leads to a loss of the assay rapidity [12]. Therefore, single-reagent FPIA is acceptable, if the content of target analyte in tested sample is in the range of micrograms per milliliter.
Developments of the singe-reagent FPIA include Lippolis et al. on the simultaneous determination of several mycotoxins in wheat [13], Mi et al. on multiple determination of (fluoro)quinolone antibiotics in foodstuffs [14], and Eremin et al. on the high throughput determination of aromatic compounds [15].
3.2. FPIA in the Kinetic Mode
Another FPIA format is the analysis in the kinetic mode, when the FP is measured during the first seconds of the interaction and the background signal is absent. Because the kinetics of antigen-antibody interaction in solution is very fast, it can be recorded in the so-called stopped-flow FPIA mode.
A pioneering study in this field was the development of FPIA for 2,4-D and atrazine pesticides in milk and wine without sample preparation [16][17][16,17]. The approach used for 2,4-D determination consisted in registering the FP at the initial moment of the immune reaction upon injection of solutions from two syringes, respectively containing a mixture of solutions of the tracer and free analyte and antibodies’ solution. After an injection, the fluorescence intensity was measured at 484 and 520 nm excitation/emission wavelengths.
Sometimes the kinetic mode improves the FPIA sensitivity by an order of magnitude [18]. This effect can be interpreted as the result of measurements at the beginning of the antibody-tracer reaction. Therefore, the interferences from non-specific interactions with matrix compounds are minimized, and FP changes caused by low concentrations of the target analyte can be detected.
Recent studies include, in particular, Reiner et al. [19], who established a kinetic FP-based method for investigating binding kinetics of prominent inverse agonists of histamine. Here, monitoring of association rates of the H3 receptor with its several ligands (ciproxifan, clobenpropit, thioperamide and pitolisant) was carried out. It was demonstrated that the affinities for the ligands estimated in this real-time approach differ from affinities reported in displacement assays. Wolfe et al. [20] proposed a spectroscopic method that requires protein concentrations in the nanomolar range to study the interaction of detergents with membrane proteins. The developed approach is based on steady-state FP spectroscopy, which kinetically resolves detergents’ dissociation from membrane proteins and protein unfolding. A single-fluorophore approach using a microplate reader was developed that could obtain a fast and scalable readout of the protein-detergent interactions at nanomolar protein concentrations.
3.3. Non-Competitive FPIA
Several works are devoted to the development of non-competitive FPIA. Note that non-competitive format for detecting low molecular weight compounds is a great challenge because small molecules cannot significantly increase the volume and the rotation rate of a fluorophore-labelled receptor (Figure 45).
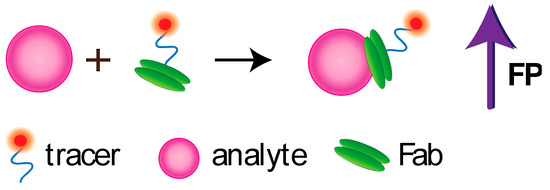
Figure 45. Noncompetitive FPIA using Fab fragment.
Fukuyama et al. [24][21] reported a single-step FPIA of human and rabbit immunoglobulins (IgG) in serum using the variable domain from a camelid VHH antibody. The test system was characterized by a large signal/background ratio in comparison with the previously reported methods using Fab fragments, and the sensitivity was 12-fold. The authors stated that this approach was applicable also to nanometer-sized biological targets, such as viruses and bacteria. Wang and Si proposed a direct non-competitive FP aptasensor that did not require florescent analogues for determining adenosine [25][22]. Adenosine, working as a molecular linker, reassembled the two pieces of single-stranded DNA into the intact aptamer tertiary structure, and then induced the increase of the FP signal. The LoD of adenosine was 26 nM; a wide dynamic range of over five orders of magnitude (50 nM to 1.0 mM) was achieved. Zhao et al. [26][23] used aptamer-based non-competitive FA analysis of OTA. A TMR-labeled aptamer demonstrated a FA reduction response upon binding with OTA; therefore, no FA signal enhancers were required. The developed test system showed a LoD of 3 nM and a dynamic range of 3–3000 nM and allowed for the measurement of OTA in urine and red wine. Geng et al. described a FA strategy that did not need a DNA aptamer or OTA labeling with fluorophores [27][24]. The fluorescence properties of OTA were considered in developing the test system. The interaction of OTA with the aptamer led to the deceleration of OTA rotation, thus enhancing the FA of OTA. Nishiyama et al. [28][25] reported the development of a non-competitive FPIA for C-reactive protein (CRP) using HiLyte Fluor™647 as a far-red emitting fluorescent dye to label CRP-specific antibody Fab fragment. The assay of human serum can be implemented in 10 min without sample preparation and has the cut-off value of 10 μg/mL.
References
- Lu, C.; Yang, H.; Zhu, C.; Chen, X.; Chen, G. A Graphene Platform for Sensing Biomolecules. Chem. 2009, 121, 4879–4881, doi:10.1002/ange.200901479.
- Farka, Z.; Juřík, T.; Kovář, D.; Trnková, L.; Skládal, P. Nanoparticle-Based Immunochemical Biosensors and Assays: Recent Advances and Challenges. Rev. 2017, 117, 9973–10042, doi:10.1021/acs.chemrev.7b00037.
- Tian, J.; Wang, Y.; Chen, S.; Jiang, Y.; Zhao, Y.; Zhao, S. Mass-amplifying quantum dots in a fluorescence polarization-based aptasensor for ATP. Acta 2012, 180, 203–209, doi:10.1007/s00604-012-0919-x.
- Tõntson, L.; Kopanchuk, S.; Rinken, A. Characterization of 5-HT1A receptors and their complexes with G-proteins in budded baculovirus particles using fluorescence anisotropy of Bodipy-FL-NAN-190. Int. 2014, 67, 32–38, doi:10.1016/j.neuint.2014.01.012.
- Zhang, H.; Yang, S.; De Ruyck, K.; Beloglazova, N.V.; Eremin, S.A.; De Saeger, S.; Zhang, S.; Shen, J.; Wang, Z. Fluorescence polarization assays for chemical contaminants in food and environmental analyses. TrAC Trends Anal. Chem. 2019, 114, 293–313, doi:10.1016/j.trac.2019.03.013.
- Kaur, A.; Dhakal, S. Recent applications of FRET-based multiplexed techniques. TrAC Trends Anal. Chem. 2020, 123, 115777, doi:10.1016/j.trac.2019.115777.
- Gutierrez, M.C.; Gomez-Hens, A.; Perez-Bendito, D. Immunoassay methods based on fluorescence polarization. Talanta 1989, 36, 1187–1201, doi:10.1016/0039-9140(89)80050-5.
- Chen, J.; Liu, J.; Chen, X.; Qiu, H. Recent progress in nanomaterial-enhanced fluorescence polarization/anisotropy sensors. Chem. Lett. 2019, 30, 1575–1580, doi:10.1016/j.cclet.2019.06.005.
- Lakowicz, J.R. Principles of Fluorescence Spectroscopy; Springer Science & Business Media: Berlin, Germany, 2013.
- Dandliker, W.; Kelly, R.; Dandliker, J.; Farquhar, J.; Levin, J. Fluorescence polarization immunoassay. Theory and experimental method. Immunochemistry 1973, 10, 219–227, doi:10.1016/0019-2791(73)90198-5.
- Samokhvalov, A.V.; Safenkova, I.V.; Eremin, S.A.; Zherdev, A.; Dzantiev, B. Use of anchor protein modules in fluorescence polarisation aptamer assay for ochratoxin A determination. Chim. Acta 2017, 962, 80–87, doi:10.1016/j.aca.2017.01.024.
- Choi, M.J.; Lee, J.R.; Eremin, S.A. Development of Single Reagent for Fluorescence Polarization Immunoassay of Atrazine. Food Agric. Immunol. 2010, 14, 107–120, doi:10.1080/09540100220145133.
- Lippolis, V.; Porricelli, A.C.R.; Mancini, E.; Ciasca, B.; Lattanzio, V.M.T.; De Girolamo, A.; Maragos, C.M.; McCormick, S.P.; Li, P.; Logrieco, A.F.; et al. Fluorescence Polarization Immunoassay for the Determination of T-2 and HT-2 Toxins and Their Glucosides in Wheat. Toxins 2019, 11, 380, doi:10.3390/toxins11070380.
- Mi, T.; Wang, Z.; Eremin, S.A.; Shen, J.; Zhang, S. Simultaneous Determination of Multiple (Fluoro)quinolone Antibiotics in Food Samples by a One-Step Fluorescence Polarization Immunoassay. Agric. Food Chem. 2013, 61, 9347–9355, doi:10.1021/jf403972r.
- Eremin, S.A.; Knopp, D.; Niessner, R.; Hong, J.Y.; Park, S.-J.; Choi, M.J. High Throughput Determination of BTEX by a One-Step Fluorescence Polarization Immunoassay. Chem. 2005, 2, 227–234, doi:10.1071/en04082.
- Eremin, S.A.; Matveeva, E.G.; Gómez-Hens, A.; Pérez-Bendito, D. Kinetic Determination of 2,4-Dichlorophenoxyacetic Acid by Stopped-Flow Fluorescence Polarization Immunoassay. J. Environ. Anal. Chem. 1998, 71, 137–146, doi:10.1080/03067319808032623.
- Sendra, B. Kinetic determination of atrazine in foods based on stopped-flow fluorescence polarization immunoassay. Talanta 1998, 47, 153–160, doi:10.1016/s0039-9140(98)00064-2.
- Eremin, S.; Smith, D. Fluorescence Polarization Immunoassays for Pesticides. Chem. High Throughput Screen. 2003, 6, 257–266, doi:10.2174/138620703106298301.
- Reiner, D.; Stark, H. Ligand binding kinetics at histamine H3 receptors by fluorescence-polarization with real-time monitoring. J. Pharmacol. 2019, 848, 112–120, doi:10.1016/j.ejphar.2019.01.041.
- Wolfe, A.J.; Hsueh, Y.-C.; Blanden, A.R.; Mohammad, M.M.; Pham, B.; Thakur, A.K.; Loh, S.N.; Chen, M.; Movileanu, L. Interrogating Detergent Desolvation of Nanopore-Forming Proteins by Fluorescence Polarization Spectroscopy. Chem. 2017, 89, 8013–8020, doi:10.1021/acs.analchem.7b01339.
- Fukuyama, M.; Nakamura, A.; Nishiyama, K.; Imai, A.; Tokeshi, M.; Shigemura, K.; Hibara, A. Noncompetitive Fluorescence Polarization Immunoassay for Protein Determination. Chem. 2020, 92, 14393–14397, doi:10.1021/acs.analchem.0c02300.
- Wang, S.-E.; Si, S. Direct fluorescence polarization aptamer-based assay for the determination of adenosine. Methods 2013, 5, 840, doi:10.1039/c2ay26305j.
- Zhao, Q.; Lv, Q.; Yin, J. Identification of Allosteric Nucleotide Sites of Tetramethylrhodamine-Labeled Aptamer for Noncompetitive Aptamer-Based Fluorescence Anisotropy Detection of a Small Molecule, Ochratoxin A. Chem. 2013, 86, 1238–1245, doi:10.1021/ac4035532.
- [1]
- [2]
References
- Lu, C.; Yang, H.; Zhu, C.; Chen, X.; Chen, G. A Graphene Platform for Sensing Biomolecules. Angew. Chem. 2009, 121, 4879–4881, doi:10.1002/ange.200901479.27
- Farka, Z.; Juřík, T.; Kovář, D.; Trnková, L.; Skládal, P. Nanoparticle-Based Immunochemical Biosensors and Assays: Recent Advances and Challenges. Chem. Rev. 2017, 117, 9973–10042, doi:10.1021/acs.chemrev.7b00037.28
- Tian, J.; Wang, Y.; Chen, S.; Jiang, Y.; Zhao, Y.; Zhao, S. Mass-amplifying quantum dots in a fluorescence polarization-based aptasensor for ATP. Microchim. Acta 2012, 180, 203–209, doi:10.1007/s00604-012-0919-x.
- Tõntson, L.; Kopanchuk, S.; Rinken, A. Characterization of 5-HT1A receptors and their complexes with G-proteins in budded baculovirus particles using fluorescence anisotropy of Bodipy-FL-NAN-190. Neurochem. Int. 2014, 67, 32–38, doi:10.1016/j.neuint.2014.01.012.
- Zhang, H.; Yang, S.; De Ruyck, K.; Beloglazova, N.V.; Eremin, S.A.; De Saeger, S.; Zhang, S.; Shen, J.; Wang, Z. Fluorescence polarization assays for chemical contaminants in food and environmental analyses. TrAC Trends Anal. Chem. 2019, 114, 293–313, doi:10.1016/j.trac.2019.03.013.
- Kaur, A.; Dhakal, S. Recent applications of FRET-based multiplexed techniques. TrAC Trends Anal. Chem. 2020, 123, 115777, doi:10.1016/j.trac.2019.115777.
- Gutierrez, M.C.; Gomez-Hens, A.; Perez-Bendito, D. Immunoassay methods based on fluorescence polarization. Talanta 1989, 36, 1187–1201, doi:10.1016/0039-9140(89)80050-5.
- Chen, J.; Liu, J.; Chen, X.; Qiu, H. Recent progress in nanomaterial-enhanced fluorescence polarization/anisotropy sensors. Chin. Chem. Lett. 2019, 30, 1575–1580, doi:10.1016/j.cclet.2019.06.005.
- Lakowicz, J.R. Principles of Fluorescence Spectroscopy; Springer Science & Business Media: Berlin, Germany, 2013.
- Dandliker, W.; Kelly, R.; Dandliker, J.; Farquhar, J.; Levin, J. Fluorescence polarization immunoassay. Theory and experimental method. Immunochemistry 1973, 10, 219–227, doi:10.1016/0019-2791(73)90198-5.
- Samokhvalov, A.V.; Safenkova, I.V.; Eremin, S.A.; Zherdev, A.; Dzantiev, B. Use of anchor protein modules in fluorescence polarisation aptamer assay for ochratoxin A determination. Anal. Chim. Acta 2017, 962, 80–87, doi:10.1016/j.aca.2017.01.024.
- Choi, M.J.; Lee, J.R.; Eremin, S.A. Development of Single Reagent for Fluorescence Polarization Immunoassay of Atrazine. Food Agric. Immunol. 2010, 14, 107–120, doi:10.1080/09540100220145133.
- Lippolis, V.; Porricelli, A.C.R.; Mancini, E.; Ciasca, B.; Lattanzio, V.M.T.; De Girolamo, A.; Maragos, C.M.; McCormick, S.P.; Li, P.; Logrieco, A.F.; et al. Fluorescence Polarization Immunoassay for the Determination of T-2 and HT-2 Toxins and Their Glucosides in Wheat. Toxins 2019, 11, 380, doi:10.3390/toxins11070380.
- Mi, T.; Wang, Z.; Eremin, S.A.; Shen, J.; Zhang, S. Simultaneous Determination of Multiple (Fluoro)quinolone Antibiotics in Food Samples by a One-Step Fluorescence Polarization Immunoassay. J. Agric. Food Chem. 2013, 61, 9347–9355, doi:10.1021/jf403972r.
- Eremin, S.A.; Knopp, D.; Niessner, R.; Hong, J.Y.; Park, S.-J.; Choi, M.J. High Throughput Determination of BTEX by a One-Step Fluorescence Polarization Immunoassay. Environ. Chem. 2005, 2, 227–234, doi:10.1071/en04082.
- Eremin, S.A.; Matveeva, E.G.; Gómez-Hens, A.; Pérez-Bendito, D. Kinetic Determination of 2,4-Dichlorophenoxyacetic Acid by Stopped-Flow Fluorescence Polarization Immunoassay. Int. J. Environ. Anal. Chem. 1998, 71, 137–146, doi:10.1080/03067319808032623.
- Sendra, B. Kinetic determination of atrazine in foods based on stopped-flow fluorescence polarization immunoassay. Talanta 1998, 47, 153–160, doi:10.1016/s0039-9140(98)00064-2.
- Eremin, S.; Smith, D. Fluorescence Polarization Immunoassays for Pesticides. Comb. Chem. High Throughput Screen. 2003, 6, 257–266, doi:10.2174/138620703106298301.
- Reiner, D.; Stark, H. Ligand binding kinetics at histamine H3 receptors by fluorescence-polarization with real-time monitoring. Eur. J. Pharmacol. 2019, 848, 112–120, doi:10.1016/j.ejphar.2019.01.041.
- Wolfe, A.J.; Hsueh, Y.-C.; Blanden, A.R.; Mohammad, M.M.; Pham, B.; Thakur, A.K.; Loh, S.N.; Chen, M.; Movileanu, L. Interrogating Detergent Desolvation of Nanopore-Forming Proteins by Fluorescence Polarization Spectroscopy. Anal. Chem. 2017, 89, 8013–8020, doi:10.1021/acs.analchem.7b01339.
- Yakovleva, J.; Lobanova, A.I.; Panchenko, O.A.; Eremin, S.A. Production of Antibodies and Development of Specific Polarization Fluoroimmunoassay for Acetochlor. Int. J. Environ. Anal. Chem. 2010, 82, 851–863, doi:10.1080/0306731021000102310.
- Shim, W.-B.; Kolosova, A.Y.; Kim, Y.-J.; Yang, Z.-Y.; Park, S.-J.; Eremin, S.A.; Lee, I.-S.; Chung, D.-H. Fluorescence polarization immunoassay based on a monoclonal antibody for the detection of ochratoxin A. Int. J. Food Sci. Technol. 2004, 39, 829–837, doi:10.1111/j.1365-2621.2004.00856.x.
- El-Hay, S.S.A.; Belal, F.F. Development of a micelle-enhanced high-throughput fluorometric method for determination of niclosamide using a microplate reader. Luminescence 2019, 34, 48–54, doi:10.1002/bio.3575.
- Fukuyama, M.; Nakamura, A.; Nishiyama, K.; Imai, A.; Tokeshi, M.; Shigemura, K.; Hibara, A. Noncompetitive Fluorescence Polarization Immunoassay for Protein Determination. Anal. Chem. 2020, 92, 14393–14397, doi:10.1021/acs.analchem.0c02300.
- Wang, S.-E.; Si, S. Direct fluorescence polarization aptamer-based assay for the determination of adenosine. Anal. Methods 2013, 5, 840, doi:10.1039/c2ay26305j.
- Zhao, Q.; Lv, Q.; Yin, J. Identification of Allosteric Nucleotide Sites of Tetramethylrhodamine-Labeled Aptamer for Noncompetitive Aptamer-Based Fluorescence Anisotropy Detection of a Small Molecule, Ochratoxin A. Anal. Chem. 2013, 86, 1238–1245, doi:10.1021/ac4035532.
- Geng, X.; Zhang, D.; Yin, J.; Zhao, Q. Screening interaction between ochratoxin A and aptamers by fluorescence anisotropy approach. Anal. Bioanal. Chem. 2013, 405, 2443–2449, doi:10.1007/s00216-013-6736-1.
- Nishiyama, K.; Fukuyama, M.; Maeki, M.; Ishida, A.; Tani, H.; Hibara, A.; Maeki, M. One-step non-competitive fluorescence polarization immunoassay based on a Fab fragment for C-reactive protein quantification. Sens. Actuators B Chem. 2021, 326, 128982, doi:10.1016/j.snb.2020.128982.