sST2 belongs to the interleukin-1 receptor family, it is believed that sST2 is a myocardial protein produced by myocardial cells under the action of biomechanical forces. After comparison, we noticed that in the acute stage of Kawasaki disease (KD) in children, the increase of ST2 was significantly associated with IVIG-R KD and multi-organ damage, and had more predictive value than PRO-NT BNP. The higher the ST2 is, the more severe the patient is.
- Kawasaki disease
- children
- sST2
- coronary artery damage
- myocardial damage
- multi-organ damage
1.The age and gender distribution of children with KD
1.The Age and Gender Distribution of Children with KD
Table 1. General information
General information.
|
|
groups |
age(year) |
male(%) |
Page |
Pgender |
|
MD
|
A(17) |
2.0(0.6~3.0) |
9(52.94) |
0.061
|
0.464
|
|
B(270) |
2.5(1.5~4.0) |
167(61.85) |
|||
|
CAL |
C(48) |
1.9(0.8~2.7) |
40(83.33) |
0.003
|
<0.001
|
|
D(239) |
2.5(1.5~4.0) |
136(56.90) |
|||
|
MOD
|
E(58) |
2.7(1.0~4.0) |
36(62.07) |
0.849
|
0.896
|
|
F(229) |
2.4(1.4~4.0) |
140(61.14) |
|||
|
IVIG-R KD
|
G(24) |
2.8(1.8~5.0) |
17(70.83) |
0.109
|
0.318
|
|
H(263) |
2.4(1.4~4.0) |
159(60.46) |
2.Comparison of sST2 levels among different groups
2. Comparison of sST2 Levels among Different Groups
Table 2
. Comparison of sST2 levels among different groups
|
|
groups |
sST2(ng/mL) |
Z |
P |
|
MD |
A(17) |
55.53(41.97~120.58) |
-3.150 |
0.002 |
|
B(270) |
38.28(27.25~57.60) |
|||
|
CAL |
C(48) |
42.82(32.24~71.78) |
-2.086 |
0.037 |
|
D(239) |
38.35(27.14~57.46) |
|||
|
MOD |
E(58) |
59.58(37.47~96.14) |
-5.380 |
<0.001 |
|
F(229) |
37.49(26.33~51.83) |
|||
|
IVIG-R KD |
G(24) |
65.67(43.96~183.66) |
-4.214 |
<0.001 |
|
H(263) |
37.73(27.29~55.62) |
3.
3.
Comparison of oOther iIndicators among dDifferent gGroups
The level of CRP、NT-pro BNP and D-dimer in group A、C、E, and G were respectively higher than those in groups B, D, F, and H (
P
<0.05).
Table 3. Comparison of other indicators among different groups
Comparison of other indicators among different groups.
|
|
PWBC |
PHB |
PPLT |
PCRP |
PIL-6 |
PESR |
PBNP |
PD-dimer |
PALB |
|
A vs B |
0.001 |
0.134 |
0.046 |
0.018 |
0.002 |
0.348 |
<0.001 |
0.003 |
0.072 |
|
C vs D |
0.37 |
0.001 |
0.011 |
0.039 |
0.076 |
0.933 |
0.037 |
0.005 |
0.032 |
|
E vs F |
0.002 |
<0.001 |
0.002 |
<0.001 |
<0.001 |
0.772 |
<0.001 |
<0.001 |
<0.001 |
|
G vs H |
0.032 |
<0.001 |
0.05 |
<0.001 |
0.001 |
0.288 |
0.009 |
0.002 |
<0.001 |
4.Correlation analysis between sST2 and other indicators
4. Correlation Analysis between sST2 and Other Indicators
The correlation coefficient r was calculated using Spearman correlation analysis. A correlation was considered weak when 0.3 ≤ |r| < 0.5. sST2 had a weak positive correlation with WBC, CRP, IL-6, NT-pro BNP, and D-dimer, and a weak negative correlation with HB and ALB. There was no correlation between sST2 and ESR or PLT.
Table 4. Correlation analysis between sST2 and other indexs
Correlation analysis between sST2 and other indexs.
|
|
Indexs |
r |
Sig. |
95% confidence interval (CI) |
|
|
lower limit |
upper limit |
||||
|
sST2 |
WBC |
0.301 |
<0.001 |
0.188 |
0.405 |
|
HB |
-0.333 |
<0.001 |
-0.434 |
-0.222 |
|
|
PLT |
0.196 |
<0.001 |
0.079 |
0.308 |
|
|
CRP |
0.412 |
<0.001 |
0.308 |
0.506 |
|
|
IL-6 |
0.456 |
<0.001 |
0.352 |
0.548 |
|
|
ESR |
0.105 |
0.08 |
-0.016 |
0.223 |
|
|
NT-pro BNP |
0.419 |
<0.001 |
0.315 |
0.514 |
|
|
D-dimer |
0.367 |
<0.001 |
0.258 |
0.467 |
|
|
ALB |
-0.403 |
<0.001 |
-0.499 |
-0.299 |
|
5.1 KD combined with MD
5. KD Combined with MD
According to the differences between Group A and Group B in Table 3, sST2, WBC, PLT, CRP, IL-6, D-dimer, and NT-proBNP were included as independent variables in the univariate binary Logistic regression analysis. The increases in sST2, WBC, and CRP were promoting factors for KD complicated with MD(P<0.05).
Table 5. Univariate logistic regression analysis of KD combined with MD
Univariate logistic regression analysis of KD combined with MD.
|
Influence factor
|
B |
SE |
Wald |
P |
OR |
95%CI |
|
|
lower limit |
upper limit |
||||||
|
sST2 |
0.011 |
0.004 |
7.043 |
0.008 |
1.011 |
1.003 |
1.020 |
|
WBC |
0.099 |
0.035 |
7.788 |
0.005 |
1.104 |
1.030 |
1.183 |
|
CRP |
0.012 |
0.004 |
10.034 |
0.002 |
1.012 |
1.004 |
1.019 |
Further perform the receiver operating characteristic (ROC) curve analysis. The areas under the curve (AUC) of sST2, WBC, CRP are 0.728, 0.738, and 0.686 respectively; The optimal cut-off value of sST2 for predicting MD is 44.247 ng/ml.
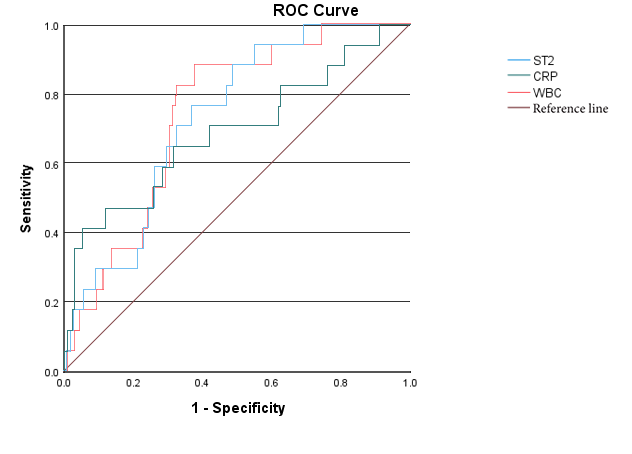
Figure 1. ROC curves of sST2, WBC, and CRP predicting KD combined with MD
ROC curves of sST2, WBC, and CRP predicting KD combined with MD.
56.2 KD cCombined with MOD
According to the differences between Group E and Group F in Table 3, sST2, WBC, HB, PLT, CRP, IL-6, NT-pro BNP, D-dimer, and ALB were included as independent variables in the univariate binary Logistic regression analysis. The results showed that the models constructed with sST2, WBC, HB, PLT, IL-6, and D-dimer were successful and had a good goodness of fit. These above independent variables were further included in the multivariate binary Logistic regression analysis, which showed that the increases in sST2 and IL-6 and the decrease in HB were independent risk factors for multiple organ involvement (P<0.05).
Table 6. Logistic regression analysis of KD combined with MOD
Logistic regression analysis of KD combined with MOD.
|
factor |
influence factor |
B |
SE |
Wald |
P |
OR |
95%CI |
|
|
lower limit |
upper limit |
|||||||
|
single
|
sST2 |
0.025 |
0.005 |
24.92 |
<0.001 |
1.025 |
1.015 |
1.035 |
|
WBC |
0.078 |
0.026 |
8.91 |
0.003 |
1.081 |
1.027 |
1.137 |
|
|
HB |
-0.085 |
0.016 |
28.99 |
<0.001 |
0.918 |
0.890 |
0.947 |
|
|
PLT |
0.002 |
0.001 |
7.97 |
0.005 |
1.002 |
1.001 |
1.004 |
|
|
IL-6 |
0.005 |
0.001 |
22.39 |
<0.001 |
1.005 |
1.003 |
1.008 |
|
|
D-dimer |
0.001 |
0.000 |
16.44 |
<0.001 |
1.001 |
1.001 |
1.002 |
|
|
multi |
sST2 |
0.013 |
0.005 |
6.01 |
0.014 |
1.013 |
1.003 |
1.024 |
|
HB |
-0.067 |
0.021 |
10.65 |
0.001 |
0.935 |
0.898 |
0.974 |
|
|
IL-6 |
0.003 |
0.001 |
5.79 |
0.016 |
1.003 |
1.001 |
1.006 |
|
|
WBC |
-0.021 |
0.040 |
0.28 |
0.600 |
0.979 |
0.905 |
1.059 |
|
|
PLT |
0.001 |
0.001 |
0.51 |
0.477 |
1.001 |
0.998 |
1.003 |
|
Further perform the receiver operating characteristic (ROC) curve analysis. The AUC of sST2, IL-6,HB are 0.735、0.728、0.756 respectively; The combined AUC of the three is 0.823. The optimal cut-off value of sST2 for predicting MOD is 51.264ng/ml.
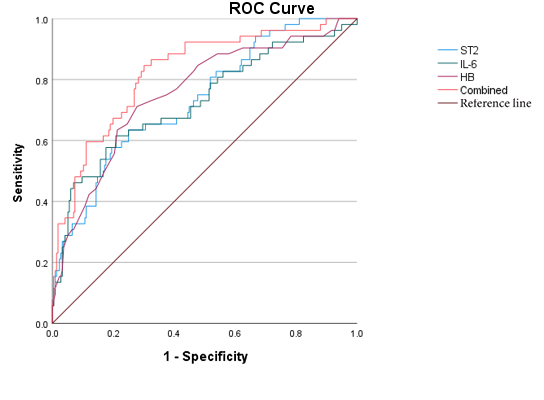
Figure 2. ROC curves of sST2, IL-6, HB, and the combined diagnosis for KD with MOD
ROC curves of sST2, IL-6, HB, and the combined diagnosis for KD with MOD.
5.3
7.
IVIG-R KD
Binary logistic regression analysis showed that sST2, HB, CRP, IL-6, ALB and IVIG-R KD models were successfully constructed with good fit; sST2 and HB were independent risk factors for IVIG-R KD (P<0.05).
Table 7. Logistic regression analysis of IVIG-R KD
Logistic regression analysis of IVIG-R KD.
|
factor |
influence factor
|
B |
SE |
Wald |
P |
OR |
95%CI |
|
|
lower limit |
upper limit |
|||||||
|
single
|
sST2 |
0.026 |
0.005 |
24.142 |
<0.001 |
1.025 |
1.016 |
1.037 |
|
HB |
-0.107 |
0.022 |
23.786 |
<0.001 |
0.899 |
0.861 |
0.938 |
|
|
CRP |
0.017 |
0.003 |
24.584 |
<0.001 |
1.017 |
1.010 |
1.024 |
|
|
IL-6 |
0.003 |
0.001 |
6.239 |
0.013 |
1.003 |
1.001 |
1.005 |
|
|
ALB |
-0.243 |
0.069 |
12.369 |
<0.001 |
0.785 |
0.685 |
0.898 |
|
|
multi |
sST2 |
0.017 |
0.006 |
7.987 |
0.005 |
1.017 |
1.005 |
1.029 |
|
HB |
-0.062 |
0.027 |
5.354 |
0.021 |
0.940 |
0.892 |
0.991 |
|
|
CRP |
0.006 |
0.005 |
1.143 |
0.285 |
1.006 |
0.995 |
1.016 |
|
|
IL-6 |
0.000 |
0.001 |
0.416 |
0.519 |
1.000 |
0.999 |
1.002 |
|
|
ALB |
0.059 |
0.086 |
0.477 |
0.490 |
1.061 |
0.897 |
1.256 |
|
Further perform the receiver operating characteristic (ROC) curve analysis. The AUC of sST2, HB are 0.760、0.783 respectively; The combined AUC of them is 0.835. sST2 increases earlier than HB decreases. The optimal cut-off value of sST2 for predicting IVIG-R KD is 43.412ng/ml.
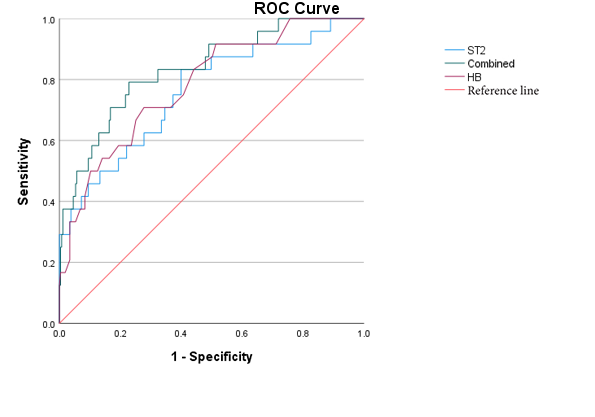
Figure 3. ROC curves of sST2, HB, and the combined prediction of IVIG-R KD
ROC curves of sST2, HB, and the combined prediction of IVIG-R KD.
58.3 Clinical dData of four cFour Cases with ST2>200ng/ml
Table 8. Clinical data of four cases with ST2>200
Clinical data of four cases with ST2>200.
|
Case |
Gender |
Age |
ST2 (ng/ml) |
Fever
|
Treatment
|
MOD |
|
1# 19kg |
F |
3.5y |
>200 |
Admission 7d Regressive10d |
IVIG 4g/kg Dex5mg* 2d Methyl methicone: 2mg/kg*7d 1.5mg/kg*7d 1mg/kg*1d Prednisone Po 14d ALB IV 40g |
Cardiogenic shock, Acute heart failure, Hypoproteinemia(27.1g/L), Hypokalemia, hyponatremia, Pneumonia, Aseptic encephalitis (EEG 2-3Hz), Localized peritonitis, Thrombocytopenia |
|
2# 13.5 kg 102 cm |
M |
3y |
>200 |
Admission 9d Regressive20d |
IVIG 2g/kg Methyl methicone: 20mg/kg*3d 2mg/kg*3d 1mg/kg*1d Prednisone Po 7d ALB IV 10g |
CAA: LM4.7mm,Z=6.07, 3m recvered Liver damage(ALT95U/L) Hypoproteinemia(24g/L) Leukemoid reaction Aseptic encephalitis (EEG 5-7Hz) Pneumonia, |
|
3# 9.3kg 82cm |
M |
23m |
285.4 |
Admission 5d Regressive27d |
IVIG 4g/kg Methyl methicone 20mg/kg*3d 10mg/kg*3d 2mg/kg*4d 1mg/kg*10d Prednisone Po 10d TNF inhibitor 5mg/kg ALBI V 70g |
CAA: LM5.6mm(Z=11.1) RCA6.5mm(Z=12) Liver damage (ALT 434U/L) Hypoproteinemia (24.2g/L) Aseptic encephalitis (CSF:WBC66, Pro 0.56) Pleural effusion Moderate anemia(HGB=76g/L) |
|
4# 29kg 130cm |
F |
9y |
287.2 |
Admission 6d Regressive22d |
IVIG 3g/kg Methyl methicone: 2mg/kg*6d 1mg/kg*7d 0.7md/kg*3d Prednison Po 10d ALBIV 60g CTX 2mg/kg IV |
CAA: LAD 6.9mm(Z= 7.63) persist RCA7.7mm(Z=10.63) persist Hypoproteinemia(20.6g/L) Aseptic encephalitis (EEG 4-7Hz) Knee joint effusion Granulocytopenia Hyponatremia, Moderate anemia(HGB=86g/L) |
discuss
9. Discussion
When the physiological state of sST2 concentration is low, it can inhibit myocardial cell hypertrophy and cardiac fibrosis, thereby exerting a cardio protective effect [8][1].
Compared with NT-Pro BNP, the concentration of sST2 is not affected by renal function [9][2].
The mechanism may be that the IL-33/sST2 signaling pathway is involved in the pathophysiological processes of various inflammatory diseases and is related to inflammation and immune tolerance [11][3].
The more severe the condition, the higher the serum sST2 levels of patients [12][4].
The IL-33/sST2 axis may be a target for KD therapy[17].
References
[8] Kotsiou OS, Gourgoulianis KI, Zarogiannis SG. IL-33/sST2 Axis in Organ Fibrosis. Front Immunol. 2018 Oct 24;9:2432. doi: 10.3389/fimmu.2018.02432. PMID: 30405626; PMCID: PMC6207585.
[9] van Vark LC, Lesman-Leegte I, Baart SJ, et al. Prognostic Value of Serial sST2 Measurements in Patients With Acute Heart Failure. J Am Coll Cardiol. 2017 Nov 7;70(19):2378-2388. doi: 10.1016/j.jacc.2017.09.026.
[11] Homsak E, Gruson D. Soluble sST2: A complex and diverse role in several diseases. Clin Chim Acta. 2020 Aug;507:75-87. doi: 10.1016/j.cca.2020.04.011.
[12] Pastille E, Wasmer MH, Adamczyk A, Vu VP, Mager LF, Phuong NNT, Palmieri V, Simillion C, Hansen W, Kasper S, Schuler M, Muggli B, McCoy KD, Buer J, Zlobec I, Westendorf AM, Krebs P. The IL-33/sST2 pathway shapes the regulatory T cell phenotype to promote intestinal cancer. Mucosal Immunol. 2019 Jul;12(4):990-1003. doi: 10.1038/s41385-019-0176-y.
[17] Okada S, Yasudo H, Ohnishi Y, et al. Interleukin-33/sST2 Axis as Potential Biomarker and Therapeutic Target in Kawasaki Disease. Inflammation. 2022 Oct 8. doi: 10.1007/s10753-022- 01753-7. Epub ahead of print. PMID: 36208354.
[5].
References
- Kotsiou OS, Gourgoulianis KI, Zarogiannis SG. IL-33/sST2 Axis in Organ Fibrosis. Front Immunol. 2018 Oct 24;9:2432. doi: 10.3389/fimmu.2018.02432. PMID: 30405626; PMCID: PMC6207585.
- van Vark LC, Lesman-Leegte I, Baart SJ, et al. Prognostic Value of Serial sST2 Measurements in Patients With Acute Heart Failure. J Am Coll Cardiol. 2017 Nov 7;70(19):2378-2388. doi: 10.1016/j.jacc.2017.09.026.
- Homsak E, Gruson D. Soluble sST2: A complex and diverse role in several diseases. Clin Chim Acta. 2020 Aug;507:75-87. doi: 10.1016/j.cca.2020.04.011.
- Pastille E, Wasmer MH, Adamczyk A, Vu VP, Mager LF, Phuong NNT, Palmieri V, Simillion C, Hansen W, Kasper S, Schuler M, Muggli B, McCoy KD, Buer J, Zlobec I, Westendorf AM, Krebs P. The IL-33/sST2 pathway shapes the regulatory T cell phenotype to promote intestinal cancer. Mucosal Immunol. 2019 Jul;12(4):990-1003. doi: 10.1038/s41385-019-0176-y.
- Okada S, Yasudo H, Ohnishi Y, et al. Interleukin-33/sST2 Axis as Potential Biomarker and Therapeutic Target in Kawasaki Disease. Inflammation. 2022 Oct 8. doi: 10.1007/s10753-022- 01753-7. Epub ahead of print. PMID: 36208354.