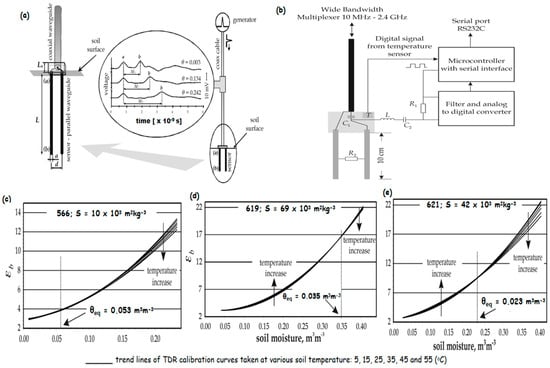
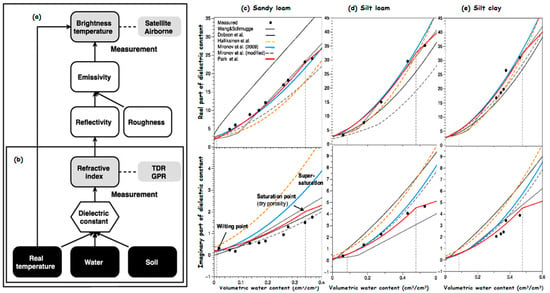
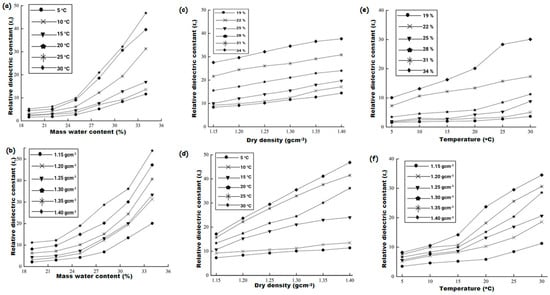
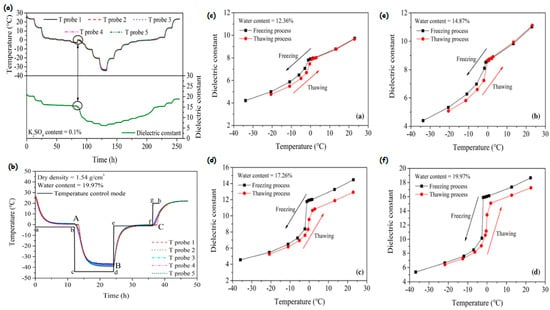
Dielectric properties are crucial in understanding the behavior of water within soil, particularly the soil water content (SWC), as they measure a material’s ability to store an electric charge and are influenced by water and other minerals in the soil. However, a comprehensive review paper is needed that synthesizes the latest developments in this field, identifies the key challenges and limitations, and outlines future research directions. In addition, various factors, such as soil salinity, temperature, texture, probing space, installation gap, density, clay content, sampling volume, and environmental factors, influence the measurement of the dielectric permittivity of the soil. Therefore, this review aims to address the research gap by critically analyzing the current state-of-the-art dielectric properties-based methods for SWC measurements. The motivation for this review is the increasing importance of precise SWC data for various applications such as agriculture, environmental monitoring, and hydrological studies. We examine time domain reflectometry (TDR), frequency domain reflectometry (FDR), ground-penetrating radar (GPR), remote sensing (RS), and capacitance, which are accurate and cost-effective, enabling real-time water resource management and soil health understanding through measuring the travel time of electromagnetic waves in soil and the reflection coefficient of these waves. SWC can be estimated using various approaches, such as TDR, FDR, GPR, and microwave-based techniques. These methods are made possible by increasing the dielectric permittivity and loss factor with SWC. The available dielectric properties are further synthesized based on mathematical models relating apparent permittivity to water content, providing an updated understanding of their development, applications, and monitoring. It also analyzes recent mathematical calibration models, applications, algorithms, challenges, and trends in dielectric permittivity methods for estimating SWC. By consolidating recent advances and highlighting the remaining challenges, this review article aims to guide researchers and practitioners toward more effective strategies for SWC measurement
- dielectric properties
- soil water content (SWC)
- electromagnetic energy
- soil properties
- capacitance
- remote sensors
1. Introduction
| No | Soil Type | Texture (in Percent) | Wilting Point (cm3/cm3) |
||
|---|---|---|---|---|---|
| No | Soil Sample (pH) |
ɛr fr = 1.88 GHz |
ɛr fr = 2.45 GHz | Transition Water Content (cm3/cm3) |
Real Part of the Complex Dielectric Permittivity | Imaginary Part of Dielectric Permittivity | ||
|---|---|---|---|---|---|---|---|---|
| ɛ | r | fr = 5.35 GHz | Sand | Silt | Clay | |||
| 1 | Harlingen clay | 2.0 | 37.0 | 61.0 | 0.358 | 0.31 | 0.30 | 0 |
| 2 | Yuma sand | 100.0 | 0 | 0 | 0.004 | 0.17 | 0.50 | 0 |
| 3 | Eufaula fine sand | 90.0 | 7.0 | 3.0 | 0.024 | 0.16 | 0.50 | 0 |
| 4 | Dougherty fine sand | 82.0 | 14.0 | 4.0 | 0.34 | 0.17 | 0.50 | 0 |
| 5 | Minco very fine sand | 70.0 | 22.0 | 8.0 | 0.051 | 0.17 | 0.50 | 0 |
| 6 | Chinkasha loam | 58.0 | 28.0 | 14.0 | 0.098 | 0.22 | 0.40 | 8 |
| 7 | Open street silt | 22.0 | 70.0 | 8.0 | 0.092 | 0.23 | 0.50 | 8 |
3. Remote Sensing Based on Dielectric Properties of Soil Moisture
4. Applications of Dielectric Models in Soil Water Content Measurements

| Experiment | Objectives/Aim | Findings | References | ||||||||
|---|---|---|---|---|---|---|---|---|---|---|---|
| Soil’s specific features and calibration | Focused on the FDR sensors on their factory calibration |
|
[9] | ||||||||
| Calibration procedure for electromagnetic SWC sensors | To demonstrate the recent and effective calibration methods for low-cost EM sensors |
|
[53] | ||||||||
| Laterite’s dielectric characteristics and constant model | To examine the mechanical and physical aspects of in situ laterite dielectric properties |
|
[47] | ||||||||
| Measurement and modelling of the dielectric permittivity of soil | To suggest, locate, and demonstrate fresh approaches to determining the dielectric permittivity during freezing |
|
[38] | ||||||||
| Dielectric analysis models for measurement of SWC | To presents a normalization-based calibration model. |
|
[19] | ||||||||
| Saturated prediction model using TDR | To suggest the level of soil’s saturation with different control criterion for compaction quality |
|
[90] | ||||||||
| Calibration of the dielectric permittivity model for agricultural soils | To investigates using three pre-established dielectric permittivity models |
|
8 | Zanies loam | 48.0 | 36.0 | 16.0 | 0.114 | 0.22 | 0.40 | 8 |
| 9 | Collinville loam | 45.0 | 39.0 | 16.0 | 0.115 | 0.23 | 0.40 | 8 | |||
| 10 | Kirkland silt loam | 26.0 | 56.0 | 18.0 | 0.137 | 0.20 | 0.40 | 8 | |||
| 11 | Vernon clay loam | 16.0 | 56.0 | 22.0 | 0.192 | 0.28 | 0.45 | 26 | |||
| 12 | Tabler silt loam | 22.0 | 56.0 | 22.0 | 0.159 | 0.19 | 0.40 | 8 | |||
| 13 | Long lake clay | 6.0 | 54.0 | 40.0 | 0.255 | 0.26 | 0.40 | 26 | |||
| 14 | Sand | 86.0 | 7.0 | 7.0 | 0.046 | 0.20 | 0.40 | 0 | |||
| 15 | Miller clay | 3.0 | 35.0 | 62.0 | 0.361 | 0.33 | 0.30 | 20 |
| 1 | 4.7 | 3.99 | 3.90 | 3.84 |
| 2 | 4.9 | 3.62 | 3.43 | 3.32 |
| 3 | 5.0 | 3.79 | 3.53 | 3.27 |
| 4 | 5.2 | 3.83 | 3.75 | 3.52 |
| 5 | 5.8 | 3.45 | 3.76 | 3.68 |
| 6 | 6.1 | 3.64 | 3.47 | 3.14 |
| 7 | 6.3 | 3.48 | 3.55 | 3.21 |
| 8 | 7.0 | 3.32 | 3.72 | 3.56 |
| 9 | 7.4 | 3.78 | 3.80 | 3.30 |
2. Dielectric Models for Soil Water Content Measurements
| |||
| [ | |||
| 43 | |||
| ] | |||
| Dielectric models for estimating SWC | Examining the link between soil dielectric permittivity, volumetric water content, and dielectric permittivity |
|
[10] |
| Mixing models describing dielectric dispersion | To study the dielectric response in the frequency domain of clay minerals and clayey soils |
|
[91] |
| Modeling and measurement of soil dielectric properties | To investigate the dielectric properties at room temperature |
|
[40] |
| Dielectric damping and configuration effects on TDR | To investigate the impacts of phase configuration and bound water in four high-surface-area soils |
|
[92] |
| Evaluation of the thermal conductivity model | Classification into physical, mixing, normalized, linear, and non-linear regression |
|
[93] |
| Application of TDR in porous media | To study TDR applications and analyzing waveforms for electrical conductivity and permittivity |
|
[94] |
| Using TDR probes, field observations of topsoil moisture | To assesses the effectiveness of a novel inverse method to predict water content profiles |
|
[95] |
| Logarithmic TDR calibration formulas: a physical interpretation | To give an empirical estimate of the solid percentage permittivity in volcanic soils |
|
[96] |
| TDR field calibration for determining SWC | Examining the dielectric permittivity and gravimetric water content in damaged peatlands |
|
[97] |
| Temperature-dependent measurement error in TDR determinations of SWC | To compared soil temperature fluctuations in Ka measurement errors with those estimated using a dielectric mixing model |
|
[98] |
| Calculating effective approaches for the dielectric permittivity of moist soil | To calculate the effective dielectric permittivity of multiphase soil |
|
[57] |
| SWC estimation | To determine the precise dielectric permittivity by calibrating the wave velocity |
|
[99] |
| A novel soil water sensor that adjusts soil temperature and water content | To adjust and monitor SWC reflectometers for various soil types |
|
[36] |
| Soil water remote sensing | To enhance retrieval algorithms and transfer empirical observation at different resolutions |
|
[79] |
| Dielectric study to quantify the water content of soil | To examine SWC using a new dielectric analysis model |
|
[100] |
| Effective field calibration method and model for determining liquid water content | To calculate the amount of uncertainty in the liquid water content |
|
[101] |
| Soil water measurement by dielectric method | To investigate the dielectric method of measuring SWC and identify sensor values that are differentially influenced by complex dielectric permeability |
|
[15] |
| Measurement of SWC with dielectric dispersion frequency | To investigate the possibility of measuring variations in theta using the soil dielectric spectrum |
|
[102] |
| Soil water content retrieval from multispectral remote sensing | To measure SWC with machine learning algorithms and remote sensing |
|
[81] |
| Dielectric properties calibration, methods and devices for measuring soil water content | To investigate talc, glass beads, and their combinations at various levels of salinity and water content. |
|
[70] |
| Distributed fiber-optic sensing for long-range Monitoring |
DiTeSt is a laser-based distributed sensing system that utilizes optical scattering within the sensing fiber. |
|
[103] |
| Detecting SWC with GPR | Evaluation of the latest advancements in GPR applications in SWC measurement |
|
[8] |
| GPR outside the ground for soil water content determination | To examine the connection between SWC and surface characteristics. |
|
[81] |
| SWC estimation from remote sensing | To examine recent developments and applications related to SWC estimate from remote sensing |
|
[104] |
| Temperature and electrical conductivity effects on an inexpensive SWC | To use a two-sensor array to measure the electrical conductivity sensor used in agricultural fields |
|
[105] |
| Soil water retention curves from water content measurements | To develop a new method to estimate soil water retention curves. |
|
[6] |
| TDR to quantify the SWC and bulk density | Implementation and testing of a novel software for TDR-waveform analysis to measures SWC |
|
[25] |
| Monopole antenna-based spectroscopy technique for measuring SWC | To suggest a new approach to measuring soil water that uses frequency scanning |
|
[4] |
| Determining SWC and bulk density | To determine the TDR calibration slope and effects of electromagnetic waveform on soil salinity |
|
[106] |
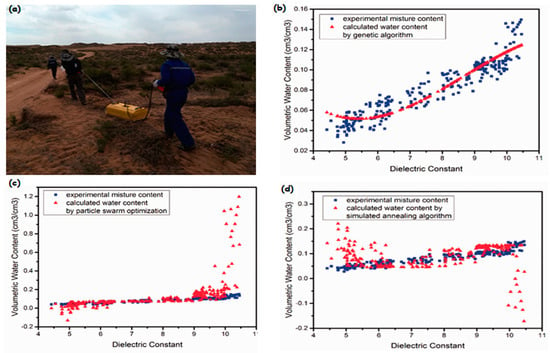
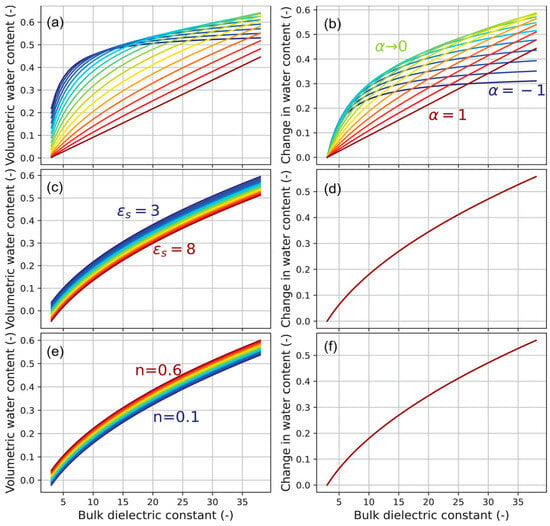


5. Challenges, Prospects, and Trends in Using Dielectric Properties to Measure SWC
5.1. Challenges
5.2. Prospective and Future Trends
6. Conclusions
References
- Algeo, J.; Van Dam, R.L.; Slater, L. Early-Time GPR: A Method to Monitor Spatial Variations in Soil Water Content during Irrigation in Clay Soils. Vadose Zone J. 2016, 15, 1–9.
- Benedetto, A.; Tosti, F.; Ortuani, B.; Giudici, M.; Mele, M. Mapping the spatial variation of soil moisture at the large scale using GPR for pavement applications. Near Surf. Geophys. 2015, 13, 269–278.
- Wan, H.; Qi, H.; Shang, S. Estimating soil water and salt contents from field measurements with time domain reflectometry using machine learning algorithms. Agric. Water Manag. 2023, 285, 108364.
- Li, M.; Jwo, K.-W.; Yi, W. A novel spectroscopy-based method using monopole antenna for measuring soil water content. Measurement 2021, 168, 108459.
- Bao, J.; Hou, Z.; Ray, J.; Huang, M.; Swiler, L.; Ren, H. Soil moisture estimation using tomographic ground penetrating radar in a MCMC–Bayesian framework. Stoch. Environ. Res. Risk Assess. 2018, 32, 2213–2231.
- Fu, Z.; Zhang, X.; Zhang, H.; Li, Y.; Zhou, H.; Zhang, Y. On the Understandings of Dielectric Constant and Its Impacts on the Photovoltaic Efficiency in Organic Solar Cells. Chin. J. Chem. 2021, 39, 381–390.
- Farhat, I.; Farrugia, L.; Bonello, J.; Sammut, C.; Persico, R. Measuring the Dielectric Properties of Soil: A Review and Some Innovative Proposals. In Instrumentation and Measurement Technologies for Water Cycle Management; Di Mauro, A., Scozzari, A., Soldovieri, F., Eds.; Springer International Publishing: Cham, Switzerland, 2022; pp. 485–509.
- Klotzsche, A.; Jonard, F.; Looms, M.C.; van der Kruk, J.; Huisman, J.A. Measuring Soil Water Content with Ground Penetrating Radar: A Decade of Progress. Vadose Zone J. 2018, 17, 180052.
- Zawilski, B.M.; Granouillac, F.; Claverie, N.; Lemaire, B.; Brut, A.; Tallec, T. Calculation of soil water content using dielectric-permittivity-based sensors—Benefits of soil-specific calibration. Geosci. Instrum. Method. Data Syst. 2023, 12, 45–56.
- Szypłowska, A.; Lewandowski, A.; Yagihara, S.; Saito, H.; Furuhata, K.; Szerement, J.; Kafarski, M.; Wilczek, A.; Majcher, J.; Woszczyk, A.; et al. Dielectric models for moisture determination of soils with variable organic matter content. Geoderma 2021, 401, 115288.
- He, H.; Zou, W.; Jones, S.B.; Robinson, D.A.; Horton, R.; Dyck, M.; Filipović, V.; Noborio, K.; Bristow, K.; Gong, Y.; et al. Critical review of the models used to determine soil water content using TDR-measured apparent permittivity. In Advances in Agronomy; Sparks, D.L., Ed.; Academic Press: Cambridge, MA, USA, 2023; Volume 182, pp. 169–219.
- Liu, J.; He, T.; Yang, Z.; Peng, S.; Zhu, Y.; Li, H.; Lu, D.; Li, Q.; Feng, Y.; Chen, K.; et al. Insight into the mechanism of nano-TiO2-doped biochar in mitigating cadmium mobility in soil-pak choi system. Sci. Total Environ. 2024, 916, 169996.
- Quan, C.; Jiuli, L.; Zhihua, T.; Jiangyuan, Z.; Yan, L. Study on the relationship between soil moisture and its dielectric constant obtained by space-borne microwave radiometers and scatterometers. IOP Conf. Ser. Earth Environ. Sci. 2014, 17, 012143.
- Zhou, G.; Su, S.; Xu, J.; Tian, Z.; Cao, Q. Bathymetry Retrieval From Spaceborne Multispectral Subsurface Reflectance. IEEE J. Sel. Top. Appl. Earth Obs. Remote Sens. 2023, 16, 2547–2558.
- Bobrov, P.P.; Belyaeva, T.A.; Kroshka, E.S.; Rodionova, O.V. Soil Moisture Measurement by the Dielectric Method. Eurasian Soil Sci. 2019, 52, 822–833.
- Nielsen, C.K.; Thomsen, A.G. Local Calibration of TDR Measurements for Determining Water and Organic Carbon Contents of Peaty Soils. Soil Syst. 2023, 7, 10.
- Abdulraheem, M.I.; Zhang, W.; Li, S.; Moshayedi, A.J.; Farooque, A.A.; Hu, J. Advancement of Remote Sensing for Soil Measurements and Applications: A Comprehensive Review. Sustainability 2023, 15, 15444.
- Quemada, C.; Pérez-Escudero, J.M.; Gonzalo, R.; Ederra, I.; Santesteban, L.G.; Torres, N.; Iriarte, J.C. Remote Sensing for Plant Water Content Monitoring: A Review. Remote Sens. 2021, 13, 2088.
- Mukhlisin, M.; Saputra, A. Dielectric Analysis Model for Measurement of Soil Moisture Water Content Using Electrical Capacitance Volume Tomography. In Modern Applications of Electrostatics and Dielectrics; Dengming, X., Krishnaswamy, S., Eds.; IntechOpen: Rijeka, Croatia, 2019.
- Rehman, F.; Abouelnaga, H.S.O.; Rehman, F. Estimation of dielectric permittivity, water content, and porosity for environmental engineering and hydrogeological studies using ground penetrating radar, a short review. Arab. J. Geosci. 2016, 9, 312.
- Zhu, G.; Yong, L.; Zhao, X.; Liu, Y.; Zhang, Z.; Xu, Y.; Sun, Z.; Sang, L.; Wang, L. Evaporation, infiltration and storage of soil water in different vegetation zones in the Qilian Mountains: A stable isotope perspective. Hydrol. Earth Syst. Sci. 2022, 26, 3771–3784.
- Dai, H.; Ju, J.; Gui, D.; Zhu, Y.; Ye, M.; Liu, Y.; Cui, J.; Hu, B.X. A two-step Bayesian network-based process sensitivity analysis for complex nitrogen reactive transport modeling. J. Hydrol. 2024, 632, 130903.
- Zhou, L.; Yu, D.; Wang, Z.; Wang, X. Soil Water Content Estimation Using High-Frequency Ground Penetrating Radar. Water 2019, 11, 1036.
- Anbazhagan, P.; Bittelli, M.; Pallepati, R.R.; Mahajan, P. Comparison of soil water content estimation equations using ground penetrating radar. J. Hydrol. 2020, 588, 125039.
- Bittelli, M.; Tomei, F.; Anbazhagan, P.; Pallapati, R.R.; Mahajan, P.; Meisina, C.; Bordoni, M.; Valentino, R. Measurement of soil bulk density and water content with time domain reflectometry: Algorithm implementation and method analysis. J. Hydrol. 2021, 598, 126389.
- Shan, G.; Sun, Y.; Zhou, H.; Schulze Lammers, P.; Grantz, D.A.; Xue, X.; Wang, Z. A horizontal mobile dielectric sensor to assess dynamic soil water content and flows: Direct measurements under drip irrigation compared with HYDRUS-2D model simulation. Biosyst. Eng. 2019, 179, 13–21.
- Piuzzi, E.; Cannazza, G.; Cataldo, A.; De Benedetto, E.; De Giorgi, L.; Frezza, F.; Leucci, G.; Pisa, S.; Pittella, E.; Prontera, S.; et al. A comparative assessment of microwave-based methods for moisture content characterization in stone materials. Measurement 2018, 114, 493–500.
- Huang, J.; Ma, H.; Sedano, F.; Lewis, P.; Liang, S.; Wu, Q.; Su, W.; Zhang, X.; Zhu, D. Evaluation of regional estimates of winter wheat yield by assimilating three remotely sensed reflectance datasets into the coupled WOFOST–PROSAIL model. Eur. J. Agron. 2019, 102, 1–13.
- Mane, S.; Das, N.; Singh, G.; Cosh, M.; Dong, Y. Advancements in dielectric soil moisture sensor Calibration: A comprehensive review of methods and techniques. Comput. Electron. Agric. 2024, 218C, 108686.
- Jiao, Y.; Zhu, G.; Meng, G.; Lu, S.; Qiu, D.; Lin, X.; Li, R.; Wang, Q.; Chen, L.; Zhao, L.; et al. Estimating non-productive water loss in irrigated farmland in arid oasis regions: Based on stable isotope data. Agric. Water Manag. 2023, 289, 108515.
- Bai, B.; Xu, T.; Nie, Q.; Li, P. Temperature-driven migration of heavy metal Pb2+ along with moisture movement in unsaturated soils. Int. J. Heat Mass Transf. 2020, 153, 119573.
- Mohan, R.R.; Paul, B.; Mridula, S.; Mohanan, P. Measurement of Soil Moisture Content at Microwave Frequencies. Procedia Comput. Sci. 2015, 46, 1238–1245.
- Kelleners, T.J.; Verma, A.K. Measured and Modeled Dielectric Properties of Soils at 50 Megahertz. Soil Sci. Soc. Am. J. 2010, 74, 744–752.
- Mo, H.; Wang, G.; Liu, F.; Jiang, P. The influence of the interface between mica and epoxy matrix on properties of epoxy-based dielectric materials with high thermal conductivity and low dielectric loss. Rsc Adv. 2016, 6, 83163–83174.
- Guan, Y.; Lu, H.; Yin, C.; Xue, Y.; Jiang, Y.; Kang, Y.; He, L.; Heiskanen, J. Vegetation response to climate zone dynamics and its impacts on surface soil water content and albedo in China. Sci. Total Environ. 2020, 747, 141537.
- Tan, X.; Wu, J.; Huang, J.; Wu, M.; Zeng, W. Design of a new TDR probe to measure water content and electrical conductivity in highly saline soils. J. Soils Sediments 2018, 18, 1087–1099.
- Kargas, G.; Soulis, K.X. Performance evaluation of a recently developed soil water content, dielectric permittivity, and bulk electrical conductivity electromagnetic sensor. Agric. Water Manag. 2019, 213, 568–579.
- Xu, X.; Zhang, W.; Wang, Y. Measuring and modeling the dielectric constant of soil during freezing and thawing processes: An application on silty clay. Acta Geotech. 2022, 17, 3867–3886.
- Hernandez-Soriano, M.C.; Jimenez-Lopez, J.C. Effects of soil water content and organic matter addition on the speciation and bioavailability of heavy metals. Sci. Total Environ. 2012, 423, 55–61.
- Kabir, H.; Khan, M.J.; Brodie, G.; Gupta, D.; Pang, A.; Jacob, M.V.; Antunes, E. Measurement and modelling of soil dielectric properties as a function of soil class and moisture content. J. Microw. Power Electromagn. Energy 2020, 54, 3–18.
- Topp, G.C.; Davis, J.L.; Annan, A.P. Electromagnetic determination of soil water content: Measurements in coaxial transmission lines. Water Resour. Res. 1980, 16, 574–582.
- He, H.; Dyck, M.; Zhao, Y.; Si, B.; Jin, H.; Zhang, T.; Lv, J.; Wang, J. Evaluation of five composite dielectric mixing models for understanding relationships between effective permittivity and unfrozen water content. Cold Reg. Sci. Technol. 2016, 130, 33–42.
- Pan, X.; Han, Y.; Chun, K.P.; Zhang, J.; Ma, D.; Gao, H. On the laboratory calibration of dielectric permittivity models for agricultural soils: Effect of systematic porosity variation. Vadose Zone J. 2021, 20, e20096.
- Chen, Y.P.; Or, D. Geometrical factors and interfacial processes affecting complex dielectric permittivity of partially saturated porous media. Water Resour. Res. 2006, 42, W06423.
- Majcher, J.; Kafarski, M.; Wilczek, A.; Woszczyk, A.; Szypłowska, A.; Lewandowski, A.; Szerement, J.; Skierucha, W. Application of a Monopole Antenna Probe with an Optimized Flange Diameter for TDR Soil Moisture Measurement. Sensors 2020, 20, 2374.
- Hardie, M. Review of Novel and Emerging Proximal Soil Moisture Sensors for Use in Agriculture. Sensors 2020, 20, 6934.
- Xu, X.; Wang, H.; Qu, X.; Li, C.; Cai, B.; Peng, G. Study on the dielectric properties and dielectric constant model of laterite. Front. Earth Sci. 2022, 10, 1035692.
- Liao, H.; Dong, H.; Ning, C.; Zhang, J.; Sun, J. A new logarithmic dielectric constant model of soils. Jpn. Geotech. Soc. Spec. Publ. 2019, 7, 281–286.
- Xu, J.; Zhou, G.; Su, S.; Cao, Q.; Tian, Z. The Development of A Rigorous Model for Bathymetric Mapping from Multispectral Satellite-Images. Remote Sens. 2022, 14, 2495.
- Xu, Z.; Li, X.; Li, J.; Xue, Y.; Jiang, S.; Liu, L.; Luo, Q.; Wu, K.; Zhang, N.; Feng, Y.; et al. Characteristics of Source Rocks and Genetic Origins of Natural Gas in Deep Formations, Gudian Depression, Songliao Basin, NE China. ACS Earth Space Chem. 2022, 6, 1750–1771.
- Roth, K.; Schulin, R.; Flühler, H.; Attinger, W. Calibration of time domain reflectometry for water content measurement using a composite dielectric approach. Water Resour. Res. 1990, 26, 2267–2273.
- Savin, I.V.; Muzalevskiy, K.V. Dielectric Model for Thawed Organic Soils at Frequency of 435 MHz. IEEE Geosci. Remote Sens. Lett. 2021, 18, 218–221.
- Bogena, H.R.; Huisman, J.A.; Schilling, B.; Weuthen, A.; Vereecken, H. Effective Calibration of Low-Cost Soil Water Content Sensors. Sensors 2017, 17, 208.
- Kibirige, D.; Dobos, E. Off-Site Calibration Approach of EnviroScan Capacitance Probe to Assist Operational Field Applications. Water 2021, 13, 837.
- Bianchi, F.; Chiappini, M.; Giordano, R. Formation, diffusion and distribution of leachate: Integrated mathematical models of SIGLOD project. Quad. Di Geofis. 2015, 128, 1–30.
- Wang, J.R. The dielectric properties of soil-water mixtures at microwave frequencies. Radio Sci. 1980, 15, 977–985.
- Park, C.-H.; Behrendt, A.; LeDrew, E.; Wulfmeyer, V. New Approach for Calculating the Effective Dielectric Constant of the Moist Soil for Microwaves. Remote Sens. 2017, 9, 732.
- Wang, J.R.; Schmugge, T.J. An Empirical Model for the Complex Dielectric Permittivity of Soils as a Function of Water Content. IEEE Trans. Geosci. Remote Sens. 1980, GE-18, 288–295.
- Malicki, M.A.; Plagge, R.; Roth, C.H. Improving the calibration of dielectric TDR soil moisture determination taking into account the solid soil. Eur. J. Soil Sci. 1996, 47, 357–366.
- Robinson, D.A.; Jones, S.B.; Blonquist, J.M.; Friedman, S.P. A Physically Derived Water Content/Permittivity Calibration Model for Coarse-Textured, Layered Soils. Soil Sci. Soc. Am. J. 2005, 69, 1372–1378.
- Gardner, C.M.K.; Dean, T.J.; Cooper, J.D. Soil Water Content Measurement with a High-Frequency Capacitance Sensor. J. Agric. Eng. Res. 2018, 71, 395–403.
- Szerement, J.; Woszczyk, A.; Szypłowska, A.; Kafarski, M.; Lewandowski, A.; Wilczek, A.; Skierucha, W. A Seven-Rod Dielectric Sensor for Determination of Soil Moisture in Well-Defined Sample Volumes. Sensors 2019, 19, 1646.
- Moshayedi, A.J.; Sohail Khan, A.; Hu, J.; Nawaz, A.; Zhu, J. E-Nose-Driven Advancements in Ammonia Gas Detection: A Comprehensive Review from Traditional to Cutting-Edge Systems in Indoor to Outdoor Agriculture. Sustainability 2023, 15, 11601.
- Wojciech, S. Time Domain Reflectometry: Temperature-dependent Measurements of Soil Dielectric Permittivity. In Electromagnetic Waves; Vitaliy, Z., Ed.; IntechOpen: Rijeka, Croatia, 2011.
- Or, D.; Wraith, J.M. Temperature effects on soil bulk dielectric permittivity measured by time domain reflectometry: A physical model. Water Resour. Res. 1999, 35, 371–383.
- Loewer, M.; Günther, T.; Igel, J.; Kruschwitz, S.; Martin, T.; Wagner, N. Ultra-broad-band electrical spectroscopy of soils and sediments—A combined permittivity and conductivity model. Geophys. J. Int. 2017, 210, 1360–1373.
- He, M.-Y.; Dong, J.-B.; Jin, Z.; Liu, C.-Y.; Xiao, J.; Zhang, F.; Sun, H.; Zhao, Z.-Q.; Gou, L.-F.; Liu, W.-G.; et al. Pedogenic processes in loess-paleosol sediments: Clues from Li isotopes of leachate in Luochuan loess. Geochim. Et Cosmochim. Acta 2021, 299, 151–162.
- Vaz, C.M.P.; Jones, S.; Meding, M.; Tuller, M. Evaluation of standard calibration functions for eight electromagnetic soil moisture sensors. Vadose Zone J. 2013, 12, 1–16.
- Adla, S.; Rai, N.K.; Karumanchi, S.H.; Tripathi, S.; Disse, M.; Pande, S. Laboratory Calibration and Performance Evaluation of Low-Cost Capacitive and Very Low-Cost Resistive Soil Moisture Sensors. Sensors 2020, 20, 363.
- Szerement, J.; Saito, H.; Furuhata, K.; Yagihara, S.; Szypłowska, A.; Lewandowski, A.; Kafarski, M.; Wilczek, A.; Majcher, J.; Woszczyk, A.; et al. Dielectric Properties of Glass Beads with Talc as a Reference Material for Calibration and Verification of Dielectric Methods and Devices for Measuring Soil Moisture. Materials 2020, 13, 1968.
- Qi, J.L.; Ma, W. State-of-art of research on mechanical properties of frozen soils. Rock Soil Mech. 2010, 31, 133–143.
- Wan, X.; Lai, Y.; Wang, C. Experimental study on the freezing temperatures of saline silty soils. Permafr. Periglac. Process. 2015, 26, 175–187.
- Torres-Rua, A.F.; Ticlavilca, A.M.; Bachour, R.; McKee, M. Estimation of Surface Soil Moisture in Irrigated Lands by Assimilation of Landsat Vegetation Indices, Surface Energy Balance Products, and Relevance Vector Machines. Water 2016, 8, 167.
- Huang, J.; Gómez-Dans, J.L.; Huang, H.; Ma, H.; Wu, Q.; Lewis, P.E.; Liang, S.; Chen, Z.; Xue, J.-H.; Wu, Y.; et al. Assimilation of remote sensing into crop growth models: Current status and perspectives. Agric. For. Meteorol. 2019, 276–277, 107609.
- Stellini, J.; Farrugia, L.; Farhat, I.; Bonello, J.; Persico, R.; Sacco, A.; Spiteri, K.; Sammut, C.V. Broadband Measurements of Soil Complex Permittivity. Sensors 2023, 23, 5357.
- Yao, X.; Yu, X.; Wang, L.; Zeng, Y.; Mao, L.; Liu, S.; Xie, H.; He, G.; Huang, Z.; Liu, Z. Preparation of cinnamic hydroxamic acid collector and study on flotation characteristics and mechanism of scheelite. Int. J. Min. Sci. Technol. 2023, 33, 773–781.
- Lu, Q.; Liu, K.; Zeng, Z.; Liu, S.; Li, R.; Xia, L.; Guo, S.; Li, Z. Estimation of the Soil Water Content Using the Early Time Signal of Ground-Penetrating Radar in Heterogeneous Soil. Remote Sens. 2023, 15, 3026.
- Zhang, T.; Song, B.; Han, G.; Zhao, H.; Hu, Q.; Zhao, Y.; Liu, H. Effects of coastal wetland reclamation on soil organic carbon, total nitrogen, and total phosphorus in China: A meta-analysis. Land Degrad. Dev. 2023, 34, 3340–3349.
- Mohanty, B.P.; Cosh, M.H.; Lakshmi, V.; Montzka, C. Soil moisture remote sensing: State-of-the-science. Vadose Zone J. 2017, 16, 1–9.
- Lakshmi, V. Remote Sensing of Soil Moisture. ISRN Soil Sci. 2013, 2013, 424178.
- Araya, S.N.; Fryjoff-Hung, A.; Anderson, A.; Viers, J.H.; Ghezzehei, T.A. Advances in soil moisture retrieval from multispectral remote sensing using unoccupied aircraft systems and machine learning techniques. Hydrol. Earth Syst. Sci. 2021, 25, 2739–2758.
- Babaeian, E.; Sadeghi, M.; Jones, S.B.; Montzka, C.; Vereecken, H.; Tuller, M. Ground, Proximal, and Satellite Remote Sensing of Soil Moisture. Rev. Geophys. 2019, 57, 530–616.
- Yin, L.; Wang, L.; Li, T.; Lu, S.; Yin, Z.; Liu, X.; Li, X.; Zheng, W. U-Net-STN: A Novel End-to-End Lake Boundary Prediction Model. Land 2023, 12, 1602.
- Jia, B.; Zhou, G. Estimation of global karst carbon sink from 1950s to 2050s using response surface methodology. Geo-Spat. Spat. Spat. Inf. Sci. 2023, 1–18.
- Yin, L.; Wang, L.; Li, T.; Lu, S.; Tian, J.; Yin, Z.; Li, X.; Zheng, W. U-Net-LSTM: Time Series-Enhanced Lake Boundary Prediction Model. Land 2023, 12, 1859.
- Alexandridis, T.K.; Cherif, I.; Bilas, G.; Almeida, W.G.; Hartanto, I.M.; Van Andel, S.J.; Araujo, A. Spatial and Temporal Distribution of Soil Moisture at the Catchment Scale Using Remotely-Sensed Energy Fluxes. Water 2016, 8, 32.
- Koch, F.; Schlenz, F.; Prasch, M.; Appel, F.; Ruf, T.; Mauser, W. Soil Moisture Retrieval Based on GPS Signal Strength Attenuation. Water 2016, 8, 276.
- Li, Z.; Zeng, Z.; Xiong, H.; Lu, Q.; An, B.; Yan, J.; Li, R.; Xia, L.; Wang, H.; Liu, K. Study on Rapid Inversion of Soil Water Content from Ground-Penetrating Radar Data Based on Deep Learning. Remote Sens. 2023, 15, 1906.
- Qiu, S.; Yang, H.; Zhang, S.; Huang, S.; Zhao, S.; Xu, X.; He, P.; Zhou, W.; Zhao, Y.; Yan, N.; et al. Carbon storage in an arable soil combining field measurements, aggregate turnover modeling and climate scenarios. CATENA 2023, 220, 106708.
- Ozgur, M. Development and validation of a degree of saturation prediction model using time domain reflectometry for compaction control. Transp. Geotech. 2023, 42, 101062.
- González-Teruel, J.D.; Jones, S.B.; Soto-Valles, F.; Torres-Sánchez, R.; Lebron, I.; Friedman, S.P.; Robinson, D.A. Dielectric Spectroscopy and Application of Mixing Models Describing Dielectric Dispersion in Clay Minerals and Clayey Soils. Sensors 2020, 20, 6678.
- Dyck, M.; Miyamoto, T.; Iwata, Y.; Kameyama, K. Bound Water, Phase Configuration, and Dielectric Damping Effects on TDR-Measured Apparent Permittivity. Vadose Zone J. 2019, 18, 190027.
- He, H.; Flerchinger, G.N.; Kojima, Y.; Dyck, M.; Lv, J. A review and evaluation of 39 thermal conductivity models for frozen soils. Geoderma 2021, 382, 114694.
- He, H.; Dyck, M. Application of Multiphase Dielectric Mixing Models for Understanding the Effective Dielectric Permittivity of Frozen Soils. Vadose Zone J. 2013, 12, 1–22.
- Greco, R.; Guida, A. Field measurements of topsoil moisture profiles by vertical TDR probes. J. Hydrol. 2018, 348, 442–451.
- Regalado, C.M. A physical interpretation of logarithmic TDR calibration equations of volcanic soils and their solid fraction permittivity based on Lichtenecker’s mixing formulae. Geoderma 2014, 123, 41–50.
- Gnatowski, T.; Szatyłowicz, J.; Pawluśkiewicz, B.; Oleszczuk, R.; Janicka, M.; Papierowska, E.; Szejba, D. Field Calibration of TDR to Assess the Soil Moisture of Drained Peatland Surface Layers. Water 2018, 10, 1842.
- Pepin, S.; Livingston, N.J.; Hook, W.R. Temperature-Dependent Measurement Errors in Time Domain Reflectometry Determinations of Soil Water. Soil Sci. Soc. Am. J. 2015, 59, 38–43.
- Cui, F.; Ni, J.; Du, Y.; Zhao, Y.; Zhou, Y. Soil water content estimation using ground penetrating radar data via group intelligence optimization algorithms: An application in the Northern Shaanxi Coal Mining Area. Energy Explor. Exploit. 2020, 39, 318–335.
- Mukhlisin, M.; Saputra, A.; Taha, M. A New Model of Dielectric Analysis for Measurement Soil Moisture Water Content. J. Eng. Sci. Technol. 2013, 13, 2910.
- Amankwah, S.K.; Ireson, A.M.; Brannen, R. An improved model and field calibration technique for measuring liquid water content in unfrozen and frozen soils with dielectric probes. Vadose Zone J. 2022, 21, e20225.
- Xu, J.; Logsdon, S.; Ma, X.; Horton, R.; Han, W.; Zhao, Y. Measurement of Soil Water Content with Dielectric Dispersion Frequency. Soil Sci. Soc. Am. J. 2014, 78, 1500.
- Inaudi, D.; Glisic, B. Distributed fiber-optic sensing for long-range monitoring of pipelines. In Proceedings of the 3rd International Conference on Structural Health Monitoring of Intelligent Infrastructure, Vancouver, BC, Canada, 13–16 November 2007; pp. 1–8.
- Peng, J.; Loew, A. Recent Advances in Soil Moisture Estimation from Remote Sensing. Water 2017, 9, 530.
- Satoh, Y.; Kakiuchi, H. Calibration method to address influences of temperature and electrical conductivity for a low-cost soil water content sensor in the agricultural field. Agric. Water Manag. 2021, 255, 107015.
- Peng, W.; Lu, Y.; Wang, M.; Ren, T.; Horton, R. Determining water content and bulk density: The heat-pulse method outperforms the thermo-TDR method in high-salinity soils. Geoderma 2022, 407, 115564.
- Lu, Y.; Song, W.; Lu, J.; Wang, X.; Tan, Y. An Examination of Soil Moisture Estimation Using Ground Penetrating Radar in Desert Steppe. Water 2017, 9, 521.
- Zhou, L.; Yu, D.; Wang, X.; Wang, X.; Zhang, H. Determination of top soil water content based on high-frequency ground penetrating radar. Acta Pedol. Sin. 2016, 53, 621–626.
- Dai, H.; Liu, Y.; Guadagnini, A.; Yuan, S.; Yang, J.; Ye, M. Comparative Assessment of Two Global Sensitivity Approaches Considering Model and Parameter Uncertainty. Water Resour. Res. 2024, 60, e2023WR036096.
- Zhao, Y.; Ding, Z.; Shen, C.; Chen, Y. Interfacial microstructure and properties of aluminum–magnesium AZ31B multi-pass friction stir processed composite plate. Mater. Des. 2016, 94, 240–252.
- Liu, X.; Chen, J.; Cui, X.; Liu, Q.; Cao, X.; Chen, X. Measurement of soil water content using ground-penetrating radar: A review of current methods. Int. J. Digit. Earth 2019, 12, 95–118.
- Koyama, C.N.; Liu, H.; Takahashi, K.; Shimada, M.; Watanabe, M.; Khuut, T.; Sato, M. In-Situ Measurement of Soil Permittivity at Various Depths for the Calibration and Validation of Low-Frequency SAR Soil Moisture Models by Using GPR. Remote Sens. 2017, 9, 580.
- Novák, V.; Hlaváčiková, H. Soil-Water Content and Its Measurement. In Applied Soil Hydrology; Novák, V., Hlaváčiková, H., Eds.; Springer International Publishing: Cham, Switzerland, 2019; pp. 49–61.
- He, H.; Turner, N.C.; Aogu, K.; Dyck, M.; Feng, H.; Si, B.; Wang, J.; Lv, J. Time and frequency domain reflectometry for the measurement of tree stem water content: A review, evaluation, and future perspectives. Agric. For. Meteorol. 2021, 306, 108442.
- Zhu, Y.; Irmak, S.; Jhala, A.; Vuran, M.; Diotto, A. Time-domain and Frequency-domain Reflectometry Type Soil Moisture Sensor Performance and Soil Temperature Effects in Fine- and Coarse-textured Soils. Appl. Eng. Agric. 2019, 35, 117–134.
- De Vos, B.; Cools, N.; Verstraeten, A.; Neirynck, J. Accurate Measurements of Forest Soil Water Content Using FDR Sensors Require Empirical In Situ (Re)Calibration. Appl. Sci. 2021, 11, 11620.
- Lü, H.B.; Jiang, W.Y.; Zhao, Y.L.; Zeng, Z.T. Relationship between volumetric water content and effective dielectric permittivity of Nanning expansive soil. Rock Soil Mech. 2016, 37, 2145–2150.
- Xu, X.; Zhang, W.; Fan, C.; Li, G. Effects of temperature, dry density and water content on the thermal conductivity of Genhe silty clay. Results Phys. 2020, 16, 102830.
- Yan, G.; Bore, T.; Bhuyan, H.; Schlaeger, S.; Scheuermann, A. The Technical Challenges for Applying Unsaturated Soil Sensors to Conduct Laboratory-Scale Seepage Experiments. Sensors 2022, 22, 3724.
- Yu, J.; Zhu, Y.; Yao, W.; Liu, X.; Ren, C.; Cai, Y.; Tang, X. Stress relaxation behaviour of marble under cyclic weak disturbance and confining pressures. Measurement 2021, 182, 109777.
- Ren, C.; Yu, J.; Liu, S.; Yao, W.; Zhu, Y.; Liu, X. A Plastic Strain-Induced Damage Model of Porous Rock Suitable for Different Stress Paths. Rock Mech. Rock Eng. 2022, 55, 1887–1906.
- Orangi, A.; Narsilio, G.A.; Ryu, D. A Laboratory Study on Non-Invasive Soil Water Content Estimation Using Capacitive Based Sensors. Sensors 2019, 19, 651.
- Xu, L.L.; Gao, C.H.; Wang, J.M. Evaluation and analysis of TDR calibration curves for soil water content measurement. J. Glaciol. Geocryol. 2020, 42, 265–275.
- He, H.; Aogu, K.; Li, M.; Xu, J.; Sheng, W.; Jones, S.B.; González-Teruel, J.D.; Robinson, D.A.; Horton, R.; Bristow, K.; et al. A review of time domain reflectometry (TDR) applications in porous media. In Advances in Agronomy; Sparks, D.L., Ed.; Academic Press: Cambridge, MA, USA, 2021; Volume 168, pp. 83–155.
- Underwood, T.R.; Bourg, I.C. Dielectric Properties of Water in Charged Nanopores. J. Phys. Chem. B 2022, 126, 2688–2698.
- Mohan, V.B.; Jayaraman, K.; Bhattacharyya, D. Brunauer–Emmett–Teller (BET) specific surface area analysis of different graphene materials: A comparison to their structural regularity and electrical properties. Solid State Commun. 2020, 320, 114004.
- Zhao, Y.; Wang, H.; Song, B.; Xue, P.; Zhang, W.; Peth, S.; Lee Hill, R.; Horn, R. Characterizing uncertainty in process-based hydraulic modeling, exemplified in a semiarid Inner Mongolia steppe. Geoderma 2023, 440, 116713.
- Huan, Z.; Wang, H.; Li, C.; Wan, C. The soil moisture sensor based on soil dielectric property. Pers. Ubiquitous Comput. 2017, 21, 67–74.
- Abdullah, N.H.H.; Kuan, N.W.; Ibrahim, A.; Ismail, B.N.; Majid, M.R.A.; Ramli, R.; Mansor, N.S. Determination of Soil Water Content Using Time Domain Reflectometer (TDR) for Clayey Soil; Advances in Civil Engineering and Science Technology; AIP Publishing: Melville, NY, USA, 2018.
- Singh, J.; Lo, T.; Rudnick, D.R.; Dorr, T.J.; Burr, C.A.; Werle, R.; Shaver, T.M.; Muñoz-Arriola, F. Performance assessment of factory and field calibrations for electromagnetic sensors in a loam soil. Agric. Water Manag. 2018, 196, 87–98.
