Your browser does not fully support modern features. Please upgrade for a smoother experience.
Please note this is a comparison between Version 2 by Jean-Noël Jaubert and Version 1 by Jean-Noël Jaubert.
In the late 1960s, a handful of inspired researchers predicted the great potential of supercritical CO2 (“sCO2”) cycles for the production of electricity and highlighted the prospects for dramatic reductions in component sizes and efficiency increases. Since then, considerable development programs have been deployed around the world to “tame” this new technology.
- supercritical CO2
- electric power
- thermodynamic cycle
1. Introduction
The use of sCO2 cycles to produce electric power is an emerging technology which is expected to bring substantial efficiency gains. This power generation route then attracts the interest of the power community, including producers and major OEMs as it would also reduce the size of cycle components and thus decrease the CAPEX of power plants.
However, during successive development attempts, initially carried out on small test loops, the experimenters faced technical issues which prevented the rapid release of viable pilot units. These difficulties, not anticipated by the precursors of the technology, are linked to marked specificities of sCO2 cycles, in particular their high pressures but low-pressure ratios, the difficulty of controlling CO2 leaks and the unusually small dimensions of certain components, which require unconventional designs. That technology is therefore still in the engineering and testing phase, with the most consistent and active program being currently the so-called “Supercritical Transformational Electric Power” (STEP), funded by the US Department of Energy (DOE) [1,2].
2. Brief History
In the late 1960s, a small number of scientists (Angelino in Italy [4,5,6]; Feher in the USA [7,8]; Gokhstein and Verhivker in the former USSR [9]) laid the foundations for the sCO2 technology as a path to efficient power generation. After three decades during which these pioneering works were neglected [10], a series of development programs began mainly in the USA, Japan and Korea, using test rigs of a few dozen kWe [11,12,13,14,15,16,17,18]. However, these tests revealed a series of unexpected and arduous issues, including disturbing CO2 leaks that proved difficult to control; operation instabilities with difficulties reaching stationary loads and thermal stresses experienced by turbine materials at temperatures above 500 °C. Therefore, although significant progress has been made in understanding the general requirements of this technology in terms of hardware, systems and controls, these programs have not to date resulted in a generic prototype design suitable for large power blocks. Nevertheless, the so-called SunShot project launched in 2011 by the US DOE and teamed by SwRI and GE has delivered fruitful design concepts for small-size units, namely for a 1 MW, 715 °C turbine able to rotate at 27,000 rpm [19,20]. Incidentally, it should be noted that the designs created for small turbomachines running at such high speeds cannot be directly extrapolated, for mechanical reasons, to large turbogenerators which must instead rotate at 3600 or 3000 rpm. More recently (2016), the DOE launched the STEP project intended to deliver industrial sCO2 power units of the 10 MWe size [21,22]. This program is based on a 16 MW turbine prototype and is led by the GTI, SwRI and GE forming the main partners of a dedicated Joint Industrial Program (JIP). It is important to mention that the STEP pilot plant is actually equipped with quite large thermal components, namely a 93 MWth CO2 heater and a 50 MWth heat recuperator, which will allow further scale-ups of future prototypes [23].3. Fundamental Properties of sCO2 Cycles
In this section, the researchers will focus on the “conceptual” advantages and drawbacks of the sCO2 technology, which result from the specificities of supercritical fluids [25] and the design of the corresponding cycles. Figure 2 shows a general P-H diagram that will be used in the analysis of sCO2 power cycles. One distinguishes four regions around the critical point (“CP”): the liquid, the supercritical (P > Pc and T > Tc), the real gas and perfect gas regions.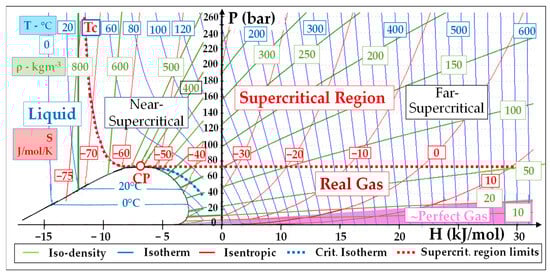
Figure 2. P-H diagram of CO2 with the temperature, density and entropy isopleths suitable for the representation of sCO2 power cycles.
3.1. The Conceptual Strengths
The two fundamental advantages of sCO2 cycles are (1) elevated efficiency and (2) reduced component sizes [26,27,28]. We will show that both result from a single property, namely the high density of supercritical fluids, as compared to gases and vapors used in the subcritical cycles.3.1.1. Efficient Compression and Expansion Result in High Cycle Efficiency
The elemental compression or expansion work (δw) involving a unit mass of fluid and performed in reversible conditions (i.e., at constant entropy), is given by the following equation:
- -
-
Density is high (ρ ≈ 400–600 kg/m3) in the zone close to the critical point (“CP”): the “near-supercritical” region
- -
-
It decreases (down to 100 kg/m3) in the higher enthalpy (“far-supercritical”) region.
- -
-
It still decreases in the “real gas” region (ρ ≈ 50 kg/m3) and even more in the nearly-perfect CO2 (pink area) region: there, ρ drops to around 10 kg/m3 below 10 bar and its value at 0 °C-1 atm falls to 2 kg/m3.
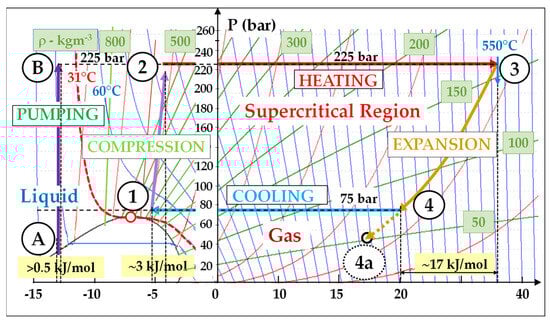 Figure 3. Basic sCO2 Brayton cycle (non-recuperated: (T–, P–) = (45 °C, 75 bar) − (T+, P+) = (550 °C, 225 bar): Wcompr/Wexp = 3/17 = 0.18; reversible conditions.
- -
-
The reversible mechanical work (Wcompr) consumed for the compression performed in the near-supercritical region is very low; indeed, in stage 1 → 2, ρ = 600 kg/m3 (Figure 1) and Wcompr ≈ 3 kJ/mol.
- -
-
Reversely, the expansion work (Wexp) which is performed in the far-supercritical region is high; in stage 3 → 4, Wexp is approximately equal to 17 kJ/mol.Indeed, we must note that the density is the highest (and Wcompr the lowest) in the liquid region, where ρCO2 typically exceeds 800 kg/m3. This allows for very efficient pumping stages, which represents an inherent efficiency merit of Rankine cycles: for example, the pumping stage A → B (ρ ≈ 900 kg/m3) consumes hardly 0.5 kJ/mol (Figure 3). Such favorable compression and expansion stages result in excellent cycle efficiencies.
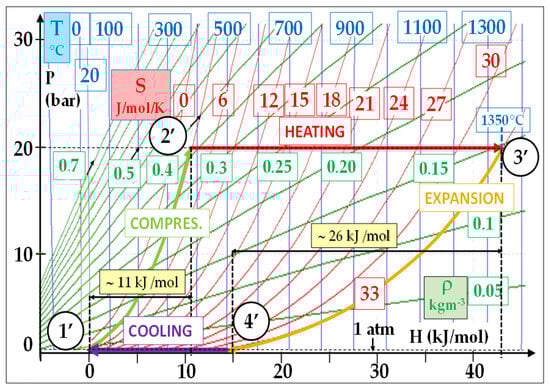 Figure 4. Typical air Brayton cycle: (T–, P–) = (20 °C, 1 atm) − (T+, P+) = (1350 °C, 250 bar); reversible conditions: Wcompr/Wexp = 11/26 = 0.42.
3.1.2. Compactness of sCO2 Power Units
The second key advantage of sCO2 cycles is the dramatic reduction in size of cycle components, which is again correlated to the high density of supercritical CO2 [29,30]. Indeed, to control the level of turbulence of the fluid and minimize the resulting losses in static pressure and efficiency, the cross-section of a turbomachine is designed proportional to the volumetric flow of the fluid, i.e., inversely proportional to its density. Although the sCO2 machines have higher mass flow rates (for the reasons that will be set out in paragraph 4.2.1), their sizes are significantly smaller due to the fluid density effect. Figure 5 presents a notional comparison between the diameters of a sCO2 turbine and a steam turbine (“ST”) that deliver power output of the same order [31]. A quantitative comparison will be proposed below (§ 5.1).It is worth noting that the rotation speed of the shaft also conditions the size: the higher the speed, the smaller the diameter.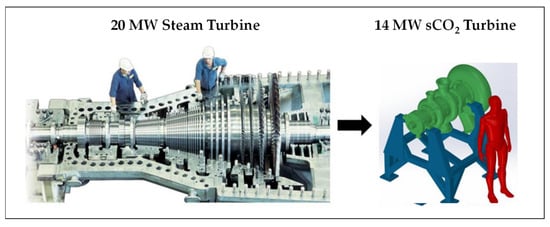 Figure 5. Qualitative comparison between the size of a steam turbine and an sCO2 turbine [31].
3.1.3. Other Strengths Linked to Favorable Properties of the CO2 Molecule
SCO2 cycles have other important merits linked to advantageous properties of the CO2 molecule. Firstly, unlike H2O that has elevated critical properties (374 °C, 221 bar), the critical point of CO2 is easily accessible (31.1 °C, 73.8 bars). Additionally, compared to hydrocarbons used in Organic Rankine Cycles (ORC), CO2 does not ignite or explode; its toxicity (risk of asphyxiation) occurs at a much higher concentration in the air and its GWP and ODP data are much lower: for example, the GWP of propane is 3 while that of CO2 is 1 by definition [32]. It boasts also a very high thermal resistance, which allows for a wide operation temperature range in power cycles, from for example 200 °C (including e.g., heat recovery cycles and geothermal applications [33]) up to 51100 °C (including solar [34] and nuclear [35] applications). All these characteristics make CO2 a versatile cycle fluid: while the usages of steam and air are limited respectively to Rankine and Brayton cycles, CO2 can be used in both and, moreover, not only within power cycles but also within refrigeration ones. Finally, the closed nature of these cycles results in rather clean circuits, apart from the need to stop wear particles by filtration. This contrasts with the complex and costly water treatment of steam cycles and the need of periodical cleanings of gas turbines due to the progressive fouling of their compressors by dust and salts from ambient air.3.2. The Conceptual Drawbacks
3.2.1. Low Pressure Ratios Cause Low Specific Power Outputs
Although supercritical cycles operate at high pressures, they have low pressure ratios. Indeed, given that the pressure of a true supercritical cycle (Brayton) must exceed 73.8 bars in all stages, the pressure ratio (“Rc”) turns out to be rather limited. For example, if we reasonably limit the value of P+ to 250 bar and start compression at P– = 75 bar, then the Rc is barely 3.3, leading to low enthalpy drops and limited expansion works in the power turbine. Low Rc values result in low turbine outputs. We can define the “specific power output” (SPO) of a power generation unit as its electrical output (Wel) divided by the mass flow rate (Qm) of the fluid passing through the cycle, i.e., SPO = Wel/Qm. Table 1 compares, in their orders of magnitude, the SPOs of three usual cycles, namely: steam-Rankine; air Brayton and sCO2 Brayton. The SPOs of the sCO2 cycles turn out to be roughly 3 times (respectively 15 times) lower than that of an F-class gas turbine cycle (respectively of a steam cycle). Nevertheless, this does not prevent the reduction in equipment size mentioned above owing to the much greater density of supercritical CO2.Table 1. Compared SPO data of typical steam-Rankine, air-Brayton and sCO2 Brayton cycles.Cycle Type Two-Pressure
Steam RankineAir Brayton
(F-Class Gas Turbine)sCO2 Brayton
(RCBC)Fluid H2O Air & Comb. Gas CO2 T–/T+ [°C] 20/540 20/1350 45/550 P+/P– [-] 75/0.05 30/1.013 225/75 Rc (press. ratio) 1500 20 3 SPO = Wel/Qm (1) ~1450 ~300 ~100 (1) the unit of SPO is kWe/(kgCO2/s) or kJe/kgCO2.3.2.2. Low Specific Power Requires Intense Heat Recuperation
As the turbine generates little power, it discharges still hot CO2. Heat recuperation at its outlet, before heat rejection, is then desirable to improve efficiency. In other words, sCO2 cycles require intense thermal recuperation.3.2.3. The Narrow Operability of sCO2 Rankine Cycles (Figure 1C)
The critical temperature of CO2 is rather low (Tc = 31.1 °C). Consequently, heat sinks capable of completely condensing CO2 must have a maximum temperature of about 25 °C. Unfortunately, such cold heat sinks are not so common and will become less available due to the global climate change, which is a strong handicap for sCO2 Rankine cycles. Two options can be explored to resolve this issue: Option A—Attempts to increase the critical temperature [36,37]: The first possible approach consists in looking for a substance “X” which, once blended with CO2, would increase the Tc value by e.g., 15 °C. However, ultimately, these attempts show that it looks impossible in practice to find such molecule that would be acceptable from an EHS and cost standpoint. Option B—Moving from a “wet transcritical” to a “dry transcritical” cycle: The second approach consists in passing from a “wet transcritical” (i.e., Rankine) to a “dry transcritical” cycle since the latter does not impose any conditions on the heat sink temperature. In fact, a “dry transcritical” cycles is illustrated in Figure 6, offers an interesting option to both address the narrow operability of the Rankine cycle and improve the efficiency of a true supercritical cycle.It has also two additional advantages from an efficiency point of view: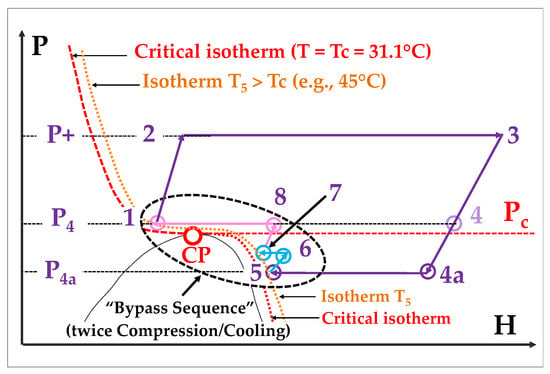 Figure 6. “Dry transcritical” cycle: the cooling stage is stopped when reaching the 45°C isotherm.
- -
-
The Rc value becomes increased from (P3/P4) to (P3/P4a): we thus escape the pressure ratio limitation suffered by true supercritical Brayton) cycles
- -
-
There are other improvements in efficiency, which again result from Equation (1); indeed, referring to the chart of Figure 3, the extended expansion causes the density to pass from about 75 kg/m3 (point 4) to about 50 kg/m3 (point 4a); moreover, ρ increases again during the recompression stages from point 5 to point 8.
3.2.4. The Gap between Conceptual and Practical Evaluation
The conceptual evaluation outlined above, shows very favorable thermodynamics but it relies on ideal conditions. In reality, the actual isentropic efficiencies of turbomachines have a strong impact on performances. Moreover, the technology of sCO2 power cycles is sometimes said to be in its “infancy” [40] and there is still progress to be made to reach optimized performances.