Your browser does not fully support modern features. Please upgrade for a smoother experience.
Please note this is a comparison between Version 1 by Mastaneh Davis and Version 2 by Catherine Yang.
The Domain Name System (DNS) protocol is fundamental to the operation of the Internet with the primary purpose of translating domain names to IP addresses. This important service facilitates access to the Internet by using website names or any arbitrary domain names. The DNS protocol communicates internal requests to external remote servers and creates a landscape for attackers to perform malicious activities such as stealing credentials and sensitive data. One of the most effective DNS attack types is DNS tunnelling, where the attacker creates a tunnel between the client’s network and the attacker’s machine, utilising command and control channels to obscure data and bypass the firewall and intrusion detection systems.
- DNS tunnelling
- DNS exfiltration
- the elastic stack
- DNS monitoring
- cloud computing
1. Statistical Analysis of Domains and Subdomains
Most legitimate domain names tend to have a meaningful human-readable name, while domain generated algorithm (DGA), malware and tunnelling applications use randomly created domains and subdomains [1][2][28,29]. Hence, domains with a higher randomness may indicate a DNS attack. The randomness of information can be measured by the concept of information entropy or Shannon entropy, which was introduced by Claude Shannon [3][30]. The Shannon entropy, H, of a discrete set of probabilities 𝑝𝑖, is defined as
 where n is the total number of observed events, i.e., 𝑖=1,2,3,…,𝑛. The Shannon entropy definition and score can be used for domain and subdomain names of DNS queries where higher entropy values will indicate a high randomness of a domain.
In this study, the DNS logs gathered by the Elasticsearch and the randomness of ss.slehee.com and ns.slehee.uk domains have been identified by extending the search interval to include the DNS tunnelling activities from Iodine and DNScat2. One of the features in Elasticsearch is statistical analysis of the strings, which can be set to determine the Shannon entropy of the queries. Shannon entropy measures uncertainty of the given domain name and it provides fast and accurate results in real-time. If the entropy value exceeds a defined threshold score, then this may be an indication of DNS tunnelling activities. The results of this experiment show a high entropy score for ns.slehee.uk, and a high-level of randomness in the queried domain names, as shown in Figure 18. Generally, entropy scores of non-malicious DNS queries are less than 4 [4][12]. According to Figure 18, the entropy score of more than 4 for all the considered DNS queries highlights the exfiltration of data via the DNS protocol. Typically, normal and safe domains have a lower entropy score; for example, the entropy value for the google.com and debian.org domains were obtained and measured approximately 2.5.
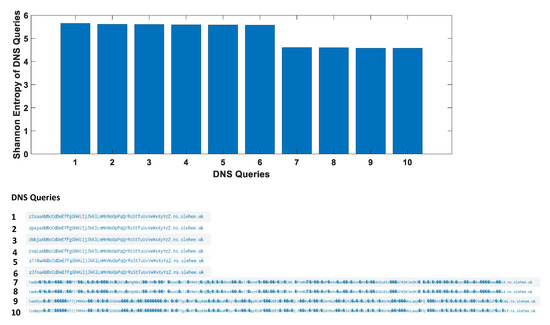
Figure 18.
The first part of the figure shows Shannon entropy score of DNS queries. The second part of the figure lists the DNS queries.
However, this approach may result in false-negative outcomes, as there are some exceptions, where DNS names are used to represent information, e.g., version names where numbers and characters are included in the queries or domain name generators that are often used by large cloud providers. Another benign element which can cause higher than normal entropy is content delivery network (CDN) assistance and site hosting [5][31]. In such scenarios, the character frequency probability may help to identify the nature of a DNS query. For this study, in order to analyse the probability of each character, the DNS data packets were monitored using the packetbeat platform, which is integrated into the Elastic stack.
Analysis of the dns.question.subdomain field reveals that some subdomains have a lot of numerical characters in the DNS queries. To get a more accurate view of the character distribution, the Elastic developer tools were used to analyse the dns.question.subdomain field with the Shannon entropy value based on the frequency probability of each character as shown in Figure 29. This figure also shows the distribution of the characters probability in descending order, where numerical characters are residing at top of the list. According to the figure, a higher entropy value coupled with a higher integer frequency probability is a strong indicator of data exfiltration by exploiting the DNS protocol.
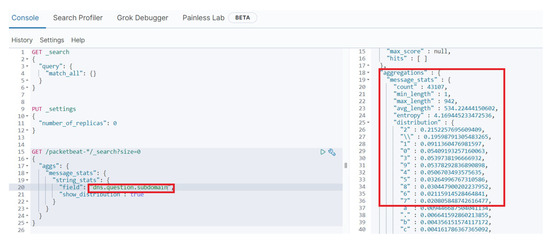
Figure 29.
Character frequency probability visibility shown in the Kibana visualisation dashboard.
Another important feature is the length of the DNS queries, which in turn shows the number of characters (bytes) in the subdomains and can be used to detect DNS tunnelling and exfiltration activities. It is important to note that the encoding method (base64 or base16) greatly impacts the amount of exfiltrated data. Base16 encoding can exfiltrate half bytes of data (per ASCII character), whereas base64 exfiltrates 0.75 bytes of data per ASCII character in the subdomains. Both encoding methods utilised for data exfiltration result in longer query length. Therefore, the length of the subdomains employed in the exfiltration of data is an important indicator. Figure 310 shows the query length for the ns.slehee.uk subdomain, which was setup for the DNS tunnelling experiment, and the average subdomain length for all queries. The query length was 122 characters with an average subdomain length of 46, indicating a high standard deviation which is an indicator of an anomalous DNS query. In another words, the length of malicious query (used for data exfiltration) was more than double the length of average queries over the last seven days of the experiment.
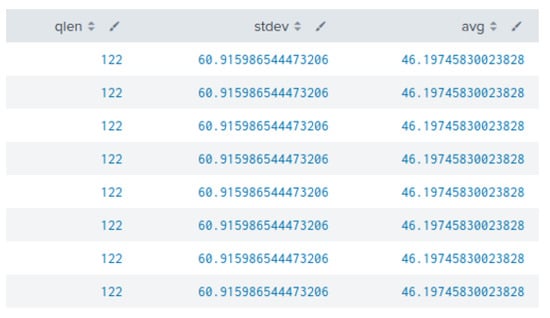
Figure 310. First column shows the DNS query length for the ns.slehee.uk subdomain. The second column shows the standard deviation between the elements of the first and second columns. The third column lists the query length averaged over the last seven days.
2. DNS Record Type Analysis
The next DNS tunnelling detection strategy is based on analysing DNS record types. This monitoring technique can be effective as there are only a few DNS record types that are used for DNS tunnelling. Figure 411 illustrates record types in the DNS queries. Iodine utilises the null record for data exfiltration via a DNS tunnel. Each DNS reply can contain over a kilobyte of compressed payload data. The significant percentage of null requests shown in the bar chart represents the Iodine DNS tunnelling activities. Another important point to consider is that the null record was deprecated by RFC1035. Therefore, a significant proportion of null queries is a strong indication of malicious DNS exploitation.
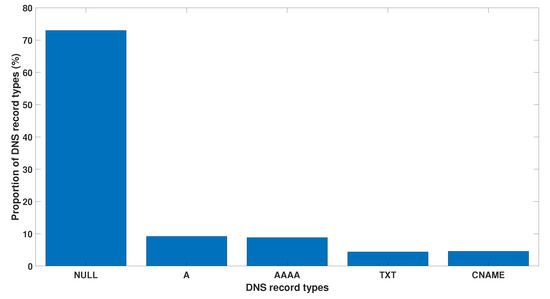
Figure 411.
Proportion (%) of the different record types in the DNS queries.
3. DNS Signature Analysis
Another popular detection method is based on analysing the DNS signature, which can be used to review specific attributes in the DNS header and DNS payload content [4][12]. The authors in [6][16] demonstrated a detailed signature analysis in which the DNS response packet from null records was exported and saved as a binary file by using Wireshark, as shown in Figure 512. The binary file was then analysed by using the Neo Hex Editor and detection was implemented by using Snort rules, for instance the Snort rule to identify malicious network activity is SID-1-27046 (https://www.snort.org/rule_docs/1-27046) (accessed on 20 March 2021), which is based on the Iodine DNS tunnelling handshake server ACK. Analysis of the collected null record using Wireshark is shown in Figure 512.
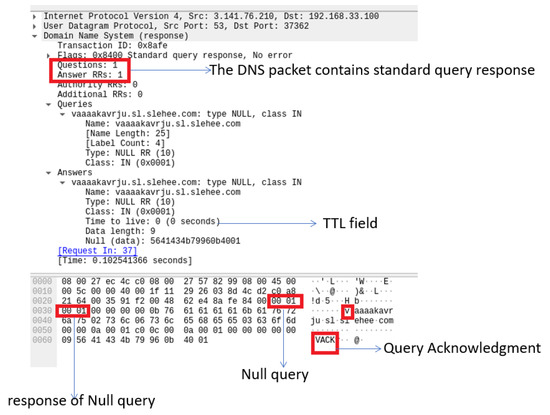
Figure 512. Handshake (ACK) between Iodine DNS tunnelling server (attacker) and the victim. Analysis via Wireshark shows the DNS response packet from Null record exported and saved as a binary. The figure also shows the TTL field in the DNS query response.
Another important feature of DNS data is time-to-live (TTL), which describes how long a DNS response for a domain should be cached and can be used for detection of DNS tunnelling. The recursive resolvers usually cache the information so instead of retrieving them again from the authoritative server, can simply reply with the cached record. The duration that the DNS record is required to be kept in the cache of a DNS server is referred to as TTL, which for a normal DNS record is mostly greater than 300 s. Hence, DNS data with a TTL value close to zero may indicate DNS tunnelling activity as a malicious user can use this approach to avoid DNS detection and blacklisting. Figure 512 shows that the DNS signature has content matches all highlighted in red, where the hex value 0x0001 indicates a null record and the TTL value of zero indicates no time for the intermediate cache, which points to the existence of DNS tunnelling [7][8][24,32].
The Suricata open-source intrusion detection and prevention system (IPDS) can also be used in the cloud environment for creating rules to identify a DNS tunnelling attack. Figure 613 shows the Suricata alerts during DNS exfiltration with Iodine in ELK-stack. The Suricata IDPS can be combined with other alert rules such as suspicious null request. Similarly, other alerts can be created to detect increased TXT records. Moreover, the detection success can be increased by taking advantage of the Elastic stack SIEM, where new rules can be created alongside the 400 default rules.
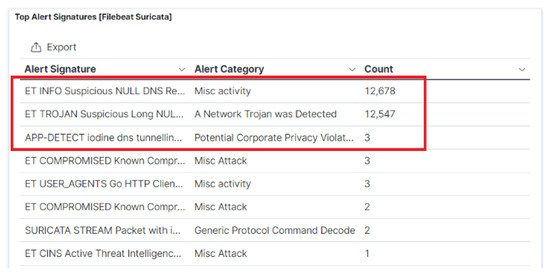
Figure 613.
Suricata alerts in the Elastic stack during DNS exfiltration with Iodine.
4. DNS Traffic Volume and Time Analysis
An effective strategy for traffic analysis is based on the fact that limited data can be exfiltrated in a DNS tunnel. Therefore, an increase in volume of DNS traffic over time may indicate malicious DNS activity. This strategy will be effective for networks with expectations of a lower number of DNS queries. Figure 714 shows high DNS traffic that was captured from the cloud environment experiments. However, in networks with a high volume of DNS traffic, this method will most likely give false positive results. Therefore, in the case of networks where the number of DNS queries is expected to be low, a high volume of DNS traffic may indicate DNS tunnelling activity.
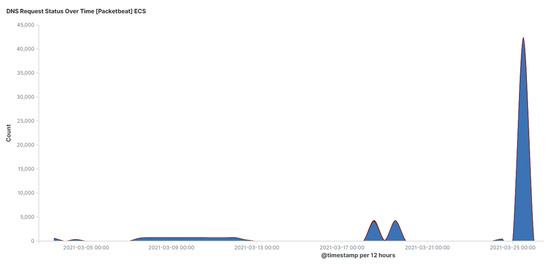
Figure 714.
DNS traffic request volume over time.
Another detection strategy is based on a given domain (suspicious domain) with multiple subdomains [4][12], where a suspicious domain with multiple subdomains can be a strong indicator of DNS tunnelling. In this study the ss or sl and ns subdomains are short, and a large amount of data was ingested in each of the subdomains. During the exfiltration, the client–server communication was hidden in the domain or subdomain names and, as result, a large number of new unique subdomains were generated. Figure 815 shows a significant number of subdomains for slehee.com and slehee.uk. In addition, the right-hand side table in Figure 815 shows a large number of bytes that are generated from DNS queries and responses (bytes in and out). This demonstrates the presence of malicious activities.
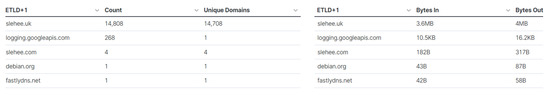
Figure 815.
Unique subdomains per domain shown in the Kibana visualisation dashboard.
Another interesting observation for exfiltrated traffic via DNS is a higher time interval between consecutive pairs of queries and responses. This can be seen from Figure 916 where the average response time during exfiltration is approximately 70 ms (shown using green colour). The average response time for normal DNS traffic is approximately 20 ms [8][32]. Therefore, a higher than normal average response time is a strong indication of DNS tunnelling activities.
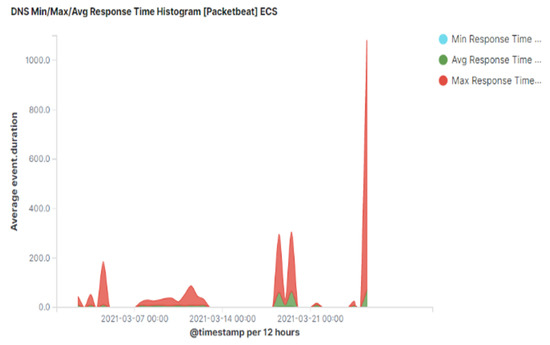
Figure 916.
Average time interval between DNS query and response.