As is general knowledge, the situation of the Amazon Basin has been strongly affected in recent decades. Mass deforestation in order to expand livestock borders, illicit use of timber species and oil exploitation, produced serious environmental impacts. Half of the national territory of Ecuador is part of this Amazonian macro-basin, so these problems have undergone in the area. The Amazonian Ecuador in particular, is a territory where the capacity of the soils and the ecosystems to provide services have been weakening for all the described circumstances. But from our scientific and academic point of view it seems important to contribute to the well-being and good living of the Amazonian population by the implementation of sustainable production systems. The researching perspective must focus to offer objective indicators that can be useful for management, referring to the dynamic balance between society and nature. In the dimensions addressing the socio environmental aspects, the Soil Quality Indicators have revealed to be very useful. They give information that can influence decision-making and territorial planning at the farm level. Other data and information can be summarized in graphical representations called Biogram and synthetic indices as the Integrated Index of Sustainable Development. All these are affordable and sustainable and realistic proposals.
- Ecuadorian Amazon
- Sustainability Indicators
- Territorial Sustainability
- Territorial Sustainability Indicators
1. Situation of the Ecuadorian Amazon Territory
In Ecuador, the expansion of the agricultural frontier and deforestation for livestock purposes involves intervention and destruction of natural forests and virgin forests, causing socio-environmental impacts in the Amazon Region, in which 52% of land is forests and 17.5% of the area is used for agricultural activity [1]. With the emergence of livestock as a source of income for the population [2], a variety of perennial and annual pastures have been established as monocultures that are part of livestock systems adapted to the conditions of the region. These affect the Amazonian soils, because more than 50% of the livestock areas are in the process of degradation, with a break in the water balance of the basins and an increase in greenhouse gases [1][3][4]. Similar results have been reported for other tropical regions because of livestock and agricultural intensification [5].
The damage caused to the ground after deforestation varies according to the use that occurs later [3]. Converting deforested spaces into areas of agroforestry arrangement with tree species (coffee, cocoa, rubber) that represent management practices aligned with the potential use of the region means minimal damage to the soil [3][6]. The conditions of a natural forest are reproduced in terms of the interception of the drops, decrease in runoff, litter deposition, and control of the water erosion process. In contrast, the danger of erosion by crops, whether annual or perennial, is very significant at the beginning of the cycle, when the soil is left unprotected from its cover. In this sense, silvopastoral systems play a multifunctional role. Their adoption implies favorable changes in various components and agroecological processes [7]. The coverage offered by tree and litter species can activate soil biology, increase the level of OM, improve fertility and its optimization [6]. In addition, they can reduce soil degradation processes, such as water erosion, compaction, or waterlogging [3].
Based on the aforementioned factors, it is necessary to determine variables that contribute to improving soil quality and avoiding degradation processes from a systematic view, considering the soil resource as a fundamental component of farm-level production [3], with the implementation of sustainable or less aggressive management practices with the environment [8]. In this sense, the need arises to develop indices and indicators that measure, spatially and temporarily, the sustainability of a territory, and through permanent monitoring, encourage adequate and precise management of natural resources [9]. One of the main resources is land, which requires rational management through agricultural policies and practices aimed at forming sustainable agricultural systems [8].
The greater the knowledge of the wealth of resources, cultural diversity, and ecosystems that make up the Amazonian territory, the more the state will be a correct administration [3]. To meet the needs of the current population and improve their quality of life, economic, ecological, and social sustainability are required. Economic sustainability implies taking charge of global costs, such as the reproduction of nature and benefits, including the integral management of ecosystems. Ecological sustainability refers to the use of the natural system in an integral way, within the restrictions and potential of its homeostatic mechanisms. Social sustainability means a social orientation of production that uses and respects the identity of cultures and promotes the broadest participation of society in fundamental development decisions [10].
2. From Environmental Indicators to Sustainability Indicators
2.1. Environmental Indicators
According to the Organization for Economic Cooperation and Development (OECD), an Environmental Indicator is a variable that has been socially endowed with an added meaning derived from its own scientific configuration, in order to synthetically reflect a social concern, with respect to the environment, and insert it coherently in the decision-making process [11]. Environmental management and investment that is oriented towards the sustainable use, research, conservation, mitigation, and restoration of natural resources involve various topics, such as habits, anthropic modes of production and consumption, demand and use of natural resources, generation and use of solid and liquid waste, use of technologies and types of energy in the production of goods and services, and problems with pollutants that are part of climate change.
In Ecuador, the territorial approach of the current “National Development Plan 2017–2021” has tried to approach the reality of the value of environmental damage and the economy for social and environmental improvement [12]. The plan stipulates that Ecuador will fully assume the protection and guarantee of the rights of nature, responsible management of natural resources, protection of biodiversity and soil, and implementation of responses to climate change, which guarantees the good living of rural communities [12].
However, in the Ecuadorian Amazon, the application of sustainable territorial development policies and strategies has not advanced as expected [3]. The appropriation and mismanagement of natural resources is not the same in all communities, nor is the degree of impact due to environmental impacts; hence, ecological-distributive conflicts and environmental injustices arise [13]. These conflicts are valued in different languages. For example, affected communities may request internalization of externalities and monetary compensation, arguing that the natural environment has great ecological, landscape, and sacred value, or that resources are excluded from the market by international provisions that protect indigenous groups and nationalities. The point is that the monetary dimension is the key point in any dialogue or conflict that involves interests of large companies in natural areas of interest [13].
2.2. Sustainability Indicators
Sustainability indicators arise by expanding the role of environmental indicators, integrating the four dimensions associated with the concept of sustainable development [14].
The economic indicator refers to the physical and objective basis of the process of growth and maintenance of the stock of natural resources incorporated into productive activities, setting criteria for renewable natural resources, for which the utilization rate should be equivalent to that of resource recomposition. For non-renewable natural resources, the utilization rate must be equivalent to the replacement of the resource in the production process based on the time planned for its depletion.
The environmental indicator is related to the ability of nature to absorb and recompose to anthropogenic aggressions, making use of the above reasoning, where the rates of waste emission as a result of economic activity must equal those of regeneration, which are determined for the resilience of an ecosystem.
The social objective is to improve the quality of life of the population in countries with serious problems of inequality and social exclusion. The basic criteria should be: distributive justice, in the case of distribution of goods and services; and the universalization of coverage for global education, health, housing, and social security policies.
The policy is linked to the process of building citizenship and seeks to incorporate the population into the process of development and decision-making.
From the Ecological Economy [15], the concepts of weak sustainability and strong sustainability have been defined according to the assessment of ecological damage and resource depletion [13]. The sustainability indicators that are explained below correspond to them.
- Monetary Indicators of Territorial Sustainability or Weak Indicators
Monetary indicators of territorial sustainability evaluate the percentage of income and expenses that could be considered true income and loss of assets, respectively, from the sale and acquisition of products that meet the needs of a region, with the aim of reaching agreed monetary valuations of amortization of natural resources and environmental services [16][17]. They include [16][10]:
- The gross domestic product (GDP) green, which indicates economic growth, taking into account environmental consequences;
- The GDP ecologically corrected, which takes into account the valuation of non-renewable reserves. In the case of an exhaustion of the resource, there is a replacement of the natural capital;
- The Sustainable Economic Welfare Index (IBES), which corrects conventional measures of private final consumption (expenditure), considering social and environmental factors;
- The Patrimonial Accounts, which exist in order to include environmental variables in the production matrix.
These indicators do not contemplate some issues, such as irreversible damage to the environmental system and its accumulation, alterations of natural resource reserves, the diversity of units in the environmental system, and arbitrary monetary valuations [15].
- Biophysical Sustainability Indicators or Strong Indicators
Biophysical sustainability indicators are oriented to evaluate the impact of socio-economic activity on the environment. For this type of indicator, it is not easy to compare situations. Their objective is didactic, not research, and the information on how to calculate them is restricted [16]. Some of them are [17]:
- Ecological backpack, which indicates efficiency in the use of matter and energy per unit of product. Its purpose is to assess whether there is a dematerialization of the economy over time;
- The ecological footprint, which allows the estimation of the environmental deficit of a given territory, highlighting the impact that a human group has on ecosystems in relation to resource consumption and waste generation. This measure reports the dependence of a community on the functioning (productivity) of ecosystems, regardless of whether it is outside their domain. It allows the monitoring of the impact of human actions, and it should be noted that the agglomeration (cities) demonstrates the dependence on ecosystems and the environment [13];
- The environmental space, which refers to the quantity and availability of renewable and non-renewable natural resources in relation to the levels of contamination allowed without harming future generations’ use of natural resources.
On a global level, the practical utility of these indicators in decision-making is limited. However, at the national, regional, or local level, they serve as instruments that can contribute to environmental planning and management [17].
3. Territorial Sustainability Indicators: Participatory Selection
The term “socio-environmental sustainability” refers to a dynamic balance between society and nature, as a result of a set of actions carried out with an integral vision of development processes. Part of the context and reality that it considers is the importance of not neglecting history, needs, conflicts, and potentialities. By analyzing the meaning of socio-environmental sustainability, it enables the creation of relationships within and between local communities, projecting an equitable use of resources in the short, medium, and long term [18], as well as the conservation of biodiversity, along with the participation of social actors. Within this context, territorial indicators allow the articulation of sustainability objectives and provide information on the state of the society–nature relationship. Its importance is based on the fact that it is formulated in a unique and unrepeatable context at a social, administrative, and territorial level. The information and relationships established between selected variables will be driven by local managers [15]. The criteria to consider for the design of indicators are [17]:
- Political relevance, indicating aspects of collective interest and that are easily executed as concrete public actions;
- Feasibility that the analysis, collection, and processing is within reach of the community;
- Ease of interpretation; previous knowledge on the part of the actors to be understood and direct; the greater the value, the greater the sustainability;
- Validity; effectiveness of the purposes;
- Consistency with direct or indirect measurement (reality), without variations in time and space;
- Comparability; allowing decisions, differentiating situations, and establishing typologies;
- Synthetic, robust, or integrative; holistic as a parameter, inclusive in a small number of 59 reasonably added variables, with the possibility of disaggregation at local levels;
- Systemic; capable of integrating into a social monitoring system;
- Participatory; the allowance of the indicator to be involved in its own definition, analysis, and interpretation;
- Visionary or predictive; able to relate what is measured with community values, about a desirable future.
Any sustainability requirement is translated into an indicator [14][19]. Among the indicators proposed for the socio-environmental dimension and territorial sustainability, due to the impact of the establishment of productive activities that involve change of use and sustainable management of the soil, the Land Quality Indicators stand out [20]. The development and use of these indicators can influence the decision-making and planning of territorial development at the farm level or production units, to avoid the possibility that the rehabilitation of soil quality at a regional level does not show positive results. In this, the participatory selection of indicators is applied [3][20]. Soil quality is an integral part of achieving sustainable agriculture [21].
In the Amazon region, this perspective is intended to curb the impacts produced locally by deforestation, as a result of agricultural and livestock practices that expand day by day and influence the ability of soils to offer food security for rural populations [22]. Therefore, the proposed edaphological indicators are adapted to local needs. An example of the evaluation of sustainability using the methodology of participatory selection of indicators in production units according to four dimensions is summarized in Table A1 of the Appendix A. The example corresponds to the case of the Ecuadorian Amazon [1], and includes economic, cultural, and political aspects, since agricultural production also depends on them.
Direct measurements and observations of morphological parameters at the field level are a very useful tool. They allow an understanding of the operation and performance of the soil in the natural environment, and how it is affected by human intervention [1][23]. At the same time, they allow tracking or monitoring. Several authors [1][24][25] have selected the following: the morphology of the soil with observable attributes in the field (in surface or in the profile), the conditions of the environment, the behavior and development of the plants, and the response of the soil to management practices or changes in the use of the earth. The attributes described above include composition, soil structure, soil organization, color, root distribution, porosity, evidence of carbonates and iron, and clay and soil consistency. Other authors also proposed texture as an observable attribute in the field [3][26][27], as the OM content is based on the amount of litter and fresh and decomposing plant debris. This pair of parameters contributes in large proportions to the availability of nutrients and good physical and biological condition. Another main ecosystem service is the carbon storage potential [3]. In addition, it has been corroborated that the scores generated by the visual method in the field maintain a close relationship with those obtained in the laboratory based on quality indicators.
4. Accessible Space–Time Representations. Biography and Integrated Sustainable Development Index
For decision-making regarding sustainable territorial development, all types of information, data, experiences, or knowledge are raised from the highest level (national level) to the community and individual levels. A trend analysis is the best option obtain a (future) view of certain variables and indicators. Indicators that focus on sustainable development, and that contribute to self-regulated sustainability, serve as a solid basis for decision-making at each level [9], giving way to the development of an instrument of didactic work. Through an image, the degree of sustainable development of an area or unit of analysis (territory where strategies, policies, and investments will be implemented) can be represented and estimated, symbolizing the state of sustainability. An instrument called Biogram consists of a web image and the integrated sustainable development index.
The Biogram is a representation of a multidimensional diagram and indexes. It represents the performance of the unit of analysis, through the use of selected indicators, which allow overestimation or underestimation of the degree (development status) of sustainable development [9], on a chart. At the same time, it makes it possible to carry out a comparative analysis between the different dimensions and the possible existing conflicts. It results from the complement between the graph and the integrated sustainable development index, which allow for a quantification of the performance of the unit of analysis. To understand the information easily, the methodology standardizes or transforms the value of the indicators to a common scale (between 0 and 1), facilitating comparative analysis. In the spider web image (Figure 1a), each radius (axis) represents a calculation indicator. By methodological definition, the value of each indicator will vary between 0 and 1, with the minimum and maximum performance, respectively. Therefore, the greater the shaded area, the greater the performance of the unit of analysis.
|
(a) (b) |
|
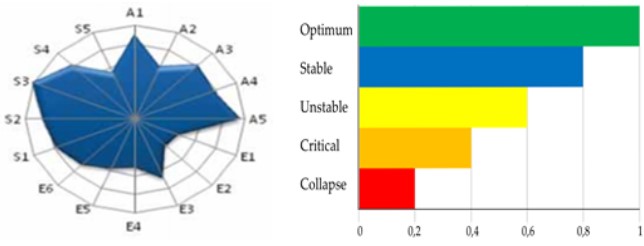
Figure 1. (a) Biogram and (b) system status representation, based on [9].
The graphic representation provides knowledge on the individual performance of each dimension, showing an approximation of the degree of stability, and at the same time comparing the performance between units. The possibility of identifying the imbalances of an analysis unit in the image allows the location of the dimensions that need new policies or investments to correct the situation [9]. The Biogram uses five colors (Figure 1b) to characterize the state of sustainable development of the analysis units. When the shading red, it is less than 0.2, and it indicates a high probability of system collapse. Levels between 0.2 and 0.4 are represented by an orange color, and indicate a critical situation. Yellow shading, corresponding to levels of 0.4 to 0.6, indicates system instability. Levels between 0.6 and 0.8, shown in blue, represent system stability. The green color, for levels of 0.8 to 1, is the optimal system situation [9].
The methodology, on the one hand, allows for analyzing the evolution of an analysis unit in two moments (different years), and on the other, for comparing the situation of two units for the same moment (different places). One of the advantages of using this methodology is that it adapts to the characteristics of territories based on the needs and peculiarities. From the score of the indicators, information can be obtained on the progress of the proposed objectives (social, economic, environmental, and political). It shows a synthesis of the reality of the territories in a simple but understandable way for the population.
5. Appendix A
An evaluation of socio-environmental sustainability, and a proposal for a demonstration case selected in the Ecuadorian Amazon [1], with the indicators applied, are summarized in Table A1. The study concludes that, at the level of production units, each dimension presents critical levels, but with more economic and political limitations. According to the authors, the indicators that should be improved are the number of agroecological practices, crop diversification, productive diversification, management capacity, production level, net income, input costs, labor cost, marketing strategies, marketing strategy savings, production financing, institutional support, and state programs related to production units.
Table A1. Sustainability evaluation through indicators in production units of the Province of Napo, Ecuadorian Amazonia, based on [1].
|
Indicators Applied to the Production Units (UP) with Their Respective Score Level, in the Province of Napo, Ecuador |
||
|
Dimension |
Indicators |
Optimum Level |
|
Environmental |
Number of agroecological practices used |
At least five must be agroecological, with ecological principles, such as association of crops, polycultures, cover, silvopastoral, and agroforestry systems |
|
Crop diversification |
At least four types of crops |
|
|
Productive diversification |
At least four productive activities |
|
|
Integral fertility: |
|
|
|
- Texture |
Franco, clay loam |
|
|
- Soil structure |
Granular |
|
|
- Soil color |
Dark brown or black |
|
|
- Apparent density |
Less than 1.2 Mg·m−3 |
|
|
- Total porosity |
Greater than 50% |
|
|
- pH |
5.5 to 7 |
|
|
- Organic material (%) |
Greater than 3% |
|
|
- Nutrient availability (N, P, K, Ca, Mg) |
Medium to high content |
|
|
- Biological activity |
Abundant (wildlife is displayed on the ground) |
|
|
- Presence of erosion |
Protected soil, without cracking |
|
|
Socio-cultural |
Number of people incorporated to the UP |
All family members have active participation |
|
Workforce |
At least 60% are familiar |
|
|
Task Distribution |
Agreements are distributed equally |
|
|
Organization and management capacity |
The UP is able to solve internal problems, keeps track of expenses, production and sales |
|
|
UP external administrative unit |
Low, based on self-management |
|
|
Sense of belonging to the UP |
High |
|
|
Acceptance of new practices |
Willing to agroecological practices |
|
|
Waste disposal, recycling |
Focusses on a specific area, apply recycling |
|
|
Time of dedication to the UP |
More than 60% |
|
|
Economic |
UP production level |
Self-supply and sale of surplus |
|
Acceptance of products (quality, price) |
High |
|
|
Monthly net income in the UP |
More than four minimum wages |
|
|
Agricultural input costs |
70% of inputs are produced in the UP |
|
|
Labor costs |
70% are members of the UP |
|
|
Marketing strategies |
It has at least two strategies that give added value to the product |
|
|
Savings strategy |
At least one strategy for eventualities |
|
|
Production financing |
The unit is self-financing |
|
|
Politics |
State programs related to the UP (Chakra, livestock) |
More than three programs associated with the UP |
|
Acceptance level of state programs |
At least apply two programs or benefit from one |
|
|
Institutional support to the UP |
At least three institutions supporting the UP |
|
|
Development of new skills and knowledge for productive work in the UP |
All members have acquired new skills and knowledge, through courses and practical process workshops |
|
|
Level of participation or governance and associativity |
UP members attend calls, technical tables, workshops, there is a predisposition |
|
References
- Bravo, Carlos; Marín, Haideé; Marrero, Pablo; Ruiz, María; Torres, Bolier; Navarrete, Henry; Durazno, Galo; Changoluisa, Daisy; Evaluación de la sustentabilidad mediante indicadores en unidades de producción de la provincia de Napo, Amazonia Ecuatoriana. Bioagro 2017, 29, 23-36.
- Torres, B.; Starnfeld, F.; Vargas, J.C.; Ramm, G.; Chapalbay, R.; Rios, M.; Gómez, A.; Torricelli, Y.; Jurrius, I.;Tapia, A.; et al. Gobernanza Participativa en la Amazonía del Ecuador: Recursos Naturales y Desarrollo Sostenible;Manthra: Quito, Ecuador, 2014
- Bravo, Carlos; Benítez, Diócledes; Vargas Burgos, Julio; Alemán, Reinaldo; Torres, Bolier; Marín, Haideé; Caracterización socio-ambiental de unidades de producción agropecuaria en la Región Amazónica Ecuatoriana: Caso Pastaza y Napo. Revista Amazónica Ciencia y Tecnología 2015, 4, 3-31.
- Vargas-Burgos, Julio Cesar; Benítez, Diócledes; Ríos, Sandra; Torres, Alexandra; Navarrete, Henry; Andino, Marco; Quinteros, Roberto; Ordenamiento de razas bovinas en los ecosistemas amazónicos. Estudio de caso provincia Pastaza.. Revista Amazónica Ciencia y Tecnología 2013, 2, 133-146.
- Ramachandran-Nair, P.K.; Mohan-Kumar, B.; Nair, V.D.; Agroforestry as a strategy for carbon sequestration. Journal of plant nutrition and soil science 2009, 172, 10-23.
- Nieto, Carlos; Caicedo, Carlos; Análisis reflexivo sobre el desarrollo agropecuario sostenible en la Amazonía Ecuatoriana, INIAP – EECA.. Iniap 2012, 24-50, 102.
- Altieri, Miguel A.; Nicholls, Clara Inés; Agroecología y resiliencia al cambio climatico: Principios y consideraciones metodológicas. Agroecología 8 2013, 8, 7-20.
- Cañizares-Gonzales, R. Potencial para el Secuestro de Carbono y la protección de la biodiversidad bacterianade prácticas agrícolas sostenibles en suelos de Olivar. In Diseño y Aplicación de Tecnologías “Ómicas”;Universidad de Granada: Granada, España, 2011.
- Sepúlveda, Sergio; Chavarría, Hugo; Rojas, Patricia. Metodología para estimar el nivel de Dsarrollo Sostenible en los territorios rurales (El Biograma); San José: Costa Rica, 2008; pp. 109.
- Sejenovich, H. Manual de Cuentas Patrimoniales; Programa de las Naciones Unidas para el Medio Ambiente:Nairobi, Kenya, 1996; p. 234.
- Sancho-Perez, Amparo; Garcia-Mesanat, Gregorio; What does an indicator indicate? Comparative analysis in tourist destinations. Tourist Analysis Magazine 2006, 2, 69-85, 10.1234/RAT2011N11.
- SENPLADES. Plan Nacional de Desarrollo 2017–2021-Toda una Vida; SENPLADES: Quito, Ecuador, 2017.
- Martínez-Alier, Joan; Los conflictos ecológicos-distributivos y los indicadores de Sustentabilidad. Polis, Revista Latinoamericana 2006, 13, 21-30.
- Guimarães, Roberto; Tierra de sombras: desafíos de la sustentabilidad y del desarrollo territorial y local ante la globalización corporativa. Serie Medio Ambiente y Desarrollo 2003, 67, 62.
- Rueda, S. Metabolismo y Complejidad del Sistema Urbano a la Luz de la Ecologia; Ciudades Para un Futuro MasSostenible: Madrid, Spain, 1997.
- Achkar, M. Indicadores de Sustentabilidad [Sustainability Indexes]; Ordenamiento Ambiental del Territorial[Environmental Planning Territorial]: México city, Mexico, 2005; pp. 55–70.
- Rossi, E. Indicadores Territoriales de Sustentabilidad Socio-Ambiental Aplicados al Turismo, Tesis de Maestría;Universidad Nacional de Mar del Plata: Mar del Plata, Argentina, 2015.
- Hernández-Hernández, Mary Rosa; Morros, María Elena; Bravo-Medina, Carlos Alfredo; Pérez, Zenaida; Herrera-Díaz, Pablo Emilio; Ojeda-Hernández, Adriana; Morales, Jimmy; Birbe-Fernández, Beatríz Omaira; La integración del conocimiento local y científico en el manejo sostenible de suelos en agroecosistemas de sabanas. Interciencia 2011, 36, 104-112.
- Sarandón, Santiago J.; El desarrollo y uso de indicadores para evaluar la sustentabilidad de los agroecosistemas. Agroecología: El camino para una agricultura sustentable 2002, 20, 393-414.
- Reardón, Juan Alberto; Alemán-Perez, Reinaldo; Agroecology and the development of indicators of food sovereignty in Cuban food systems. Sustainable Agriculture 2010, 34, 907-922, 10.1080/10440046.2010.519205.
- Izquierdo, I.; Caravaca, F.; Alguacil, M. M.; Roldan, A.; Changes in Physical and Biological Soil Quality Indicators in a Tropical Crop System (Havana, Cuba) in Response to Different Agroecological Management Practices. Environmental Management 2003, 32, 639-645, 10.1007/s00267-003-3034-2.
- Astier-Calderón, Marta; Maass-Moreno, Manuel; Etchevers-Barra, Jorge; Derivación de indicadores de calidad de suelos en el contexto de la agricultura sustentable derivation of soil quality indicators in the context of sustainable agriculture. Agrociencia 2002, 36, 605-620.
- Raiesi, Fayez; Beheshti, Ali; Microbiological indicators of soil quality and degradation following conversion of native forests to continuous croplands. Ecological Indicators 2015, 50, 173-185, 10.1016/j.ecolind.2014.11.008.
- Pulido Moncada, Mansonia; Gabriels, Donald; Lobo, Deyanira; Rey, Juan Carlos; Cornelis, Wim M.; Visual field assessment of soil structural quality in tropical soils. Soil and Tillage Research 2014, 139, 8-18, 10.1016/j.still.2014.01.002.
- Casanova, E. Introducción a la Ciencia del Suelo; Universidad Central de Venezuela: Caracas, Venezuela, 2005.
- Power, Alison G.; Ecosystem services and agriculture: Tradeoffs and synergies. Philosophical Transactions of the Royal Society B: Biological Sciences 2010, 365, 2959-2971, 10.1098/rstb.2010.0143.
- Viana, Raiane M.; Ferraz, João B.S.; Neves, Afrânio F.; Vieira, Gil; Pereira, Bruno F.F.; Soil quality indicators for different restoration stages on Amazon rainforest. Soil and Tillage Research 2014, 140, 1-7, 10.1016/j.still.2014.01.005.