Your browser does not fully support modern features. Please upgrade for a smoother experience.
Please note this is a comparison between Version 1 by Vasile Palade and Version 2 by Sirius Huang.
The upsurge of autonomous vehicles in the automobile industry will lead to better driving experiences while also enabling the users to solve challenging navigation problems. Reaching such capabilities will require significant technological attention and the flawless execution of various complex tasks, one of which is ensuring robust localization and mapping. Herein, a discussion of the contemporary methods of extracting relevant features from equipped sensors and their categorization as semantic, non-semantic, and deep learning methods is presented. Representativeness, low cost, and accessibility are crucial constraints in the choice of the methods to be adopted for localization and mapping tasks.
- autonomous driving
- feature extraction
- mapping
- localization
- automotive security
1. Introduction
In the last decade, self-driving vehicles have shown impressive progress, with many researchers working in different laboratories and companies and experimenting in various environmental scenarios. Some of the questions in the minds of potential users relate to the advantages that are offered by this technology and whether we can rely on it or not. To respond to these questions, one needs to look at the numbers of accidents and deaths registered daily from non-autonomous vehicles. According to the World Health Organization’s official website, approximately 1.3 million people, mainly children and young adults, die yearly in vehicle crashes. Most of these accidents (93%) are known to occur in low- and middle-income countries [1]. Human behaviors, including traffic offenses, driving while under the influence of alcohol or psychoactive substances, and late reactions, are the major causes of crashes. Consequently, self-driving technology has been conceived and developed to replace human–vehicle interaction. Despite some of the challenges of self-driving vehicles, the surveys in [2] indicate that about 84.4% of people are in favor of using self-driving vehicles in the future. Sale statistics also show that the worth of these vehicles was USD 54 billion in 2021 [3]. This outcome demonstrates the growing confidence in the usage of this technology. It has also been suggested that this technology is capable of reducing pollution, energy, time consumption, and accident rates, while also ensuring the safety and comfort of its users [4].
The Society of Automotive Engineers (SAE) divides the technical revolution resulting from this technology into five levels. The first two levels do not provide many automatic services and, therefore, have a low risk potential. The challenge starts from level three, where the system is prepared to avoid collisions and has assisted steering, braking, etc. Moreover, humans must be prudent with respect to any hard decision or alert from the system. Levels four and five refer to vehicles that are required to take responsibility for driving without any human interaction. Hence, these levels are more complex, especially if one considers how dynamic and unpredictable the environment can be, where there may be a chance of collision from anywhere. Ref. [4] affirms that no vehicle has achieved robust results in these levels at the time of writing this paper.
Creating a self-driving vehicle is a complicated task, where it is necessary to perform predefined steps consistently and achieve the stated goals in a robust manner. The principal question that should be answered is: how can vehicles work effectively without human interaction? Vehicles need to continuously sense the environment; hence, they should be equipped with accurate sensors, like Global Navigation Satellite System (GNSS), Inertial Measurement Unit (IMU), wheel odometry, LiDAR, radar, cameras, etc. Moreover, a high-performance computer is needed to handle the immense volume of data collected and accurately extract relevant information. This information helps the vehicles make better decisions and execute them using specific units prepared for this purpose.
To achieve autonomous driving, Ref. [5] proposed an architecture that combines localization, perception, planning, control, and system management. Localization is deemed an indispensable step in the operation autonomous systems since we need accurate information of its location. Figure 1 illustrates the importance of localization and mapping steps in the deployment of other self-driving tasks, like path planning (e.g., finding the shortest path to a certain destination), ensuring reliable communications with other AVs, and performing necessary tasks at the right moment, such as overtaking vehicles, breaking, or accelerating. A small localization error can lead to significant issues, like traffic perturbation, collisions, accidents, etc.
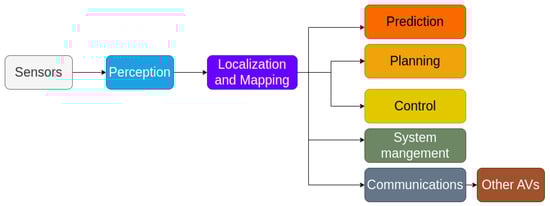
Figure 1.
Steps to follow to achieve a self-driving vehicle.
2. Feature Extraction
Feature extraction is the process of providing a relevant representation of the raw data. In other words, it is manipulating the data to be easy to learn while being more robust to generalize. It is the same here with sensors’ data. Extracting suitable information is very useful, and it will reduce cost, energy and aid the models to be fast and accurate in the execution. This section gives an overview of what was done previously in the area. The discussions focus on two sensors, namely, LiDAR and cameras, because researchers believe that they are more suitable and useful in practice. Figure 2 provides a clear flowchart to understand these features.
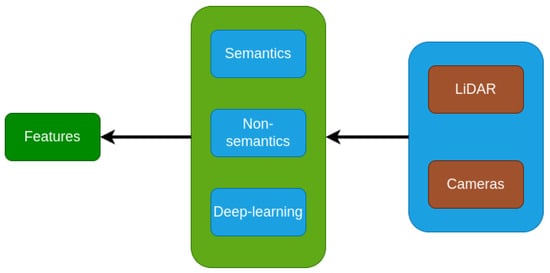
Figure 2.
Flowchart of feature extraction.
2.1. Semantic Features
Semantic features essentially deals with extracting a known target (poles, facades, curbs, etc.) from the raw data, in order to localize the vehicle more accurately.
LiDAR features: We can extract lane markings using specialized methods that differentiate lanes from the surrounding environment. These techniques analyze how LiDAR beams reflect off surfaces and consider variations in elevation to accurately separate lane boundaries. In [6][21], authors extract lane marking as a feature to localize the vehicle by using the Radon transform to approximate polylines of the lane. Then, they have applied the Douglas-Peukers algorithm to refine the shape points that estimate the road center lines. In the work carried out by Im et al. [7][22], attempts were made to detect two kinds of features. The first category was produced using LiDAR reflectivity from layer 17 to 32 to extract road marking. Indeed, a binarization layer was applied on the extracted ground plane. This binarization is done by using the Otsu thresholding method [8][23]. Finally, they used the Hough transform to infer road marking lines. On the other hand, the second category focuses on the extraction of the building walls because they resemble lines in the 2D horizontal plane. So, they have projected all these features into a 2D probabilistic map. However, the existence of the poles like street trees affects the creation of the map of lines. To solve this problem, unnecessary structures were eliminated by applying the Iterative-End-Point-Fit (IEPF) algorithm. This is considered as one of the most reliable algorithms for line fitting, and it gives the best accuracy in a short calculation time. Zhang et al. [9][24] explored the height of curbs between 10–15 cm, and the smoothness and continuity of points cloud around the curbs to propose a method to track the curbs. This approach is also used in [10][25] with some modifications. The existence of curbs on almost every road could be regarded as very useful. The authors of [11][26] used the combination of information from LiDAR and cameras to extract poles like traffic signs, trees, and street lamps, since they are more representative for localization purposes. The authors projected, in each layer, the point clouds in a 2D grid map after removing the ground plane, and they assumed that the connected grid cell of points, at the same height, is supposed to be a candidate object. To ensure the reliability of this method, they have created a cylinder for each landmark candidate and form the poles’ shapes. From the camera, they attempted to calculate a dense disparity mapping and apply pattern recognition on the result of the map to detect landmarks. Kummerle et al. [12][27] adopts the same idea as [11][26], where they attempted to extract poles and facades from the LiDAR scans. They also detected road marking by a stereo camera. In [13][28], the authors extracted, as the first kind of such features, building facades, traffic poles, and trees, by calculating the variance of each voxel, then, they checked the size of a fixed threshold, and concluded on the closeness of the points. Those voxels are grouped and arranged in the same vertical direction. Hence, each cluster that respects the variance condition in each voxel is considered as a landmark. The second kind is interested in the reflectivity of the ground, which is extracted with the RANSAC algorithm from LiDAR intensity. A performant algorithm to detect poles was proposed in [14][29]. Firstly, a 3D voxel map was applied on the set of points cloud; then, they eliminated cells with fewer points. Thereafter, they determined the cluster’s boundaries by calculating the intensity of points in the pole’s shape candidate to deduce the highest and lowest parts. Finally, they checked if the points clouds in the entire core of the pole candidates did satisfy the density condition to be considered as pole candidates. Ref. [15][30] implemented a method with three steps: voxelization, horizontal clustering, and vertical clustering (voxelization is a preprocessing step). Typically, it is intended to remove the ground plan and regroup each part of the points cloud into voxels; then, pick the voxels with the number of points greater than a fixed threshold. Also, they exploited the pole characteristics in an urban area, like the isolation of the poles, distinguishable from the surrounding area, in order to extract horizontal and vertical features. Ref. [16][31] is an interesting article that provides highly accurate results of detecting pole landmarks. Indeed, the authors have used a 3D probabilistic occupancy grid map based mainly on the Beta distribution applied for each layer. Then, they have calculated the difference between the average occupancy value inside the pole and the maximum occupancy value of the surrounding poles, which is a value between [−1,1]. Greater value means higher probability that it is a pole. A GitHub link for the method was provided in [16][31]. Ref. [17][32] is another method that uses the pole landmarks, providing a high-precision method to localize self-driving vehicles. The method assumed five robust conditions: common urban objects, time-invariant location, time-invariant appearance, viewpoint-invariant observability, and high frequency of occurrence. First, they removed the ground plan using the M-estimator Sample Consensus (MSAC). Secondly, they performed an occupied grid map, which isolates the empty spaces. Afterwards, they performed clustering with the connected component analysis (CCA) to group the connected occupied grid into an object. Finally, PCA was used to infer the position of the poles. The idea is to use the three eigenvalues 𝜆𝑥,𝜆𝑦,𝜆𝑧 obtained in these three conditions (𝑠𝑡ℎ is a fixed threshold).
These conditions formed precisely the dimensions of the poles. The article [18][33] has detected three kinds of features. First, planar features, like walls, building facades, fences, and other planar surfaces. Second, pole features include streetlights, traffic signs, tree trunks. Third, curbs shapes. After removing the ground plan using the Cloth Simulation Filter, the authors have concluded that all landmarks are vertical and higher above the ground plan and contain more points than its surrounding. They filtered cells that do not respect the above conditions. Planar features and curb features are considered as lines that could be approximated by a RANSAC algorithm or running a Hough transform. This research focuses on the use of pole-like structures as essential landmarks for accurate localization of autonomous vehicles in urban and suburban areas. A novel approach is to create a detailed map of the poles, taking into account both geometric and semantic information. Ref. [19][34] improves the localization of autonomous vehicles in urban areas using bollard-like landmarks. A novel approach integrates geometric and semantic data to create detailed maps of bollards using a mask-rank transformation network. The proposed semantic particle filtering improves localization accuracy, validated on the Semantic KITTI dataset. Integrating semantics into maps is essential for robust localization of autonomous vehicles in uncertain urban environments. Ref. [20][35] introduces a novel method for accurate localization of mobile autonomous systems in urban environments, utilizing pole-like objects as landmarks. Range images from 3D LiDAR scans are used for efficient pole extraction, enhancing reliability. The approach stands out for its improved pole extraction, efficient processing, and open-source implementation with a dataset, surpassing existing methods in various environments without requiring GPU support.
Camera features. Due to its low cost, and lightweight, the camera is an important sensor widely used by researchers and automotive companies. Ref. [21][13] divided cameras into 4 principal types: monocular camera, stereo camera, RGB-D camera, and event camera. Extracting features from the camera sensor is another approach that should be investigated. Ref. [22][8] is one of the best works done in visual-based localization, where the authors have given an overall idea about the recent trend in this field; they divide features into local and global features. Local features search to extract precise information from a local region in the image, which is more robust for the generalization task and more stable with image variations. Secondly, global features focus on the extraction of features from the whole image. These features could either be semantical or not. Most researchers working with semantics try to extract contours, line segments, and objects in general. In [23][36], the authors extracted two types of linear features, edges, and ridges by using a Hough transform. Similarly, authors of [24][37] have used a monocular camera to extract lanes’ markings and pedestrian crossing lines. Polylines approximate these features. On the other hand, Ref. [25][38] performed a visual localization using cameras, where they brought out edges from environment scenes as a features/input. Each image input is processed as follows: the first step consists of solving the radial distortion issue, which is the fact that straight lines bend into circular arcs or curves [26][39]. This problem can be solved by the radial distortion correction methods and projective transformation into the bird’s eye view. Moreover, they calculated the gradient magnitude, which creates another image, called gradient image, split into several intersecting regions. After that, a Hough transform is applied to refine the edges of the line segments. Finally, a set of conditions depending on geometric and connectivity of the segment was checked to find the last representation of the edge polylines. Localization of mobile devices was investigated in [27][40] by using features that satisfy some characteristics, such as: permanent (statical), informative (distinguishable from others), widely available. From the features we can derive: alignment tree, autolib station, water fountain, street lights, traffic lights, etc. Reference [28][41] introduced MonoLiG, a pioneering framework for monocular 3D object detection that integrates LiDAR-guided semi-supervised active learning (SSAL). The approach optimizes model development using all data modalities, employing LiDAR to guide the training without inference overhead. The authors utilize a LiDAR teacher, monocular student cross-modal framework for distilling information from unlabeled data, augmented by a noise-based weighting mechanism to handle sensor differences. They propose a sensor consistency-based selection score to choose samples for labeling, which consistently outperforms active learning baselines by up to 17% in labeling cost savings. Extensive experiments on KITTI and Waymo datasets confirm the framework’s effectiveness, achieving top rankings in official benchmarks and outperforming existing active learning approaches.
2.2. Non-Semantics Features
Non-semantics features are unlike the semantics once; they do not have any significance in their contents. They provide an abstract scan without adopting any significant structure like poles, buildings, etc. This gives a more general representation of the environment and reduces execution time instead of searching about a specific element that can not exist everywhere.
LiDAR features. In [29][42], the method consists of four main steps. They started with pre-processing, which aligns each local neighborhood to a local reference frame using Principal Component Analysis (PCA). The smallest principal component is taken as a normal (perpendicular to the surface). Secondly, Pattern Generation is where the remaining local neighborhood points are transformed from 3D into 2D within a grid map; each cell contains the maximum value of reflectivity. Furthermore, the descriptor calculation is performed by the DAISY descriptor, which works by convolving the intensity pattern by a Gaussian kernel. After that, a gradient of intensities is calculated for eight radial orientations. Moreso, a smoothening is performed using Gaussian kernel of three different standard deviations. Finally, a normalization step is applied to maintain the value of the gradients within the descriptor. ’GRAIL’ [29][42] is able to compare the query input with twelve distinctive shapes that can be used as relevant features for localization purposes. Hungar et al. [30][43] used a non-semantical approach where a reduction of the time of execution, by selecting points whose sphere of the local neighborhood with radius r, including an amount of point that will exceed a fixed threshold, was carried out. After that, they distinguish the remaining patterns into curved and non-curved by using k-medoids clustering. The authors use a DBSCAN clustering to aggregate similar groups to infer features. Lastly, the creation of the key features and map features relied on different criteria, including distinctiveness, uniqueness, spatial diversity, tracking stability, persistence. A 6D pose estimation was performed by [31][44], where they describe the vehicle’s roadside and considered it a useful feature for the estimation model. To achieve this, they proposed preprocessing the point cloud through ROI (Region of Interest) filtering in order to remove long-distance background points. After that, a RANSAC algorithm was performed to find the corresponding equation of the road points. Thanks to the Radius Outlier Removal filter, which the authors used to reduce the noise by removing isolated points and reduce their interference. Meanwhile, the shape of the vehicles was approximated with the help of the Euclidean clustering algorithm presented in [32][45]. Charroud et al. [33][34][46,47] have removed the ground plan of all the LiDAR scan to reduce a huge amount of points, and they have used a Fuzzy K-means clustering technique to extract relevant features from the LiDAR scan. An extension of this work [35][48] adds a downsampling method to speed up the calculation process of the Fuzzy K-means algorithm.
Descriptors based methods can be considered an interesting idea since they are widely used to extract meaningful knowledge directly from a set of points’ cloud. These methods do enable a separation of each feature point regarding the perturbation caused by noise and varying density, and the change of the appearance of the local region [36][49]. They also added that four main criteria should be used while performing features description, citing the descriptiveness, robustness, efficiency, and compactness. These criteria involved the reliability, the representativity, the cost of time and the storage space. These descriptors can be used in the points pair-based approach, which is the task of exploiting any relationship between two points like distance or angle between normals (the perpendicular lines to a given object), or boundary to boundary relations, or relations between two lines [37][50]. Briefly, with respect to this methods, one can cite CoSPAIR [38][51], PPFH [39][52], HoPPF [40][53], PPTFH [41][54]. Alternatively, they can be included to extract local features. For example, TOLDI [42][55], BRoPH [36][49], and 3DHoPD [43][56].
Camera features. Extracting non-semantic features from the camera sensor is widely treated in the literature. However, this article focuses on methods that work to find pose estimation. Due to the fastness of the ORB compared to other descriptors like SIFT or SURF, many researchers have adopted this descriptor to represent image features. For this purpose, Ref. [44][57] attempted to extract key features by using an Oriented FAST and rotated BRIEF (ORB) descriptor, to achieve an accurate matching between the extracted map and the original map. Another matching features’ method was proposed in [45][58], where the authors sort to extract holistic features from front view images by using the ORB layer and BRIEF layer descriptor to find a great candidate node, while local features from downward view images were detected using FAST-9, which are fast enough to cope with this operation. Gengyu et al. [46][59] extracted ORB features and converted them to visual words based on the DBoW3 approach [47][48][60,61] used ImageNet-trained Convolutional Neural Networks (CNN) features (more details in the next sub-section) to extract object landmarks from images, as they are considered to be more powerful for localization tasks. Then, they implement Scale-Invariant Feature Transform (SIFT) for further improvement of the features.
2.3. Deep Learning Features
It is worth mentioning the advantage of working with deep learning methods, which try to imitate the working process of the human brain. Deep learning (DL) is widely encountered in various application domains, such as medical, financial, molecular biology, etc. It can be used for different tasks, such as object detection and recognition, segmentation, classification, etc.
LiDAR and/or Camera features.One of the most interesting articles done in this field is [49][11], where the authors provided an overall picture of object detection with LiDAR sensors using deep learning. This survey divides the state-of-art algorithms into three parts: projection-based methods, which project the set of points cloud into a 2D map respecting a specific viewpoint; voxel-based methods, which involve the task of making data more structured and easier to use by discretizing the space into a fixed voxel grid map; finally, point-based methods, which work directly on the set of points’ cloud. The literature investigation concludes that most of the methods are based on the CNN architecture with different modifications in the preprocessing stage.
Categorization of the state-of-art methods that extract relevant features for localization and mapping purposes.
| Paper | Features Type | Concept | Methods | Features-Extracted | Time and Energy Cost | Representativeness | Accessibility | Robustness |
|---|
- Provide the possibility of re-use in other tasks.
| [6][7][21,22], [18][23][33,36], [24][37,38]. |
- Semantic | - General | - Radon transform | |||||
| 10 cm and | 15 cm - RANSAC |
- Curves | - Consume a lot | - High | - Hard | - Passable | ||
| [11][12][26,27], [13][14][28,29], [15][16][30,31], [17][18][32,33], [27][40]. |
- Semantic | - Probabilistic - General |
- Probabilistic Calculation - Voxelisation |
- Building facades - Poles |
- Consume a lot | - Middle | - Hard | - Low |
| [29][30][42,43], [31][33][44,46], [34][35][47,48], [38][39][51,52], [40][41][53,54], [36][42][49,55], [43][44][56,57], [45][46][58,59], [47][60]. |
- Non-Semantic | - General | - PCA - DAISY - Gaussian kernel - K-medoids - K-means - DBSCAN - RANSAC - Radius Outlier Removal filter - ORB - BRIEFFAST-9 |
- The detection system should be capable to extract features even with a few objects in the environment.
| ] |
- The proposed algorithms to extract features should not hurt the system by requiring long execution time.
- One issue that should be taken into consideration is about safe and dangerous features. Each feature must provide a degree of safety (expressed as percentage), which helps to determine the nature of the feature and where they belong to, e.g., belonging to the road is safer than being on the walls.
Table 2.
| [ | ||||||||
| 25 | - Douglas & | Peukers algorithm - Binarization - Hough transform - Iterative-End- Point-Fit (IEPF) - RANSAC |
- Road lanes - lines - ridges Edges - pedestrian crossings lines |
- Consume a lot | - High | - Hard | - Passable | |
| [9][10][24,25], [18][33]. |
- Semantic | - General | - The height of curbs between | |||||
| - All the environment | - Consume less | - High | - Easy | - High | ||||
| [48][50][61,62], [51][52][63,64], [53][54][65,66], [55][56][67,68], [57][58][69,70], [59][60][71,72], [61][62][73,74], [63][64][75,76], [65][66][77,78]. |
- Deep-learning | - Probabilistic - Optimization - General |
- CNN - SVM - Non-Maximum Suppression - Region Proposal Network - Multi Layer Perceptron - Maxpooling - Fast-RCNN - Transfer learning |
- All the environment | - Consume a lot | - High | - Easy | - High |
-
MixedCNN-based Methods: Convolutional Neural Network (CNN) is one of the most common methods used in computer vision. These types of methods use mathematical operations called ’convolution’ to extract relevant features [50][62]. VeloFCN [51][63] is a projection-based method and one of the earliest methods that uses CNN for 3D vehicle detection. The authors used a three convolution layer structure to down-sample the input front of the view map, then up-sample with a deconvolution layer. The output of the last procedure is fed into a regression part to create a 3D box for each pixel. Meanwhile, the same results were entered for classification to check if the corresponding pixel was a vehicle or not. Finally, they grouped all candidates’ boxes and filtered them by a Non-Maximum Suppression (NMS) approach. In the same vein, LMNet [52][64] increased the zone of detection to find road objects by taking into consideration five types of features: reflectance, range, distance, side, height. Moreover, they change the classical convolution by the dilated ones. The Voxelnet [53][65] method begins with the process of voxelizing the set of points cloud and passing it through the VFE network (explained below) to obtain robust features. After that, a 3D convolutional neural network is applied to group voxels features into a 2D map. Finally, a probability score is calculated using an RPN (Region Proposal Network). The VFE network aims to learn features of points by using a multi-layer-perceptron and a max-pooling architecture to obtain point-wise features. This architecture concatenates features from the MLP output and the MLP + Maxpooling. This process is repeated several times to facilitate the learning. The last iteration is fed to an FCN to extract the final features. BirdNet [54][66] generates a three-channel bird eye’s view image, which encodes the height, intensity, and density information. After that, a normalization was performed to deal with the inconsistency of the laser beams of the LiDAR devices. BirdNet uses a VGG16 architecture to extract features, and they adopt a Fast-RCNN to perform object detection and orientation. BirdNet+ [55][67] is an extension of the last work, where they attempted to predict the height and vertical position of the centroid object in addition to the processing of the source (BirdNet) method. This field is also approached by transfer learning, like in Complex-YOLO [56][68], and YOLO3D [57][69]. Other CNN-based method include regularized graph CNN (RGCNN) [58][70], Pointwise-CNN [59][71], PointCNN [60][72], Geo-CNN [61][73], Dynamic Graph-CNN [62][74] and SpiderCNN [63][75].
-
Other Methods: These techniques are based on different approaches. Ref. [64][76] is a machine learning-based method where the authors try to voxelize the set of points cloud into 3D grid cells. They extract features just from the non-empty cells. These features are a vector of six components: mean and variance of the reflectance, three shape factors, and a binary occupancy. The authors proposed an algorithm to compute the classification score, which takes in the input of a trained SVM classification weight and features, then a voting procedure is used to find the scores. Finally, a non-maximum suppression (NMS) is used to remove duplicate detection. Interesting work is done in [65][77], who tried to present a new architecture of learning that directly extracts local and global features from the set of points cloud. The 3D object detection process is independent of the form of the points cloud. PointNet shows a powerful result in different situations. PointNet++ [66][78] extended the last work of PointNet, thanks to the Furthest Point Sampling (FPS) method. The authors created a local region by clustering the neighbor point and then applied the PointNet method in each cluster region to extract local features. Ref. [67][79] introduces a novel approach using LiDAR range images for efficient pole extraction, combining geometric features and deep learning. This method enhances vehicle localization accuracy in urban environments, outperforming existing approaches and reducing processing time. Publicly released datasets support further research and evaluation. The research presents PointCLIP [68][80], an approach that aligns CLIP-encoded point clouds with 3D text to improve 3D recognition. By projecting point clouds onto multi-view depth maps, knowledge from the 2D domain is transferred to the 3D domain. An inter-view adapter improves feature extraction, resulting in better performance in a few shots after fine-tuning. By combining PointCLIP with supervised 3D networks, it outperforms existing models on datasets such as ModelNet10, ModelNet40 and ScanObjectNNN, demonstrating the potential for efficient 3D point cloud understanding using CLIP. PointCLIP V2 [69][81] enhances CLIP for 3D point clouds, using realistic shape projection and GPT-3 for prompts. It outperforms PointCLIP [68][80] by +42.90%, +40.44%, and +28.75% accuracy in zero-shot 3D classification. It extends to few-shot tasks and object detection with strong generalization. Code and prompt details are provided. The paper [70][82] presents a "System for Generating 3D Point Clouds from Complex Prompts and proposes an accelerated approach to 3D object generation using text-conditional models. While recent methods demand extensive computational resources for generating 3D samples, this approach significantly reduces the time to 1–2 min per sample on a single GPU. By leveraging a two-step diffusion model, it generates synthetic views and then transforms them into 3D point clouds. Although the method sacrifices some sample quality, it offers a practical tradeoff for scenarios, prioritizing speed over sample fidelity. The authors provide their pre-trained models and code for evaluation, enhancing the accessibility of this technique in text-conditional 3D object generation. Researchers have developed 3DALL-E [71][83], an add-on that integrates DALL-E, GPT-3 and CLIP into the CAD software, enabling users to generate image-text references relevant to their design tasks. In a study with 13 designers, the researchers found that 3DALL-E has potential applications for reference images, renderings, materials and design considerations. The study revealed query patterns and identified cases where text-to-image AI aids design. Bibliographies were also proposed to distinguish human from AI contributions, address ownership and intellectual property issues, and improve design history. These advances in textual referencing can reshape creative workflows and offer users faster ways to explore design ideas through language modeling. The results of the study show that there is great enthusiasm for text-to-image tools in 3D workflows and provide guidelines for the seamless integration of AI-assisted design and existing generative design approaches. The paper [72][84] introduces SDS Complete, an approach for completing incomplete point-cloud data using text-guided image generation. Developed by Yoni Kasten, Ohad Rahamim, and Gal Chechik, this method leverages text semantics to reconstruct surfaces of objects from incomplete point clouds. SDS Complete outperforms existing approaches on objects not well-represented in training datasets, demonstrating its efficacy in handling incomplete real-world data. Paper [73][85] presents CLIP2Scene, a framework that transfers knowledge from pre-trained 2D image-text models to a 3D point cloud network. Using a semantics-based multimodal contrastive learning framework, the authors achieve annotation-free 3D semantic segmentation with significant mIoU scores on multiple datasets, even with limited labeled data. The work highlights the benefits of CLIP knowledge for understanding 3D scenes and introduces solutions to the challenges of unsupervised distillation of cross-modal knowledge.
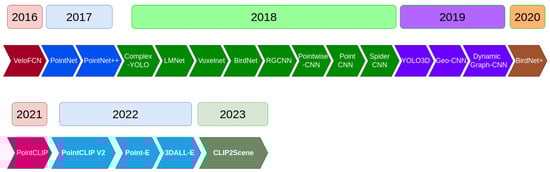
Figure 3 represents a timeline of the most popular 3D object detection algorithms.
Timeline of 3D object detection algorithms [11].
2.4. Discussion
Table 2 provides a categorization for the surveyed papers in this section. The papers were grouped regarding the extracted features. The papers extracted three kinds of object features from the environment: vertical, horizontal, or road curve features in case of semantic type. Also, papers have used non-semantic and deep learning methods to represent any kind of objects that exist in the environment, or to represent only a part of them. Moreover, the table provides some methods and concepts used to extract the features. Researchers have analysed the robustness of the extracted features to help the localization and mapping tasks by using three criteria deduced from the state-of-art investigation.
- Time and energy cost
- : being easy to detect and easy to use in terms of compilation and execution.
- Representativeness
- : detecting features that frequently exist in the environment to ensure the matching process.
- Accessibility
- : being easy to distinguish from the environment.
Researchers used the column ’Robustness’ as a score given to each cluster of papers. The score is calculated based on the three criteria above and the analysis of experiments in the papers. According to the same table, extracting non-semantic features have the highest robustness score regarding their ability to represent the environment even with less texture, i.e., in the case of few objects in the environment like in the desert. This competence is due to the way the features are extracted. Those methods do not limit themselves to extracting one type of object. However, the map created by those features will not have a meaning. They are just helpful reference points for the localization process only.
On another hand, using semantic features helps to get a passable score to be used in localization tasks since they consume a bit more time and energy for executions because most of the time they are not isolated in the environment. One more thing is that they can not be found in any environment, which hardly affects the localization process. Despite all these negative points, these techniques reduce effectively the huge amount of points data (LiDAR or Camera) compared with the non-semantic ones. Also, those features can be used for other perception tasks.
Deep learning methods also get a passable score regarding their efficiency to represent the environment. Like the non-semantic techniques, the DL approaches ensure the representativeness of the features in all environments. However, the methods consume a lot of time and computational resources to be executed.
2.5. Challenges and Future Directions
In order to localize itself within the environment, the vehicle needs to explore the received information from the sensors. However, the huge amount of data received makes it impossible to be used in real-time localization on the vehicle, since the vehicle needs an instant interaction with the environment, e.g., accelerating, breaking, steering the wheel, etc. That is why the on-board systems need effective feature extraction methods that will distinguish relevant features for better execution of the localization process.
After surveying and analyzing related papers, the following considerations for effective localization were identified:
-
Features should be robust against any external effect like weather changes, other moving objects, e.g., trees that move in the wind.