The recognition of the microbiota complexity and their role in the evolution of their host
is leading to the popularization of the holobiont concept. However, the coral holobiont (host and its
microbiota) is still enigmatic and unclear. Here, we explore the complex relations between different
holobiont members of a mesophotic coral Euphyllia paradivisa. We subjected two lines of the coral—
with photosymbionts, and without photosymbionts (apo‐symbiotic)—to increasing temperatures
and to antibiotics. The different symbiotic states were characterized using transcriptomics,
microbiology and physiology techniques. The bacterial community’s composition is dominated by
bacteroidetes, alphaproteobacteria, and gammaproteobacteria, but is dependent upon the symbiont
state, colony, temperature treatment, and antibiotic exposure. Overall, the most important
parameter determining the response was whether the coral was a symbiont/apo‐symbiotic, while
the colony and bacterial composition were secondary factors. Enrichment Gene Ontology analysis
of coral host’s differentially expressed genes demonstrated the cellular differences between
symbiotic and apo‐symbiotic samples. Our results demonstrate the significance of each component
of the holobiont consortium and imply a coherent link between them, which dramatically impacts
the molecular and cellular processes of the coral host, which possibly affect its fitness, particularly
under environmental stress.
- holobiont
- heat stress
- algal symbiont
- coral
- Euphyllia paradivisa
- apo‐symbiont
- microbial communities
Coral Sampling and Experimental Design
Four adult colonies (# 14, 15, 17, and 18) of E. paradivisa were collected at 40–60 m depth from the coral reefs of Eilat, Israel, fragmented to nubbins of ca. 5 cm and placed in running open-circuit seawater aquaria at the Inter-University Institute (IUI) for Marine Sciences in Eilat, Israel. Colony fluorescence was evaluated in situ through a yellow long-pass filter upon excitation of the corals with a ~450-nm light source (Nightsea). Two types of fluorescence were identified; green and yellow (14, 18 and 15, 17 respectively), as indicated previously [34][1]. Following a similar layout as we recently conducted [35][2], for 12 months, half of the fragments were kept under ambient light (symbiotic = S) (see Table S1 in Eyal et al. 2016) while the other half were kept in darkness to generate an apo-symbiotic (lacking the endosymbiotic algae) (apo-symbiotic = AS) state (see Figure 1). The two sets (S and AS) were grown with a running seawater system. This way, the corals were naturally fed in a heterotrophic manner. All the coral fragments remained viable for the whole year, exhibited a performance of fully extended tentacles and were documented with low mortality rates [33][3]. To evaluate the maximum quantum yield of photosystem II of the algal symbionts (photosynthesis yield Fv/Fm), polyps of E. paradivisa from all treatments were examined under a PAM (pulse amplitude modulator) fluorometric device (Diving-PAM, WALZ, Germany). The fragments that were kept in ambient light achieved high symbiont photosynthetic efficiency (yearly average: 0.739 (+/− 0.007 95% CI)), while no fluorescence efficiency was detected in the apo-symbiotic fragments.
Following a period of 12 months, each set was divided into three close-circuit aquarium systems with artificial seawater (Brightwell Aquatics, PA, USA) at an ambient temperature of 24 °C at Bar-Ilan University, Israel. All fragments were kept under a light intensity of 15–52 µmol photons m−2 s−1 during day time, which is characteristic of their natural habitat conditions. After a week of acclimation, the aquaria temperatures were gradually increased from 24 to 32 °C (~1 °C per day), resulting in two sets of treatments (symbiotic and apo-symbiotic) at three temperatures: 24, 28 and 32 °C (Figure 1A). The corals were fed twice with freshly hatched Artemia sp. nauplii during this week of acclimation.
Following a week of incubation with the respective temperature, a short incubation with antibiotics was performed on half of the fragments, in order to evaluate the relationship between the coral and its associated bacteria under heat stress. Each fragment was placed in a 1 L sterile beaker containing filtered seawater (FSW) (the beakers were kept under the same original temperatures (24, 28 and 32 °C). The antibiotic combination included 0.1 mg/mL of nalidixic acid, ampicillin and streptomycin for 48 h according to [36,37][4][5] with minor modifications of concentrations (based on preliminary experiments). Following the antibiotic exposure, the fragments were transferred to clean FSW for 24 h of recovery, and then sampled for various analyses (see below). Thus, finally, the experiment included samples of four sets of coral morphs (Figure 1): (i) Symbiotic polyp, including its natural microbiota (bacteria and endosymbiotic algae); (ii) Apo-symbiotic polyp (iii) “bacterial community depleted” symbiotic polyp (iv) “bacterial community depleted” apo-symbiotic polyp, at three temperatures, resulting with 12 treatments in total (Figure 1B). The samples for all analyses were snap frozen in liquid nitrogen and kept at −80 °C until further analysis.
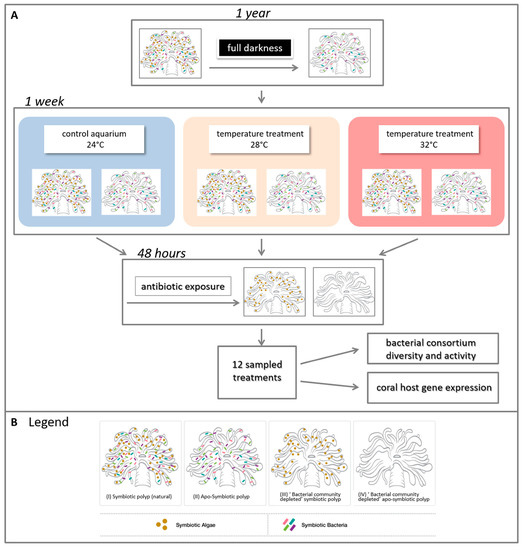
Figure 1. Experimental design. (A) Experiment layout and (B) legend of four generated symbiotic states. Four adult colonies of Euphyllia paradivisa were collected from 40–60 m depth from the Gulf of Eilat and fragmented. Half of the fragments were kept in darkness for a year to generate a full apo-symbiotic type. Symbiotic and apo-symbiotic fragments were subjected to heat-stress for a week, at 28 and 32 °C, and, as a control, 24 °C. After this time, half of the fragments (from each temperature and symbiotic state) were exposed to antibiotics for 48 h to create a “bacterial community depleted” type. In total, 12 treatments (2 symbiotic morphs × 3 temperatures × 2 bacterial states = 12) were analysed for associated microbial communities and host gene expression (see Tables S1,2 for additional details).
Bacterial DNA Extraction and NGS Analyses
DNA for next-generation sequencing (NGS) of bacterial diversity was extracted from the homogenized coral samples (tissue and skeleton) (Table S1) using the UltraClean Soil DNA kit according to the manufacture’s guidelines (MoBio, Carlsbad, CA, USA). Bacterial 16S rRNA genes were amplified using 27F and 1100R primers and then a nested PCR was performed using barcode 27F primer and 515R primer [38,39][6][7]. The tagged amplicons NGS was performed on an IonTorrent (Applied Biosystems, Waltham, MA, USA) at the Bar-Ilan University sequencing unit for 64 coral samples (see Table S1) (total 289,579 sequences). Sequences were prepared for analysis (trimmed, aligned, screened) using MOTHUR v.1.32.1 [40][8] as detailed below. First, the sequences were trimmed using the following settings: ambiguities; 0, maximum homopolymers allowed; 7, quality window average threshold; 20, quality window size; 25, and one and two mismatches were allowed for the barcode and the primers, respectively. After trimming, 430,800 sequences were available for further analysis and the average sequences per sample was 6500. The sequences were further aligned against the silva.seed_v119 database and screened according to the median values of ‘start’ and ‘end’ positions of the alignment. Preclustering was used to group sequences with difference values set to 2 and the clusters were checked for chimeras with the uchime [41][9] module in MOTHUR. Sequentially, a total of 6990 chimeras were found and removed from the dataset. Operational Taxonomic Units (OTUs) were determined by a distance matrix with a cut-off of 0.15 and clustering, while rare OTUs (1–2 sequences) were removed. The taxonomy of the OTU was determined by comparing the sequences to the silva bacteria database. Uncertainties were checked in the blast algorithm in NCBI and corrected accordingly. Chloroplast sequences were removed from the dataset. Statistical analysis was done in PAST statistical analysis software [42][10]. The sequences in this study were deposited in the GenBank nucleotide sequence database under study accession SRP133996.
Coral RNA Extraction and Sequencing
The total RNA was extracted from each of the fragments (tissue and skeleton) from the different treatments using TRIzol reagent (Invitrogen Life Technologies, Carlsbad, CA, USA) according to the methods described previously [43][11]. To assess RNA quality (RIN > 8.5), RNA samples were analysed using a NanoDrop 1000 spectrophotometer (ThermoScientific, Wilmington, DE, USA) and 2100 Bioanalyzer (Agilent, Waltham, MA, USA).
1.5 µg RNA from each sample (n = 33, including only the samples with the highest quality extracts) was prepared using the Illumina TruSeq RNA Library Preparation Kit v2, according to the manufacturer’s protocol. Using the multiplexing strategy of the TruSeq protocol, 33 libraries of the four sets (symbiotic, apo-symbiotic, “Modified bacterial community” symbiotic and apo-symbiotic polyps) ran on three lanes of an Illumina HiSeq2000 machine. Each sample obtained an average of ~10 million paired-end reads. The sequencing was conducted by the NGS unit of the Technion research and development foundation LTD (http://isu.thecnion.ac.il), Israel. The Fastq files have been deposited in an SRA database under the BioProject ID: PRJNA385711.
Coral Transcriptome Assembly and Annotations
RNA-seq reads were searched against three target databases: NCBI NR (non-redundant protein database of all life domains) using Diamond, the Symbiodiniaceae database (http://zoox.reefgenomics.org) using BLASTN, and against the Fugacium kawagutii (formerly Symbiodinium kawagutii) [27][12] unigene database using BLASTN. The reads mapped to bacteria or plants, but not to any animal sources, were filtered out. The remaining reads were further used for transcriptome assembly using Trinity (version 2.2.0) [44][13]. We used the program RSem [45][14] to map non-contaminated reads to the transcriptome assembly, and then read counts per gene were normalized as CPM (Count Per Million) using the TMM method, in EdgeR (within R 3.1.2) (https://bioconductor.org/packages/release/bioc/html/edgeR.html). In total, 31,664 Trinity genes with CPM > 5 were found, and among them 17,892 matched animal sequences. This identification was done by mapping the contigs to several databases: NCBI NT database using BLASTN, and the Nematostella protein database using BLASTX. In addition, a reciprocal Blast search was conducted against the human Ensembl transcripts, using CRB-Blast [46][15].
Differential Expression Analysis and Clustering
Read count normalization was conducted using the program EdgeR [47][16]. Read counts, for 17,892 non-contaminated putative genes, were normalized using the TMM methods, as count per million mapped reads (CPM), and fragments per kilobase of mapped exon, per million mapped reads (FPKM). Samples were further clustered using multi-dimensional scaling (MDS). Four samples were found to be clustering-outliers and were excluded from the analysis based on their low read counts, quality or putative contamination (see Table S2). DE analysis was conducted using EdgeR GLM method [47][16], which allows modelling the additive effect of different factors on the total normalized counts, namely symbiont state, temperature, and antibiotic exposure, on the total normalized counts. We included the four factors—colony origin, symbiont state, temperature, and antibiotic exposure—in the GLM model. We first identified per-gene cases of significant symbiont effect (adjusted p value < 0.05), significant temperature change effects (32 vs. 24 °C, 28 vs. 24 °C, and 32 vs. 28 °C). A significant factor effect (adjusted p value < 0.05) was defined as greater than a two-fold change. Similarly, we searched for genes with significant effect of antibiotics treatment.
For heat map representations, relative transcript abundance values were calculated. First, all DE samples were divided into groups, so that each group includes individuals from the same colony, under the same symbiont state. Then, the relative transcript abundance was calculated by dividing every individual FPKM belonging to a specific group (specific colony and symbiont combination), from the mean FPKM of all individuals of the same group. In addition, with the purpose of analysing host gene expression for the different treatments (alongside the combination of factors), we calculated fold changes for each treatment using the relevant control (each heat-stress sample to its 24 °C control while keeping the factors of symbiont state, antibiotic exposure and colony origin constant). An arbitrary cut-off of at least two-fold was chosen to define a differentially expressed gene (DEG). Thus, we generated 8 lists of genes: symbiotic at 28 °C, apo-symbiotic at 28 °C, symbiotic at 32 °C, and apo-symbiotic at 32 °C that their fold change decrease and increase followed the antibiotic exposure.
Functional gene analysis and KEGG pathways analysis was done by David Bioinformatics Resources 6.7 [48[17][18],49], using the Homo sapiens orthologs annotations. The GO terms assigned to the contig sequences were exported to the web-based CateGOrizer [50][19] in order to generate GO slim terms and to count the ancestors’ terms as a percentage of the total GOs.
Results
In this study, the importance of the symbiont algae and the bacterial community to the physiology of the coral E. paradivisa during a heat stress was evaluated. The symbiosis effect was tested by creating apo-symbiotic corals as described above. Pairwise comparisons of the photosynthetic maximal quantum yield (Fv/Fm) of the polyps with algal symbionts showed no significant differences at any temperature, time point or antibiotic exposure (Two-way ANOVA, F interaction = 1.4, p = 0.118) and the average Fv/Fm value was 0.6. Apo-symbiotic polyps consistently gave zero yield during the experiment (Figure S1), and, as we showed in an accompanied paper [35][2] no algal cells and chlorophyll a were detected, as expected. While the presence or absence of symbiosis is relatively straight forward, the bacterial community did not disappear completely due to the antibiotic treatment, but rather the species composition was depleted and shifted, as will be presented and discussed below (see Figure S2 for effect of antibiotic exposure on culturable bacteria abundance).
Clusters in Host Gene Expression and Bacterial Communities
We inspected the response of host gene expression and its bacterial community composition to the increasing temperature and antibiotic treated (Figure 2). The multi-dimensional scaling (MDS) clustering displays the gene expression variance of the 29 tested samples. The samples were grouped into clusters primarily by symbiotic morph factor (symbiotic vs. apo-symbiotic) and colony origin (original coral) without apparent effect of temperature or antibiotic treatment (Figure 2A).
Similarly, the bacterial communities clustered according to the coral state first (symbiotic or apo-symbiotic) but in contrast to gene expression, we see here subdivision according to antibiotic exposure rather than temperature (dashed line in Figure 2B). Another observation to note is that in the symbiotic corals, the 24 and 28 °C bacterial communities clustered together and separately from the 32 °C treatment. But, in the apo-symbiotic corals, the 28 °C and 32 °C treatments clustered together and separately from the 24 °C treatment. Also worth noting is that the separation between the antibiotics treated and un-treated groups was more distinctive in the apo-symbiotic polyps (Figure 2B).
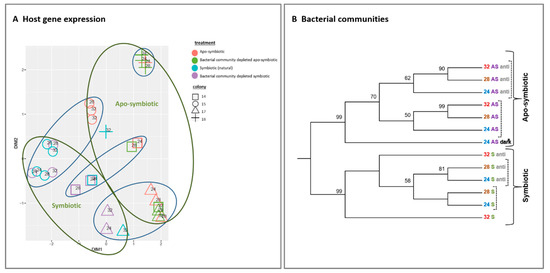
Figure 2. Host gene expression and bacterial communities clustering by symbiotic and apo-symbiotic E. paradivisa samples (12 treatments). (A) Multi-dimensional scaling (MDS) clustering of 29 tested samples (15 symbiotic and 14 apo-symbiotic; see Table S2). Colony origin is indicated by a distinctive shape, the preliminary treatment by a colour (see legend), and the temperature is indicated within the figure. Clusters formed according to apo/symbiotic state are marked with green circles, and clusters formed according to colony origin are marked with blue circles. (B) Cluster analysis of microbial community 16S rRNA NGS libraries (n = 289,579) generated from 13 E. paradivisa samples (12 treatment including one group “24 AS dark*” as control, see below and Table S1)). An unrooted neighbour-joining tree of communities by 16S rRNA gene NGS. Bootstrap values represent 100 iterations. Sequences retrieved were analysed using MOTHUR software [40]. The curly brackets indicate the main cluster segregation by symbiotic and apo-symbiotic types, while the dashed brackets indicate an inner subdivision by antibiotic treatment. The sample “24 AS dark*” represents apo-symbiotic polyps that were kept in the dark as control. Labels are coloured according to temperature treatment and symbiotic state type.
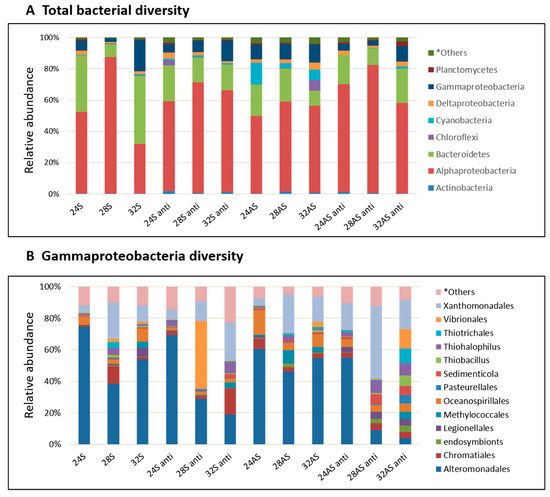
Figure 3. Bacterial composition and relative abundance of symbiotic and apo-symbiotic E. paradivisa samples (12 treatments). (A) total bacterial diversity divided by phylum and (B) Gammaproteobacteria class diversity divided by order. *Others includes all groups under 2%.
The Diversity of Coral Host Associated Bacteria
We further looked at the variations between the bacterial communities in the different treatments by inspecting the bacterial community composition (Figure 3A). The communities in the treated corals were compared to the community of the symbiotic corals kept in 24°C (baseline community), as these are the corals that simulate most closely the current conditions in the Gulf of Eilat. The baseline community was dominated by Bacteroidetes (45%), alphaproteobacteria (30%) and gammaproteobacteria (20%). In all treatments, the abundance of Bacteroidetes and gammaproteobacteria decreased compared to the baseline community, while the abundance of alphaproteobacteria increased. An interesting observation was the increase in the abundance of cyanobacteria in the apo-symbiotic corals in all three temperatures. The relative abundance of cyanobacteria in apo-symbiotic corals reduced to less than 1% after antibiotic exposure. (Figure 3A). The Shannon index (measures species diversity based on species richness and evenness) was highly variable between the biological replicates and treatments (ranging between 0.4 and 5.2).
As stated above, alphaproteobacteria increased in abundance in all conditions compared to the baseline community. Sphingomonadaceae was the most abundant family (average of about 83% of alphaproteobacteria) and the dominant OTU genus Sphingomonas was identified by NCBI database comparison as Sphingomonas paucimobilis (GenBank accession number KX055885, 98% identity). An increase was observed also in another group, the Rhizobiales, including diazotrophs members, in the apo-symbiotic polyps (5 and 5.5% of alphaproteobacteria) at 28 and 32 °C, respectively. Meanwhile, in the symbiotic polyps, lower percentages were observed (1.8 and 2.46% of alphaproteobacteria) at 28 and 32 °C, respectively.
While gammaproteobacteria made only 20% of the microbial community in the 24 °C symbiotic colonies, it is an important member of the holobiont, as some of the pathogens known for coral bleaching and other diseases are associated with that family [51,52][20][21] Therefore, a more careful inspection was done on the specific class of gammaproteobacteria in the different conditions (Figure 3B). The most striking observation was the difference between the community compositions of the control and colonies that were exposed to the most extreme treatment–the apo-symbiotic colonies treated with antibiotics at 28 and 32 °C. While the control colonies were dominated by Alteromonadales, the 28 and 32 °C treated colonies were more diverse and included 7–9 families with equal percentages and one dominant family in the 28 °C colonies and three co-dominants in the 32 °C colonies. One family that increased its abundance in those and other colonies was the Xanthomonadales. Other families that showed an increase in some of the colonies included Chromatiales, Oceanospirillales, and Vibrionales, all of which on the expense of Alteromonadales.
To determine whether the change in conditions caused a change in the species composition of the dominant groups (alpha-, delta- and gammaproteobacteria) and phylum (Bacteroidetes), a neighbour-joining test was performed for each separately. The alphaproteobacteria clustered into three clusters; one that contained only communities that were not treated with antibiotics, regardless of the temperature and the symbiotic state, and two clusters that contained communities that were treated with the antibiotics. However, there was almost no importance to the temperature or the symbiotic state of the corals (Figure 4A). In contrast, gammaproteobacteria and deltaproteobacteria were clustered primarily by temperature, where three of the 24 °C treatments were in one cluster and the 28 and 32 °C colonies composed another branch, which had two main clusters. One cluster contained only symbiotic corals and the other apo-symbiotic corals. The antibiotics treatment did not have any effect on the gammaproteobacteria (Figure 4B,D). Bacteroidetes had the most “organized” clustering, where the apo-symbiotic treated with antibiotics communities made one cluster, the apo-symbiotic with no antibiotics made a second cluster, and the symbiotic communities made a third cluster, with some separation between the antibiotics treated and untreated communities. However, temperature change did not have any effect on Bacteroidetes clustering. In fact, the Bacteroidetes tree most resembled the tree cluster of the whole bacterial community (Figure 4C and Figure 2B, respectively).
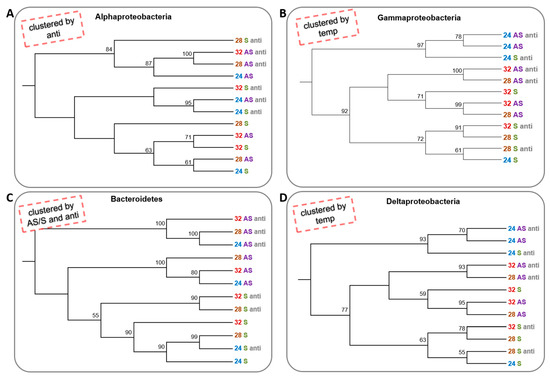
Figure 4. Cluster analysis of microbial community from four bacterial groups of 16S rRNA NGS libraries generated from E. paradivisa samples. (A) Alphaproteobacteria (B) Gammaproteobacteria (C) Bacteroidetes and (D) Deltaproteobacteria. An unrooted neighbour-joining tree of communities by 16S rRNA gene NGS. Bootstrap values represent 100 iterations. Retrieved sequences were analysed using MOTHUR software [40]. The headlines (in the red dashed box) indicate the main factor or factors that affect the clustering pattern. Labels are coloured according to the temperature treatment and the symbiotic state.
Gene Expression Analysis of the Coral Host
One aspect that was examined in this study was the response of the coral to the changing environment (temperature, symbionts presence, microbial community changes) by transcriptome analysis. The symbiont state had the most effect on gene expression, whereas all antibiotic-treated versus all non-treated samples yielded the lowest number of DEGs (Figure S3). The effect of temperature was most evident between 32 and 24 °C, with 1300 DEGs detected. The first temperature increase, at 28 °C, yielded more DEGs than the transition between 28 and 32 °C. Moreover, most (72.5%) of the DEGs were down-regulated from 24 to 28 °C, but were mostly up-regulated (72%) after a further increase to 32 °C. Overall, across the range of 24 to 32 °C, the percentages of up-regulated versus down-regulated genes are similar.
The heat map of the hierarchical clustering of gene expression of all E. paradivisa samples further highlights the clustering of the samples according to the symbiotic state (Figure 5A). The relative transcript abundance levels of significant differentially expressed genes, between all apo-symbiotic samples and all symbiotic samples, are illustrated. Enrichment Gene Ontology (GO) analysis of the up- and down-regulated genes revealed the major cellular differences leading to separate clustering of the apo-symbiotic and symbiotic E. paradivisa samples (Figure 5B,C). Higher percentages of metabolism, catabolism, and biosynthesis processes are more up-regulated in the apo-symbiotic samples, while developmental processes, morphogenesis, embryonic development and cell proliferation are more down-regulated in the apo-symbiotic corals. In addition, transport and ion transport genes seem to be more down-regulated in the apo-symbionts. Other interesting enrichment analyses in KEGG pathways and INTERPRO domains are presented in Figure 5C. Green Fluorescent Protein (GFP) was found in the up-regulated group of apo-symbiotic vs. symbiotic E. paradivisa. Figure S4 further shows that the expression values of a contig possessing this domain is significantly higher in the apo-symbiotic state than in the symbiotic type.
Figure 6 presents the results of the enrichment analysis as GOs (percentages of slim terms) affected by antibiotic exposure. More cellular processes were more affected by antibiotics in the apo-symbiotic samples (Figure 6B,D), than in the symbiotic ones (Figure 6A,C). Moreover, in the symbiotic samples there are more processes that decrease following antibiotic exposure than increased processes. GO of development is more triggered by community change in symbiotic samples while it is more suppressed following the community change in apo-symbiotic samples, regardless of the temperature. In contrast, the GO of cell communication is reduced in symbiotic but increased in apo-symbiotic samples.
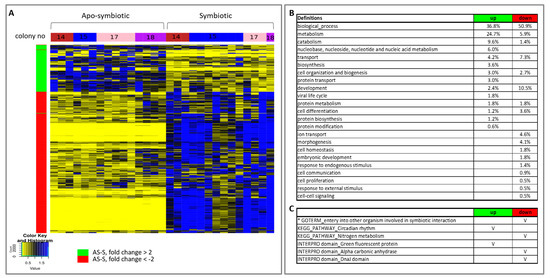
Figure 5. Heat map of hierarchical clustering and enrichment analysis of all apo-symbiotic vs all symbiotic samples. (A) A heat map showing the relative transcript abundance levels of differentially expressed genes (p value <0.05) having a mean fold change of > 2 or < −2, between apo-symbiotic samples and symbiotic samples. The tested groups, colonies 14, 15, 17 and 18, are marked in the horizontal colour bar: red, blue, pink and purple, respectively. (B) Enriched Gene Ontologies (GOs) in the up-regulated and down-regulated groups of apo-symbiotic vs symbiotic analysis. GO slim terms, generated by the web-based tool CateGOrizer [50], are presented as a percentage of the total GOs of the group. (C) Other GO, KEGG pathways, INTERPRO domains of interest that were significantly enriched in the up- or down-regulated groups are marked with V. An asterisk marks a result from a reciprocal BLAST analysis.
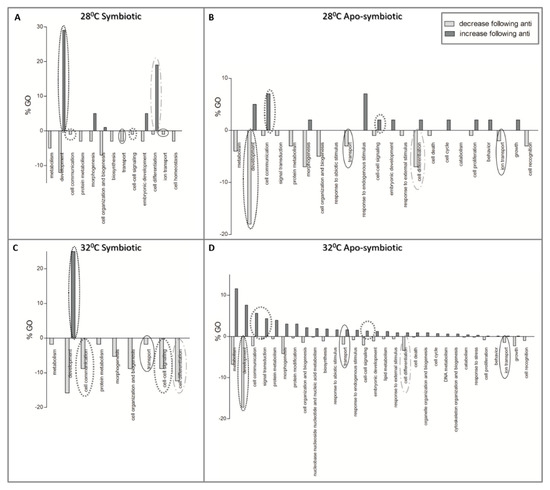
Figure 6. The effect of antibiotic exposure on coral host gene expression. Enriched Gene Ontologies (GOs) of differentially expressed genes which their fold change was either lower (light grey) or higher (dark grey) following the antibiotic exposure. GO slim terms, generated by the web-based tool CateGOrizer [50], are presented as a percentage of the total GOs. (A) symbiotic E. paradivisa at 28 °C, (B) apo-symbiotic E. paradivisa at 28 °C, (C) symbiotic E. paradivisa at 32 °C, and (D) apo-symbiotic E. paradivisa at 32 °C. Several GOs of interest are marked with circles: development, communication, differentiation, and transport in the cell.
34. Eyal, G.; Wiedenmann, J.; Grinblat, M.; D’Angelo, C.; Kramarsky-Winter, E.; Treibitz, T.; Ben-Zvi, O.; Shaked, Y.; Smith, T.B.; Harii, S.; et al. Spectral diversity and regulation of coral fluorescence in a mesophotic reef habitat in the Red Sea. PLoS ONE 2015, 10, doi:10.1371/journal.pone.0128697.
35. Meron, D.; Maor-landaw, K.; Weizman, E.; Waldman Ben-Asher, H.; Gal, E.; Banin, E.; Loya, Y.; Levy, O. The Algal Symbiont Modifies the Transcriptome of the Scleractinian Coral Euphyllia paradivisa During Heat Stress. Microorganisms 2019, 7, 1–16.
36. Mills, E.; Shechtman, K.; Loya, Y.; Rosenberg, E. Bacteria appear to play important roles in both causing and preventing the bleaching of the coral Oculina patagonica. Ecol. Prog. Ser. 2013, 489, 155–162.
37. Gilbert, J.A.; Hill, R.; Doblin, M.A.; Ralph, P.J. Microbial consortia increase thermal tolerance of corals. Biol. 2012, 159, 1763–1771.
38. Hongoh, Y.; Ohkuma, M.; Kudo, T. Molecular analysis of bacterial microbiota in the gut of the termite Reticulitermes speratus (Isoptera; Rhinotermitidae). FEMS Microbiol. Ecol. 2003, 44, 231–242.
39. Fierer, N.; Hamady, M.; Lauber, C.L.; Knight, R. The influence of sex, handedness, and washing on the diversity of hand surface bacteria. Natl. Acad. Sci. USA 2008, 105, 17994–17999.
40. Schloss, P.; Westcott, S.; Ryabin, T.; Hall, J.; Hartmann, M.; Hollister, E.; Lesniewski, R.; Oakley, B.; Parks, D.; Robinson, C.; et al. Introducing mothur: Open-source, platform-independent, community-supported software for describing and comparing microbial communities. Environ. Microbiol. 2009, 75, 7537–7541.
41. Edgar, R.C.; Haas, B.J.; Clemente, J.C.; Quince, C.; Knight, R. UCHIME improves sensitivity and speed of chimera detection. Bioinformatics 2011, 27, 2194–2200.
42. Hammer, Ø.; Harper, D.A.T.; Ryan, P.D. PAST: Paleontological statistics software package for education and data analysis. Electron. 2001, 4, 1–9.
43. Rosenberg, Y.; Doniger, T.; Levy, O. Sustainability of coral reefs are affected by ecological light pollution in the Gulf of Aqaba/Eilat. Biol. 2019, 2, 1–9.
44. Grabherr, M.G.; Haas, B.J.; Yassour, M.; Levin, J.Z.; Thompson, D.A.; Amit, I.; Adiconis, X.; Fan, L.; Raychowdhury, R.; Zeng, Q.; et al. Trinity: Reconstructing a full-length transcriptome without a genome from RNA-Seq data. Biotechnol. 2013, 29, 644–652.
45. Li, B.; Dewey, C.N. RSEM: Accurate transcript quantification from RNA-Seq data with or without a reference genome. BMC Bioinform. 2011, 12, 323.
46. Aubry, S.; Kelly, S.; Kümpers, B.M.C.; Smith-Unna, R.D.; Hibberd, J.M. Deep Evolutionary Comparison of Gene Expression Identifies Parallel Recruitment of Trans-Factors in Two Independent Origins of C4 Photosynthesis. PLoS Genet. 2014, 10, e1004365.
47. Robinson, M.; McCarthy, D.; Smyth, G. edgeR: A Bioconductor package for differential expression analysis of digital gene expression data. Bioinformatics 2010, 26, 139–140.
48. Huang, D.W.; Sherman, B.T.; Lempicki, R.A. Systematic and integrative analysis of large gene lists using DAVID bioinformatics resources. Protoc. 2009, 4, 44–57.
49. Huang, D.W.; Sherman, B.T.; Lempicki, R.A. Bioinformatics enrichment tools: Paths toward the comprehensive functional analysis of large gene lists. Nucleic Acids Res. 2009, 37, 1–13.
50. Zhi-Liang, H.; Bao, J.; James, M.R. A web-based program to batch gene ontology classification categories. Online J. Bioinform. 2008, 9, 108–112.
51. Ben-Haim, Y.; Thompson, F.L.; Thompson, C.C.; Cnockaert, M.C.; Hoste, B.; Swings, J.; Rosenberg, E. Vibrio coralliilyticus sp. nov., a temperature-dependent pathogen of the coral Pocillopora damicornis. J. Syst. Evol. Microbiol. 2003, 53, 309–315.
52. Cervino, J.M.; Hayes, R.L.; Polson, S.W.; Polson, S.C.; Goreau, T.J.; Martinez, R.J.; Smith, G.W. Relationship of Vibrio species infection and elevated temperatures to yellow blotch/band disease in caribbean corals. Environ. Microbiol. 2004, 70, 6855–6864.
References
- Eyal, G.; Wiedenmann, J.; Grinblat, M.; D’Angelo, C.; Kramarsky-Winter, E.; Treibitz, T.; Ben-Zvi, O.; Shaked, Y.; Smith, T.B.; Harii, S.; et al. Spectral diversity and regulation of coral fluorescence in a mesophotic reef habitat in the Red Sea. PLoS ONE 2015, 10.
- Meron, D.; Maor-landaw, K.; Weizman, E.; Waldman Ben-Asher, H.; Gal, E.; Banin, E.; Loya, Y.; Levy, O; The Algal Symbiont Modifies the Transcriptome of the Scleractinian Coral Euphyllia paradivisa During Heat Stress. Microorganisms 2019, 7, 1–16.
- Gal Eyal; Lee Eyal-Shaham; Itay Cohen; Raz Tamir; Or Ben-Zvi; Frederic Sinniger; Yossi Loya; Euphyllia paradivisa, a successful mesophotic coral in the northern Gulf of Eilat/Aqaba, Red Sea. Coral Reefs 2016, 35, 91-102, 10.1007/s00338-015-1372-1.
- E Mills; K Shechtman; Yossi Loya; E Rosenberg; Bacteria appear to play important roles in both causing and preventing the bleaching of the coral Oculina patagonica. Marine Ecology Progress Series 2013, 489, 155-162, 10.3354/meps10391.
- Justine A. Gilbert; Ross Hill; Martina Doblin; Peter L. Ralph; Microbial consortia increase thermal tolerance of corals. Marine Biology 2012, 159, 1763-1771, 10.1007/s00227-012-1967-9.
- Hongoh, Y.; Ohkuma, M.; Kudo, T. Molecular analysis of bacterial microbiota in the gut of the termite Reticulitermes speratus (Isoptera; Rhinotermitidae). FEMS Microbiol. Ecol. 2003, 44, 231–242.
- Noah Fierer; Micah Hamady; Christian L. Lauber; Rob Knight; The influence of sex, handedness, and washing on the diversity of hand surface bacteria. Proceedings of the National Academy of Sciences 2008, 105, 17994-17999, 10.1073/pnas.0807920105.
- Patrick D. Schloss; Sarah L. Westcott; Thomas Ryabin; Justine R. Hall; Martin Hartmann; Emily B. Hollister; Ryan A. Lesniewski; Brian B. Oakley; Donovan H. Parks; Courtney J. Robinson; Jason W. Sahl; Blaz Stres; Gerhard G. Thallinger; David J. Van Horn; Carolyn F. Weber; Introducing mothur: Open-Source, Platform-Independent, Community-Supported Software for Describing and Comparing Microbial Communities. Applied and Environmental Microbiology 2009, 75, 7537-7541, 10.1128/aem.01541-09.
- Robert C. Edgar; Brian J. Haas; Jose C. Clemente; Christopher Quince; Rob Knight; UCHIME improves sensitivity and speed of chimera detection. Bioinformatics 2011, 27, 2194–2200, 10.1093/bioinformatics/btr381.
- Hammer, Ø.; Harper, D.A.T.; Ryan, P.D; UCHIME improves sensitivity and speed of chimera detection.PAST: Paleontological statistics software package for education and data analysis. Palaeontol. Electron. 2001, 4, 1–9.
- Rosenberg, Y.; Doniger, T.; Levy, O; Sustainability of coral reefs are affected by ecological light pollution in the Gulf of Aqaba/Eilat. Commun. Biol. 2019, 1, 1–9.
- LaJeunesse, T.C.; Parkinson, J.E.; Gabrielson, P.W.; Jeong, H.J.; Reimer, J.D.; Voolstra, C.R.; Santos, S.R; Systematic Revision of Symbiodiniaceae Highlights the Antiquity and Diversity of Coral Endosymbionts. Curr. Biol. 2018, 28, 2570–2580.
- Grabherr, M.G.; Haas, B.J.; Yassour, M.; Levin, J.Z.; Thompson, D.A.; Amit, I.; Adiconis, X.; Fan, L.; Raychowdhury, R.; Zeng, Q; et al. Trinity: Reconstructing a full-length transcriptome without a genome from RNA-Seq data. Nat. Biotechnol. 2013, 29, 644–652.
- Li, B.; Dewey, C.N; RSEM: Accurate transcript quantification from RNA-Seq data with or without a reference genome. BMC Bioinform. 2011, 12, 323.
- Aubry, S.; Kelly, S.; Kümpers, B.M.C.; Smith-Unna, R.D.; Hibberd, J.M; Deep Evolutionary Comparison of Gene Expression Identifies Parallel Recruitment of Trans-Factors in Two Independent Origins of C4 Photosynthesis. PLoS Genet. 2014, 10, e1004365.
- Robinson, M.; McCarthy, D.; Smyth,; edgeR: A Bioconductor package for differential expression analysis of digital gene expression data. Bioinformatics 2010, 26, 139–140.
- Da Wei Huang; Brad T Sherman; Richard Lempicki; Systematic and integrative analysis of large gene lists using DAVID bioinformatics resources. Nature Protocols 2009, 4, 44-57, 10.1038/nprot.2008.211.
- Da Wei Huang; Brad T. Sherman; Richard Lempicki; Bioinformatics enrichment tools: paths toward the comprehensive functional analysis of large gene lists. Nucleic Acids Research 2009, 37, 1-13, 10.1093/nar/gkn923.
- Zhi-Liang, H.; Bao, J.; James, M.R. A web-based program to batch gene ontology classification categories. Online J. Bioinform. 2008, 9, 108–112.
- Y. Ben-Haim; M. C. Cnockaert; B. Hoste; J. Swings; F. L. Thompson; E. Rosenberg; Vibrio coralliilyticus sp. nov., a temperature-dependent pathogen of the coral Pocillopora damicornis. International Journal of Systematic and Evolutionary Microbiology 2003, 53, 309-315, 10.1099/ijs.0.02402-0.
- James M. Cervino; Raymond L. Hayes; Shawn W. Polson; Sara C. Polson; Thomas J. Goreau; Robert Martinez; Garriet W. Smith; Relationship of Vibrio Species Infection and Elevated Temperatures to Yellow Blotch/Band Disease in Caribbean Corals. Applied and Environmental Microbiology 2004, 70, 6855-6864, 10.1128/aem.70.11.6855-6864.2004.