Emulsions have garnered significant attention within a variety of industries, including pharmaceuticals, food production, and cosmetics. The importance of emulsions across these sectors is attributed to their versatility and unique properties, such as increased interfacial area and the ability to deliver compounds insoluble in water or to mask the flavor of unpalatable ingredients. A comprehensive and precise assessment of the physicochemical properties, structural features, and stability of emulsions is an indispensable phase in the pursuit of new formulations and the improvement of manufacturing protocols. The characterization of emulsions encompasses an array of methodologies designed to determine their attributes, such as composition, texture, rheological and thermal properties, electrical conductivity, droplet size, size distribution, concentration, surface charge, and others.
- food analysis
- analytical techniques
- droplet size
- microstructure
- stability
- rheology
- emulsion
1. Introduction
2. Techniques for Emulsion Characterization
2.1. Microscopic Analysis
One of the most straightforward and widespread methods for emulsion characterization is microscopic analysis. Microscopic analysis is performed to assess the morphology of the droplets (shape and size), droplet concentration, and distribution throughout the sample [66][22]. Observing changes in the morphology of the droplets over time can give us valuable information on emulsion stability and the mechanism of phase separation. The image typical for stable emulsion shows small, non-flocculated, homogenously distributed droplets that are relatively uniform in size. Unstable emulsion separating through flocculation can be recognized by the presence of equally sized droplets that group but maintain their integrity. In the emulsions undergoing separation through coalescence or Ostwald ripening, small and large droplets are present at the same time [37][23]. Microscopic evaluation of emulsions can be performed via several techniques. The most common methods include optical microscopy, fluorescent microscopy, and electron microscopy [67,68][24][25]. Optical microscopy is commonly used for the initial assessment of emulsions due to its simplicity, availability, and capability to quickly provide qualitative information about the emulsion. However, with the level of resolution it provides (down to 1–2 μm [69][26]), it is often insufficient for a detailed analysis of the emulsion structure. In addition, optical microscope images of emulsions often suffer from relatively low contrast between the phases, caused by their similar refractive indexes, which makes it difficult to distinguish one phase from the other [70][27]. To improve the contrast and visibility of the droplets against the background of the continuous phase, water- or oil-soluble dyes absorbing light in the visible region can be added to the sample [66,71][22][28] or emulsion droplets may be stabilized with pigment particles (e.g., Irgalite Red D 3707, Cromophtal Violet D 5700, Paliotol Yellow K 0961) serving simultaneously as a contrast-enhancing agent and a surfactant [72][29]. However, the color compounds added to the emulsions have to be carefully selected, as they may induce substantial changes in emulsion structure or interact with some of its components. Enhanced contrast can also be achieved using phase contrast or differential interference contrast microscopy, in which special lenses amplify the small differences in the refractive index into more significant differences in light intensity. Another limitation of conventional bright field light microscopy is limited imaging capabilities in the case of 3D objects, such as crystals of fat or ice (in frozen emulsions), or air bubbles. Polarization light microscopy is a valuable tool for three-dimensional imaging of such objects. There is a striking difference between images of fat crystals in emulsions observed using a transmitted light microscope and a polarized light microscope [74][30]. Although conventional transmitted light microscopy allows for the visualization of emulsion droplets, it fails to clearly recognize transparent fat crystals against a bright background. The visibility of fat crystals under polarized light is greatly improved; however, this method fails to show the structure of the emulsion in the background. For this reason, it is advisable to combine several different microscopic techniques to obtain reliable information about emulsion structure. The techniques widely used to complement the information about emulsion structure gathered from white light microscopy are fluorescent microscopy and confocal laser scanning microscopy (CLSM) [75][31]. These approaches can be applied to assess emulsions containing compounds that display inherent fluorescence when exposed to light (autofluorescence), which is typical for many oils (e.g., aromatic hydrocarbons), vitamins (e.g., A, B2, E, and D), proteins, toxins (e.g., aflatoxin), metabolites, plant pigments (e.g., chlorophyll), and flavoring compounds [76][32]. Auto-fluorescent compounds can easily be differentiated from other emulsion components, as well as particles and air bubbles that may be present in the sample. The fluorescence of the oil phase can also be enhanced by adding fluorescent oleophilic dyes such as 3-alkoxyflavone or Nile Red [77][33]. Non-fluorescent compounds present in the emulsions, such as proteins, surfactants, contaminants, etc., can be visualized using fluorescent probes that selectively bind to target molecules. In addition, the fluorescence emitted by these molecules can be utilized for quantitative analysis of their content in the emulsion by fluorescence spectroscopy. Fluorescent dyes can be used to analyze the structure and stabilization mechanisms of emulsions. High-contrast images of emulsions comprising non-fluorescent oil and water phases can be obtained by labeling the oil-water interface using fluorescent stabilizers, such as carbon nitride quantum dots, combined with solid supports, e.g., laponite nanoparticles [78][34] or fluorescent dyes, e.g., NBD [79][35]. Using fluorescent surfactants to stabilize emulsions can provide information on the localization and behavior of emulsifier molecules at the oil-water interface. Thijssen et al. [78][34] have demonstrated that NBD, a common fluorescent dye, can effectively act as a surfactant. However, they have also revealed that the dye substantially affected the behavior of other particles adsorbed to the liquid-liquid interface, which altered the interfacial tension and the particle contact angle. This should be taken into account in studies utilizing fluorescent probes for labeling and in situ imaging of emulsion components. Fluorescent microscopy and CLSM are typically employed for the visualization of emulsions containing droplets with sizes down to ~300 nm [69][26]. Since, over the last few decades, the size of emulsion droplets has reached the lower end of the nanometer scale, visualization by optical microscopy has become insufficient to provide reliable data on nanoemulsion structure. Therefore, optical microscopy has been largely replaced by electron microscopy, which offers much higher resolution and allows imaging structures with sizes down to 0.1 nm [69][26]. The excellent resolution of electron microscopy allows visualization of multi-lamellar structures, vesicles, micelles, crystals, and liposomes, which remain undetected by both optical microscopy and particle size analyzers [80][36]. Electron microscopy techniques can be divided into transmission electron microscopy (TEM) and scanning electron microscopy (SEM). The SEM analysis offers the advantage of obtaining topographical information at a significant depth of focus on a 2D image [80][36]. SEM generates images of a sample by scanning the surface with a focused beam of electrons accelerated under high voltage. The electrons penetrate the specimen and are deflected by elastic scattering. As a result of the interactions between electrons and the specimen, electron signals (backscattered and secondary electrons), and X-rays are generated. Backscattered electrons are high-energy electrons scattered out of the sample originating from the specimen's deeper regions. They provide valuable information about the composition of the sample. Secondary electrons are low-energy electrons, which have penetrated the surface regions of the sample a few nanometers below its surface. They reveal topographic information about the structure of the specimen surface. X-rays produced when electrons reach the sample give information about its elemental composition. These signals are collected by electron detectors to form a gray-scale image. The advantages of SEM that have made it one of the most popular tools for the ultrastructural analysis of emulsions include detailed topographical information of the sample surface, which cannot be obtained in two-dimensional projections produced by TEM, and a high depth of focus. The depth of focus at low magnifications can reach a few millimeters. However, preserving the shape and size of emulsion droplets during SEM analysis is challenging, and requires specific SEM fixation protocols [81][37]. Other limitations include a lack of information on the internal structure of the sample, limited resolution, and the risk of damaging the specimen structure, especially after prolonged exposure to the electron beam [80][36]. TEM is one of the most powerful methods for analyzing emulsion structures. The high resolution of TEM has rendered this technique an indispensable tool for imaging emulsions comprising droplets in the nanometer and sub-nanometer size range (down to 0.1 nm) [82,83][38][39]. Before TEM analysis, a 2–5 µL sample of emulsion is deposited onto a carbon- or polymer-coated grid and dried for up to several hours. Alternatively, the sample may be cooled to cryogenic temperatures, which allows preservation of its native state. During imaging, a beam of electrons passes through an ultra-thin (<200 nm) sample of emulsion at high (60–200 kV) accelerating voltage. The electrons transmitted through the specimen are cast onto a fluorescent screen producing a high-resolution image. Typically, a bright field TEM imaging combined with diffraction mode is used for the characterization of the size and shape of emulsion droplets [84][40]. The main limitation of both SEM and TEM techniques is that they require relatively complex preparation of the sample before observation, which often involves dilution, spreading, drying, or freezing and may alter the original emulsion structure [71][28]. As a result, obtained images are often not representative of the sample in a liquid state [85][41]. The degree to which the original structure of the emulsion is maintained is highly dependent on the technique applied to fix the sample [80][36]. For example, chemical fixation with glutaraldehyde is known to distort native emulsion structure by causing the shrinking of oil droplets and is therefore considered unsuitable for emulsions [86][42]. Among other methods, fixation by cryogenic freezing, in which sample characterization is carried out in a vitreous frozen-hydrated state, has been shown as the most reliable [87][43]. In this approach, the water contained in the sample is transformed from a liquid to an amorphous solid state by vitrification without the formation of ice crystals. Avoiding the formation of ice crystals within the water phase prevents structural damage to emulsion droplets [88][44]. Cryogenic freezing can be used to fix emulsions before observation with both SEM and TEM [87][43]. However, to account for any changes that may have occurred in the structure of the emulsion during microscopic evaluation, it is necessary to verify the obtained data with other analytical methods such as droplet size analysis. One of the most promising techniques that may open new perspectives in understanding the behavior of emulsions is atomic force microscopy (AFM). This technique allows direct visualization of interfacial films and analysis of their tightness, integrity, morphology, and structure. This can provide crucial insights into emulsion stability and separation phenomena, as well as the behavior of molecules at the droplet interfaces [89][45]. For example, AFM can be utilized to examine the competitive adsorption of various emulsifier molecules at the oil-water interface [90][46]. Morris et. al. used AFM to visualize the gradual displacement of milk protein β-lactoglobulin from an air-water interface by the water-soluble surfactant Tween 20 [90][46]. AFM has also been used to study the formation and arrangement of multi-layer films at the oil-water interface, providing a deeper understanding of the stabilization mechanisms in complex interfacial layers. Recent technological advancements in AFM have allowed the visualization and quantification of interfacial interactions at a nanoscale level [91][47]. By utilizing nano-structured probes for scanning material surfaces at sub-nanometric and atomic resolution, AFM can provide information on the surface interaction forces as well as micro/nano-structured surface topography [92][48]. One of the significant limitations of AFM analysis is that it can be time-consuming and labor-intensive. Since, in most studies on emulsions via AFM, the imaging is performed under dry conditions (in the air mode), the droplets need to be deposited on a solid matrix by the Langmuir–Blodgett technique [93][49] and dehydrated before observation [88][44]. The process of depositing air-water or oil-water interfacial films onto a solid matrix is not only highly intricate and difficult but may also alter the native emulsion structure. However, the transfer process of air-water interfacial films is more convenient and operable compared to oil-water interfacial films. This has led to a greater focus on visualization studies of air-water interfacial films, while the oil-water interfaces are less explored. Therefore, there is an urgent need for new techniques that would allow for the direct in situ visualization of nanodroplet interfaces in liquid nanoemulsions. Using surface force apparatus in conjunction with atomic force microscopy can provide novel insights into the complexities of emulsion stabilization mechanisms [94][50]. Another downside of AFM lies in the fact that it does not provide information on the internal structure or composition of emulsion droplets, as it primarily focuses on surface topography. In addition, AFM measurements on nanodroplets present certain challenges related to the deformation of soft droplet surfaces, which may limit the accuracy of measuring mechanical properties and surface roughness of the droplets and lead to droplet damage during the probing process.2.2. Droplet Size Analysis
Droplet size is one of the most vital characteristics of emulsions, determining their stability and physicochemical properties. Emulsion droplet size and size distribution are typically analyzed by dynamic light scattering [95][51], small-angle X-ray scattering, ultrasonic spectrometry, or electrical pulse counting techniques [29,37][23][52] (Figure 81).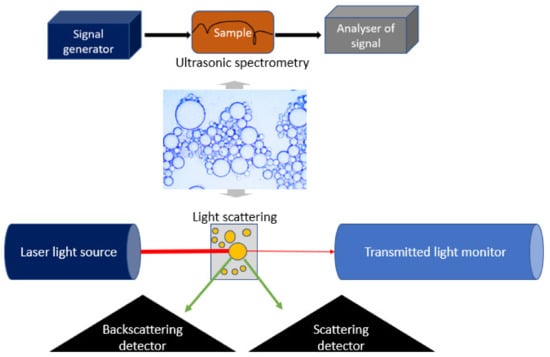
2.3. Determination of Emulsion Optical Properties
Since many applications require that emulsions are optically clear (e.g., eye drop formulations), transparency is an important parameter considered at the product development stage. Optical properties of emulsions, such as transparency, opacity, turbidity, and color, depend on the degree of absorption and scattering of light passing through the sample [41][71]. The changes in optical properties can be visually observed or quantitatively measured using colorimeters, refractometers, and UV–vis spectrophotometers. Colorimeters quantify parameters such as brightness, hue, and saturation, to measure the color and appearance of emulsions, while spectrophotometers measure the absorption and reflection of light by emulsions across a wide range of wavelengths. Spectrophotometers record the emulsion absorbance spectra by detecting the amount of light absorbed while passing through a sample. Refractometers are used to measure the refractive index of emulsions. The refractive index describes how fast light travels through the analyzed sample and is expressed as the ratio of the speed of light in a vacuum and the phase velocity of light in the assessed sample. The calculated value is compared to the refractive index of the reference medium, e.g., distilled water, which is considered the most transmittable liquid. If the refractive index of the emulsion is equal to or close to that of water (1.333), the emulsion is considered transparent [67,113][24][72]. Analysis of optical properties is non-destructive and can provide real-time monitoring of emulsion stability, making it a valuable tool in quality control and product development. As the appearance of emulsions is strongly influenced by droplet concentration, size, and distribution, measuring the optical properties of emulsions over time can provide information on destabilization processes occurring in the system [114][73]. For example, as the emulsion undergoes coalescence, the droplet size distribution changes, leading to alterations in the overall appearance of the emulsion. As larger droplets form due to coalescence, the emulsion becomes less transparent, more opaque, and turbid. Additionally, the color intensity may increase due to the merging of the droplets [77][33]. When flocculation occurs [115][74], the formation of flocs or droplet aggregates leads to increased light scattering and reduced transparency of the emulsion. This increase in light scattering contributes to the higher turbidity of the emulsion, making it appear cloudy or hazy. The color intensity of the emulsion may also change due to a different optical density or color of the flocs compared to the individual droplets. Similar changes can be observed when emulsion separates through Ostwald ripening. As Ostwald ripening progresses, the average droplet size in the emulsion increases, leading to changes in light scattering and absorption and a decrease in transparency.2.4. Rheological Analysis of Emulsions
The rheological properties and behavior of emulsions are key aspects that influence their stability, quality, and functionality in various applications [116][75]. Understanding the thixotropic behavior, viscoelastic properties, and shear thinning behavior of emulsions is essential for product formulation and development, achieving the desired functional attributes, and optimizing emulsion performance at different stages of manufacturing, processing, packing, and storage. Characterization of the rheological properties of emulsions plays a fundamental role in predicting their response to external conditions, such as pressure, temperature, and centrifugal force, routinely imposed on emulsions during technological operations, such as mixing, pumping, pouring, leveling, etc. [117][76]. Furthermore, the rheological properties of emulsions allow for monitoring their stability over time, which directly translates to their shelf-life. Quantitative analysis of emulsion rheological properties provides also important information about their visual and sensory properties, such as appearance, texture, creaminess, consistency, and mouthfeel [118][77], which represent important factors affecting the acceptance of commercial formulations by consumers and their preferences when choosing products. Rheological analysis of emulsions aims to determine the deformation and flow properties of emulsions under different conditions. The key parameters that determine the rheology of emulsions are the chemical composition and rheological properties of the continuous and dispersed phases, phase volume ratio, the structure of the emulsion including droplet size, concentration, and distribution, droplet characteristics, such as deformability, internal viscosity, and inter-droplet interactions (e.g., steric interactions, electrostatic repulsion, van der Waals attraction, as well other colloidal interactions within the emulsion system) [44][78], elasticity and composition of the interfacial layer including concentration and type of the emulsifier used to stabilize the droplets. Food emulsions vary greatly in terms of their rheological properties, from low-viscosity Newtonian liquids such as milk, through non-Newtonian, shear-thinning products that become less viscous under shear stress [119][79], such as peanut butter, concentrated tomato juice, or melted chocolate, to shear-thickening formulations, whose viscosity increases under shear stress, such as salad dressings, mayonnaise, or creams. Flow curves (also known as rheograms) offer important insights into the rheological behavior of emulsions. They are graphical representations of changes in the rheological behavior of the fluid subjected to changing shear rates. Flow curves depict the correlation between shear stress and shear rate, aiding in comprehending the flow characteristics of emulsions and defining their viscosity. Therefore, flow curves can indicate whether the emulsion displays Newtonian or non-Newtonian behavior. Additionally, flow curves help define emulsion resistance to flow, showcasing its capability to maintain structure under varying shear conditions, which is essential for establishing suitable processing conditions [119][79]. The rheological properties of emulsions are largely dependent on the nature and characteristics of the continuous phase, including its chemical composition, pH, and viscosity [120][80]. The viscosity of the continuous phase has a major impact on the gravitational separation of the emulsion [121][81]. More viscous continuous phases can hinder droplet movement, thereby inhibiting the creaming or sedimentation processes [88][44]. At the same time, lower mobility of the droplets may promote flocculation or coalescence, leading to increased instability of the emulsion. The rheological properties of emulsions can be altered by adding polymers or hydrocolloids, such as thickeners and texture modifiers (e.g., pectin, modified cellulose, gum arabic, corn fiber gum, modified starch, polysaccharide-protein complexes, etc.) [122][82]. Due to their high molecular weight, they exhibit a thickening effect and create a network that enhances emulsion stability by increasing its viscosity and the thickness of interfacial film [123][83]. As a result, hydrocolloid-stabilized emulsions display improved long-term stability compared to emulsions stabilized with proteins and small molecule surfactants [124][84]. Texture modifiers improve also the textural and functional attributes of emulsions, such as gelation dynamics, mechanical strength, and fracture properties. Other parameters that significantly impact the rheological behavior of emulsions include the concentration of the dispersed phase, the size, and distribution of the dispersed droplets, as well as the presence of solid particles [125][85]. At higher volume ratios, emulsions typically exhibit non-Newtonian behavior. Smaller droplets tend to decrease the viscosity of emulsions due to reduced interfacial area and improved packing efficiency. The reduction in viscosity is attributed to the decreased resistance to flow exhibited by the smaller droplets. Conversely, larger droplets lead to increased viscosity due to enhanced droplet interactions and a higher dispersed phase volume. The interactions between larger droplets result in higher resistance to flow, thus increasing the viscosity of the emulsion [126][86]. The presence of solid particles in particle-stabilized emulsions (also known as Pickering emulsions), such as nanoparticles, can significantly alter the rheology of the emulsion, influencing its flow behavior and overall texture. These particles can act as fillers or thickeners, contributing to increased emulsion viscosity and improved stability. The rheology of emulsions is strongly related to the structure, thickness, and elasticity of the adsorption layer at the interface between the dispersed and the continuous phase. The properties of the interface influence droplet size distribution, coalescence, and flocculation [37][23]. The interface layer shields the internal liquid from velocity gradients across the continuous phase. A thick and elastic interfacial layer creates strong steric hindrance, which is key for the stability of the emulsion [88][44]. Studies comparing the thickness of the interfacial films in emulsions stabilized by different types of surfactants revealed that the thickest interfacial layers are formed by hydrocolloids and solid particles (10 nm to several mm and 5–10 nm, respectively) followed by proteins (1–5 nm), while the thinnest layers are generated by low molecular weight surfactants (0.5–1 nm) [123][83]. Moreover, emulsions stabilized by multilayer adsorption films exhibit greater stability due to higher thickness compared to single-layer films [127][87]. The interfacial layer thickness is linked also to the concentration of the emulsifying agent. In general, at higher emulsifier concentrations, the adsorption layer at the interface becomes thicker and more rigid, leading to increased viscosity and elastic behavior of the emulsion. Another crucial aspect affecting emulsion rheological behavior and stability is the elasticity of the interfacial layer. More elastic interfacial films prevent the aggregation and coalescence of the droplets, resulting in improved long-term stability of emulsions [128][88]. On the other hand, a less elastic interfacial layer may intensify droplet coalescence and flocculation, thus reducing stability and increasing the viscosity of the emulsion. Higher elasticity of the adsorption layer contributes also to the viscoelastic behavior of emulsions. A more elastic adsorption layer can give the emulsion viscoelastic properties, such as shear-thinning. Conversely, if the relative rigidity of the interface is high, the rheological behavior of the emulsion may mimic a dispersion of solid particles [129][89]. The flow properties of emulsions can be divided into linear and non-linear [119][79]. The linear viscoelastic properties are measured within the range of stress, strain, and shear rates, in which the measured properties depend only on frequency and time (as well as temperature and pressure). These properties include the frequency-dependent storage and loss moduli, G’ and G”, the various combinations of these such as complex modulus G*, the phase lag, and the time-dependent creep compliance. Most emulsions, when subjected to shear stress, display rheological properties characteristic of both fluids and solids [118][77]. The storage (elastic) modulus G’ serves as an indicator of the elastic component within the viscoelastic behavior, reflecting the solid-state characteristics of the sample. The elastic modulus represents the stored energy in the emulsion, reflecting its ability to recover after deformation. In contrast, the loss (viscous) modulus G”, delineates the viscous component of the viscoelastic behavior, reflective of the liquid-state properties of the sample. The viscous modulus characterizes the deformation energy lost (dissipated) through internal friction during flow and flow resistance. Viscoelastic solids with G’ > G” have a higher storage modulus than loss modulus, whereas viscoelastic liquids with G” > G’ have a higher loss modulus than storage modulus. While, typically, these properties may not apply to high-stress technical applications, they are valuable for evaluating the microstructure and stability of emulsions [119][79]. The non-linear characteristics of emulsions include properties that are influenced by the applied stress, strain, or shear rate. These properties include the non-linear variations of the moduli and compliances, mentioned above, and viscosity. Viscosity is one of the most basic parameters describing the rheological properties of emulsions, which enables distinction between whether the analyzed sample is a classic (O/W) emulsion or reverse (W/O) emulsion. In general, low viscosity indicates O/W emulsion, while high viscosity indicates W/O emulsion [113][72]. The viscosity of emulsions can be measured with various types of viscometers, such as capillary, rotational, falling-ball, oscillatory, torque, and interfacial viscometers [33][90]. Based on the geometry of the measurement cell, rheometers can be divided into several categories including spindle, concentric cylinder, parallel plate (plate-plate), cone–cone, cone–plate, and spindle apparatuses, depicted in Figure 102 [129][89]. Dynamic shear rheometers, such as the Brookfield rotational rheometer, are the most frequently used devices for simple single-speed measurements of emulsion viscosity. This type of viscometer applies shearing deformation force and measures viscosity based on the torque required to rotate a spindle immersed in the fluid, which increases proportionally to the viscosity of the analyzed sample. It is worth mentioning that the rheological analysis of emulsions may be burdened with errors related to anomalies during measurements with rheometers and viscometers due to inertia and slip. To avoid false measurements, it is important to ensure that data is collected under conditions of constant shear rate. This requirement is typically met by small (<4 inches) cone-and-plate apparatuses or concentric cylinder geometries with a gap-to-radius ratio ≥ 0.95. When using geometries that do not meet this criterion, intermediate calculations should be performed before establishing an accurate viscosity–shear rate relationship [138][91].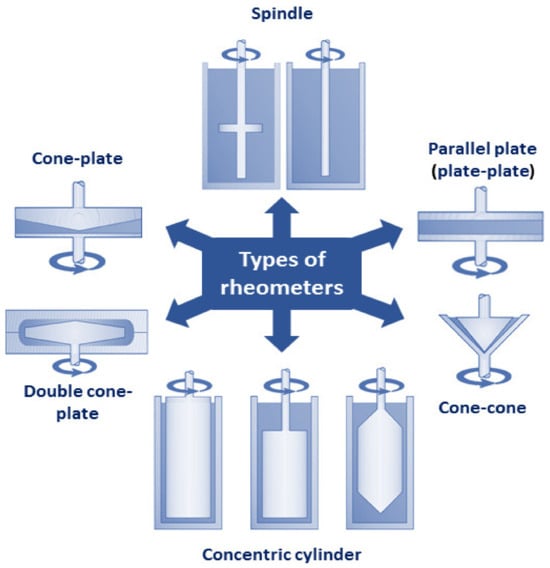
According to Stoke’s law, the resistance of the emulsion to instabilities caused by droplet flocculation becomes higher as its viscosity increases [37][23]. Nevertheless, the application of the Stokes equation to real-life emulsions is limited, as it assumes no interactions between droplets moving through the fluid. A more accurate method to establish emulsion zero-shear viscosity is based on the experimental determination of changes in emulsion viscosity under different levels of shear stress. In this approach, the range of zero-shear stress viscosity is identified based on the flow curves depicting the correlation between viscosity and shear stress. The rheological properties of emulsions are strongly related to their stability. Depending on the nature and mechanism of destabilization processes occurring in the system, emulsion rheology can be affected in numerous ways. Separation of the emulsion through flocculation tends to increase its relative viscosity due to the entrapment of liquid within droplet flocs, and an increase in floc volume fraction compared to single droplets. On the other hand, coalescence and Ostwald ripening may reduce the relative viscosity, especially in high-volume fraction emulsions. Phase inversion leads to a substantial decrease in emulsion viscosity due to the drastically reduced volume of the dispersed phase after inversion. The reduction results from the fact that the volume of the continuous phase (which becomes the dispersed phase after the inversion) is typically lower than the volume of the dispersed phase. However, correlating rheological parameters to emulsion breakdown phenomena has been challenging due to the complexity and overlapping timing of multiple separation processes. Therefore, changes in the rheological behavior of emulsions may not directly relate to their stability. As a result, rheological analysis alone cannot provide a reliable prediction of long-term emulsion stability.
2.5. Determination of Zeta Potential
The droplets of most emulsions are electrically charged due to the adsorption of charged or ionizable emulsifier molecules to their surface [28][69]. The charge of a droplet is determined by the type and concentration of adsorbed molecules, as well as the pH and composition of the continuous phase, particularly the presence of other charged species, such as ions or macromolecules [144][99]. The most commonly analyzed parameter describing droplet surface charge is the ζ potential (zeta potential), defined as the potential difference between the charged droplet surface and the continuous phase. The interaction between droplets and surrounding ions plays a crucial role in determining the stability and behavior of emulsions over time [88][44]. As a result, zeta potential serves as a quantitative measure that allows the prediction and tracking of emulsion stability [139][100]. A higher zeta potential value signifies stronger repulsive electrostatic forces between the droplets [145][101]. These repulsive forces prevent the coalescence and flocculation of droplets and thereby ensure their uniform dispersion within the emulsion [146][102], which translates to enhanced stability of the emulsion [120][80]. In general, a high negative or positive zeta potential (±30 mV) indicates a stable emulsion [140][103], whereas zeta potential values approaching zero indicate unstable systems [141][147][104][105]. Stabilization of such systems can be achieved by the addition of charged molecules. For example, it has been demonstrated that unstable emulsions of rice bran protein-stabilized emulsions could be effectively stabilized by incorporating (+)-catechin in the formulation [148][106]. At the same time, the presence of the electrolytes with an opposite charge to the droplet surface charge in the continuous phase can neutralize the droplet surface potential, leading to the flocculation of the droplets and destabilization of the emulsion [149][107]. It is worth noting that zeta potential can also impact the molecular mass distributions of nanoemulsions—those with higher zeta potentials are electrically stabilized and display better physical stability by resisting coagulation or flocculation. Emulsion zeta potential can be measured with micro-electrophoretic analyzers, such as Zeta PALS [142][108] or Malvern Zetasizer [143][109]. These analyzers estimate zeta potential based on the electrophoretic mobility of emulsion droplets under an electric field. The direction of droplet movement is used to determine the sign of the electrical charge, while the velocity of the movement gives information on the magnitude of the electrical charge at the droplet surface. Emulsion droplet surface charge influences ion distribution around it, creating an electrical double layer. The charged droplet surface attracts counter-ions from the solution, forming a surface potential that decreases with increasing distance. As a result, the droplets in liquid emulsions, are surrounded by the electric double layer composed of an inner layer of tightly bound ions and an outer layer of loosely associated ions (diffuse layer), [16]. As the emulsion droplet moves, ions within the boundary move with it, while those beyond the boundary remain in the bulk dispersion. The interface between stationary and diffuse layers of counter-ions is called the “shear plane”, and its potential is the zeta potential.2.6. Determination of Emulsion pH
The pH of emulsions can significantly affect their interfacial composition, stability, and aging [150][110]. The impact of pH on emulsion stability is ascribed to the ionization of polar groups in charged molecules present in the emulsion, such as surfactant molecules, ions, and electrolytes, which can generate electrostatic forces able to disrupt the interfacial layer [151][111]. Changes in pH alter surface droplet charge and electrostatic repulsion between the droplets and therefore have a fundamental effect on the zeta potential of the emulsion. Optimizing pH allows improvement in emulsion stability by preventing droplet coalescence and flocculation [152][112]. It is worth noting that even slight changes in pH may significantly alter the stability of the emulsion. For example, it has been shown that, when milk is heated to temperatures above 70°C at a pH of 6.5, a large fraction of denatured whey proteins is linked to casein micelles [153][113]. This interaction occurs through the creation of disulfide-linked complexes with κ-casein located on the micelle surface. However, at a higher pH value of 6.7, the extent of this association decreases and only about 30% of denatured whey proteins are connected to the surface of the casein micelles. pH has a particularly pronounced effect on the stability of protein-stabilized emulsions. pH values impact the ionization degree and solubility of protein emulsifiers. When the pH of a protein-stabilized emulsion is far from the isoelectric point of the emulsifier, the protein molecules on the droplet surface exhibit a higher potential value. This results in higher zeta potential and increases repulsive force between the droplets, effectively preventing their flocculation and coalescence. Conversely, under pH conditions near the isoelectric point of the protein, the droplet surface potential becomes close to zero, leading to the destabilization of the emulsion [147][105].2.7. Determination of Emulsion Electrical Conductivity
Electrical conductivity plays a crucial role in characterizing emulsions, providing essential information about their stability, composition, and flow properties [154][114]. The electrical conductivity of emulsions can be measured using a conductivity meter or probe, which is inserted into the emulsion sample to determine its ability to conduct an electric current [71,155][28][115]. Conductivity measurements can be used to investigate the interactions between surfactants, predict emulsion long-term stability, and comprehend the mechanism of emulsion separation [155][115]. Typically, higher concentrations and increased charge density of surfactants lead to higher electrical conductivity of the emulsion. The heightened electrical conductivity contributes to the development of electric double layers surrounding the droplets, acting as a barrier against droplet flocculation and coalescence. In consequence, emulsions exhibiting elevated electrical conductivity display enhanced stability [119][79]. Additionally, the introduction of conductive materials, such as carbon nanotubes, to emulsions can augment both their electrical conductivity and stability [156][116]. Tracing changes in the conductivity of emulsions containing different types and concentrations of emulsifiers, salts, or other conductive materials allows rapid prediction of emulsion stability.2.8. Thermal Properties Analysis
Thermal characteristics of emulsions play a pivotal role in delineating their stability and functionality. These properties encompass heat capacity, thermal conductivity, and heat transfer coefficient. Various factors influence the thermal properties of emulsions, including the thermal attributes and composition of both the continuous and dispersed phases (e.g., surfactant concentration, presence of ions and additives), as well as droplet size and size distribution [157][117]. Smaller droplets, characterized by a higher surface area-to-volume ratio, facilitate improved heat transfer within the emulsion [158][118], while larger droplets impede heat transfer, resulting in diminished thermal conductivity. Nonetheless, the overall thermal properties of the emulsion hinge significantly on the relative thermal conductivity of the dispersed phase in comparison to the continuous phase [157][117]. The effective medium theory offers a means to estimate the thermal conductivity of emulsions. In the case of spherical dispersed particles, such as droplets in water-in-oil emulsions, this theory simplifies to the Maxwell–Garnett equation:
2.9. Accelerated Stability Testing
Accelerated stability testing is employed for rapid analysis of emulsion stability to predict the shelf-life of emulsion-based products and ensure that they maintain their desired properties over time [164][124]. Acceleration tests can reveal any changes in the emulsion properties and the occurrence of separation processes such as creaming, sedimentation, and coalescence within a shorter time frame. This enables researchers and manufacturers to quickly optimize formulation composition and processing parameters and allows more efficient product development [165][125]. To accelerate an emulsion instability, it is subjected to mechanical or thermal stress such as heating, centrifugation, shaking, or stirring. These processes provide stimuli, which aim to simulate environmental stresses that may affect emulsion properties during manufacturing, processing, packing, transport, or long-term storage. The most widely used mechanical stress test involves subjecting emulsion samples to centrifugation [166][126]. The centrifugation test can be applied to separate fluid emulsions under a wide range of forces. It is advisable to run samples at various rates of centrifugation to determine rate constants for the process and extrapolate centrifugal forces to gravity [167][127]. Estanqueiro et al. [168][128] employed a centrifugal test to assess the stability of the emulsions by subjecting them to three 30-minute cycles of centrifugation at 3000 rpm. The samples were then examined for signs of coalescence or phase separation. In a recent study, Kasprzak et al. [120][80] conducted the centrifugal test on oil-in-water emulsions stabilized by whey protein at a speed of 10,000 rpm for 30 min. This study showed that the barrier formed at the droplet interface was able to effectively resist coalescence, even under intense centrifugal forces. Nevertheless, this observation did not provide information regarding the duration over which stability could be maintained. Therefore, this method should be accompanied by other analytical methods for the assessment of emulsion stability. Thermal stress has a far greater influence on the stability of emulsions than mechanical stress. This is due to a simple relationship between the temperature and a rate constant for the chemical reaction described by the Arrhenius equation [169][129]. The temperature might induce changes in the viscosity of the dispersed and continuous phases, droplet solubility, partitioning of molecules at the interface, hydration of polymers or colloids, etc. A common thermal stress accelerated stability test relies on subjecting emulsion samples to cooling–heating cycles, where temperature changes between 4°C and 40°C every 24 h for 7 days [168][128]. A different approach, known as the freeze-thaw cycle test, involves four cycles of temperature changes between −5°C and 40°C every 24 h [170][130]. In addition to thermal fluctuation, in the freezing stage water is transformed into ice crystals. Therefore, when performing the test, we should consider several factors such as (i) concentration and solidification of free liquid water, (ii) content and precipitation of dissolved substances, and (iii) disruption of the emulsifier layer by ice crystals [167][127].2.10. Fourier-Transform Infrared Spectroscopy (FTIR) Analysis
Fourier-transform infrared (FTIR) spectroscopy is a powerful technique used to investigate the molecular structure and composition of emulsions [171][131]. It allows researchers to study the vibrational modes of emulsion components, such as water, oil, and surfactants, in great detail, providing insights into their structural organization at the molecular level. This technique can be employed to analyze functional groups and chemical bonds present in emulsions that reveal information about their stability, interfacial properties, and potential interactions with other ingredients [171][131]. FTIR analysis has substantial utility in studying the phase behavior of emulsions; it can elucidate phenomena such as the formation and disruption of droplets, while also casting light on how different processing conditions impact the overall structure and stability of an emulsion [171][131]. The spectra obtained via FTIR are especially instructive regarding molecular interactions within an emulsion system by revealing details like hydrogen bonding patterns or significant intermolecular forces [172][132]. Furthermore, FTIR enables precise identification and quantification of specific components or contaminants within emulsions, such as oxidation products [173][133] or trace impurities. Attenuated total reflection FTIR spectroscopy (FTIR-ATR) has emerged as an indispensable tool for the precise identification of characteristic absorption bands within the diverse components of emulsions. This analytical technique has unveiled intriguing aspects of emulsion behavior. For example, the phenomenon of inducing subtle alterations in the secondary structures of proteins in water-in-oil (W/O) emulsions was discerned through this method [174][134]. FTIR-ATR has further been employed to investigate the distinct states of water in emulsions [175][135], pinpoint signals emanating from bulk water and the water residing within the interfacial layer of reverse micelles [176][136], and scrutinize the water structure near the surface of nanoparticles in W/O emulsions [20]. Notably, FTIR-ATR studies have shed light on the interaction between emulsifiers and water molecules within the interfacial layers of W/O emulsions, disrupting the hydrogen bonding network and thus impeding the coalescence of water droplets [177][137]. Additionally, the impact of the concentration of emulsifiers on emulsion stability has been thoroughly examined, with the -OH stretching vibration band serving as a sensitive indicator of the molecular interactions critical for stabilizing W/O emulsions [178][138]. FTIR-ATR spectroscopy has also proven useful for direct measurements of chemical changes occurring during lipid oxidation in complex food matrices without the need for the extraction of the fat phase [179][139].2.11. Raman Spectroscopy Analysis
Raman spectroscopy offers an innovative approach to characterization of emulsion composition and structure. Falling under the umbrella of vibration spectroscopy, Raman spectroscopy exposes a sample to an intense light beam, typically generated by a laser. The resulting spectrum, capturing the Raman-active vibration modes induced in the sample’s molecules, is obtained through the analysis of inelastically scattered photons [94][50]. The intricacies of the process involve an inelastic collision between incident photons and the molecules within the sample. Consequently, the vibrational or rotational energy of the molecules changes, causing a shift in the scattered radiation to a different wavelength, known as a Raman shift [180][140]. It is well established that specific chemical bonds (such as C=C, C–H, C=O, and others) produce distinctive Raman shifts, making Raman spectroscopy an effective technique for investigating molecular structures [181][141]. This technique stands out for its high precision, rapidity, and noninvasiveness. Emulsions, which are often water-based systems, might generate a broad water background signal when infrared spectroscopy is used. As the Raman signal of water is low (at least at low wavenumbers), the unsaturated C=C bonds, found in oils, have a strong and sharp Raman response, making Raman spectroscopy a perfect method for the analysis of emulsion systems [182][142]. Due to the excellent functionality of Raman spectroscopy, it can be applied in (i) monitoring or mapping the components, droplets, or structure of emulsions, (ii) measuring the formation and destabilization of emulsions, (iii) tracking the changes in the emulsion structure during fabrication, processing, and storage, (iv) monitoring the emulsion polymerization reactions or other types of reactions involving emulsions. Raman spectroscopy is particularly useful in designing emulsions with tailored functionalities and optimizing formulation compositions. It can serve as a valuable tool for tracking changes in molecular structures of stabilizers at various concentrations or different manufacturing/processing conditions, and identification of functional groups involved in maintaining emulsion stability. A study by Wu et al. [185][143] investigated oil-rich emulsions stabilized with a protein emulsifier that were subjected to 1, 2, or 3 hours of enzymatic hydrolysis. Raman spectral data demonstrated that, as the hydrolysis time increased, emulsion stability decreased due to aggregation of emulsifier molecules via SS bonds or lipid-protein interactions. Emulsion polymerization is a primary reaction in the polymer industry. Controlling polymerization reactions online is crucial for implementing closed-loop monitoring strategies, enabling the production of polymers with precise microstructures. In the study by Dropsit et al. [187][144], the styrene emulsion polymerization was controlled online using the 1000 cm−1 reference band to assess the monomer conversion rate, the integrated intensity, wavenumber, position, and half-width at half maximum of the peak. Performing chemometric data analysis on Raman spectra allows for the calculation of various reaction performance metrics, such as polymer conversion rate and the ratio of polymers to remaining monomers [182][186][142][145]. Elizalde et al. utilized Raman spectroscopy to monitor emulsion polymerization reactions. Results showed that the instantaneous conversion and free monomer concentrations were better estimated by Raman spectroscopy than by the calorimetry method. Raman spectroscopy can be combined with microscopy techniques, such as optical or confocal microscopy, by integrating a Raman spectrometer into the microscope to achieve even more detailed characterization of emulsions. Raman imaging allows for the chemical analysis of the sample, integrating spectral data with spatial information. Raman spectra are obtained by scanning individual points within a defined area, adding spatial information to the spectral data. This involves directing a laser at specific points on the sample as it moves under the laser in small increments until the mapping of the entire area of interest is completed. The resulting spatial data can be one-, two-, or three-dimensional, allowing for detailed chemical analysis of the sample. Raman imaging can be employed to address analytical questions regarding the distribution of emulsion components and the presence of contaminants or other analytes. A study by Wei et al. [183][146] investigated the food-grade Pickering emulsions stabilized by ovotransferrin (OVT) fibrils using Raman imaging. They used the Raman intensity mapping of the emulsion droplets and confirmed the presence of OVT fibrils at the emulsion interface. Another study showed the effect of L-arginine and L-lysine on the solubility of myofibrillar protein, myosin, revealing a partial unfolding of protein molecules, leading to higher negative surface charge and improved solubility [184][147].2.12. Photon Density Wave (PDW) Spectroscopy Analysis
Photon Density Wave (PDW) spectroscopy is a laser-based in-line process analytic technique capable of measuring the scattering and absorption of light by emulsion droplets. PDW technique enables the analysis of highly turbid and concentrated emulsion samples without the need for dilution or calibration. It can independently measure different optical properties of emulsions, expressed as the reduced scattering coefficient and absorption coefficient. A key requirement for accurate measurement is significant light scattering by the sample (reduced scattering coefficient µs’ > 0.05 mm−1) and the absorption of the sample markedly lower than the scattering (absorption coefficient µa << µs’) [188][148]. Independent measurement of light absorption and scattering allows simultaneous monitoring of several processes within the system such as bacteria growth and changes in nutrient concentration [190][149]. The absorption coefficient reflects the chemical composition of the emulsion, while the reduced scattering coefficient is related to the size, concentration, and morphology of dispersed particles, droplets, or cells. During PDW analysis, light is delivered using a point-like light source (an optical fiber) into a sample exhibiting strong light scattering and low absorption. As a result of light absorption and multiple scattering, a photon density wave forms within the dispersion. The amplitude and phase shifts of the photon density wave are experimentally determined as functions of emitter/detector-fiber distance and modulation frequency. Particle sizes can be derived from the reduced scattering coefficient based on Mie theory and dependent light scattering theory. PDW spectroscopy allows real-time particle size analysis within a diameter range spanning from approximately 50 nm to 500 µm [191][150]. Thus, this method can be used to monitor the droplet size of nanoemulsions or Pickering particles’ behavior during formulation and storage. A study by Bressel et a. [192][151] showed the capability of PDW spectroscopy in measuring the droplet size over a wide range from nanometer to micrometer scale during the phase inversion temperature emulsification. PDW spectroscopy can be applied to monitor different stages of emulsion fabrication or emulsion polymerization reactions and track the development of emulsion instabilities in real time. Bressel et al. [197][152] successfully applied PDW spectroscopy to determine droplet size and investigate flocculation processes in concentrated vegetable oil-in-water emulsions (with high-volume fractions of oil ϕ = 0.05–0.40) stabilized with Polysorbate 80. Continuous monitoring of non-diluted emulsion samples revealed that the absorption coefficient μa and the reduced scattering coefficient μs′ remained constant over 60 hours, confirming the emulsion stability. Adding a nonabsorbing polymer (xanthan) to the emulsion, induced a rapid decrease in μs′ due to flocculation. A recent application of PDW spectroscopy includes the real-time monitoring of latex-particle size during emulsion polymerizations with a high polymer content exceeding 60%. PDW spectroscopy may contribute to a better understanding of emulsion formation and separation phenomena and allow the development of strategies for the optimization of process conditions that can be incorporated into production lines.2.13. Emulsion Texture Analysis
Texture profile analysis has been widely utilized within the food industry to determine and enhance the sensory and textural attributes of emulsion-based products [194][153]. Texture analysis allows the quantification of attributes, such as resilience, chewiness, gumminess, springiness, and cohesiveness [195,196][154][155]. The devices commonly used for the measurement of emulsion textural properties are texture analyzers. Texture analyzers are equipped with a load arm, connected to an appropriate probe. By setting up an appropriate probe type and speed, as well as deformation depth, time, and cycle duration, texture analyzers can generate graphs of the signal of force vs. length work, based on which the textural parameters of the emulsion can be calculated [198][156]. For instance, firmness is determined as the initial slope of the penetration profile [199][157]. The penetration or double compression tests are usually used to characterize the strength of emulsions [95][51], which are particularly useful for the determination of emulsion texture changes during storage. A lack of changes in the texture profile of emulsions confirms their stability in terms of compression parameters. The texture of emulsion-based products can be improved by incorporating texture-modifying ingredients into the water or oil phase. Based on molecular origin and functionality, texture modifiers can be categorized as thickening agents or gelling agents. The thickening agents derive their functionality from extended molecular conformation while gelling agents owe their thickening properties to intermolecular cross-linking. However, in practice, this distinction is often blurred, as thickening agents can form gels at high concentrations, and gelling agents can increase emulsion viscosity without gel formation at low concentrations. Texture modifiers added to food emulsions can also enhance their stability by slowing down the movement of droplets [197][152].2.14. Oxidation
Emulsions play a pivotal role in the manufacturing of a diverse array of food products. Nonetheless, the widespread utilization of emulsions across different food industry sectors is constrained by the susceptibility of lipids to oxidation during various stages of emulsion manufacturing, processing, packaging, or storage [166,200,201][126][158][159]. The lipid oxidation processes tend to progress more rapidly within emulsions than in neat oils. This increased susceptibility to oxidation can be attributed to the higher area of oil exposed to oxygen and the conditions under which emulsification occurs. During emulsification, the oil phase may be exposed to elevated temperatures, intensifying the rate of oxidative processes, or vigorous mixing introducing air into the sample. In cases where sonication is used as the emulsification method, acoustic cavitation can directly generate free radicals, increasing oxidative stress. [202][160]. As lipid oxidation is inherently an interfacial phenomenon, it is primarily initiated at the interface between the oil and water phases [203][161]. The interface serves as a site where unsaturated fatty acids within the oil phase can interact with pro-oxidants (e.g. metal ions) present in the aqueous phase (Figure 143). The enlargement of the interfacial area between the oil and aqueous phases, which occurs during emulsification, results in an amplified frequency of interactions between these reactive species and lipid molecules. This, in turn, is likely to accelerate the rate of lipid oxidation [204][162]. Since pro-oxidants and oxygen must traverse through the aqueous phase to access the oil-water interface, the extent of oxidation is markedly influenced by their solubility in the aqueous phase, as well as their mobility, and mass transfer rates [205][163]. Lipid oxidation most commonly occurs through autoxidation, a reaction between free lipid radicals and oxygen, or through photooxidation from exposure to light in the presence of photosensitizers. Autoxidation is initiated by initiators such as metal ions, heat, or existing lipid radicals, leading unsaturated fatty acids to form alkyl radicals (L·). These alkyl radicals react with oxygen to produce peroxyl radicals (LOO·), which then combine with new unsaturated fatty acids to form lipid hydroperoxides and generate new lipid radicals. This chain reaction can continue until two free radicals join and create a nonradical product. Lipid hydroperoxides are considered the primary oxidation products and are nonvolatile, thus odorless and tasteless. They can decompose into secondary oxidation products including volatile aldehydes, and ketones, which often cause off-odors and flavors of emulsion-based food products.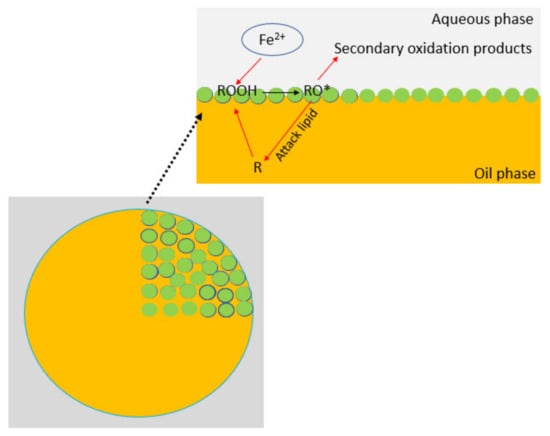
2.15. In Vitro Digestion
From the standpoint of the food and pharmaceutical industries, one of the pivotal characteristics of emulsion-based products is their behavior in the human gastrointestinal tract (GIT). Within the pharmaceutical sector, emulsions are commonly applied as delivery systems for drugs, non-polar lipids, vitamins, nutraceuticals, and other bioactive compounds. The primary objective is to encapsulate these components in emulsion droplets to increase their bioavailability or ensure their release at specific target sites within the gastrointestinal tract. Ideally, the digestion and absorption of these products in the GIT tract should be evaluated through human feeding trials. However, this is often impractical due to financial constraints, time limitations, and ethical considerations. In vitro digestion models have been developed as a substitute for studying the fate of foods in the gastrointestinal tract [210][168]. To date, a variety of in vitro digestion models designed to simulate the processes occurring inside the human GIT have been developed [211][169]. In vitro digestion models can be categorized into single- and multiple-step models. The single-step models simulate a specific region of GIT, such as the mouth, stomach, small intestine, or colon [120][80]. An example of this kind of model is the pH-stat method, which exclusively emulates the digestive processes occurring in the small intestine [214][170]. The pH-stat titration technique is a traditional method used to monitor the intestinal phase of lipid digestion. It entails maintaining the pH of the formulation constant as it comes into contact with a mixture of digestive fluids, while the enzyme-substrate reaction tends to change it. As a result, the quantity of titrant added during the experiment correlates with the rate of lipolytic reactions. The multiple-step models aim to simulate two or more regions of the GIT [215,216][171][172]. Irrespective of the chosen approach, the formulation is subjected to one or more treatments intended to mimic specific regions within the human digestive tract. These treatments often entail the blending of the food sample with simulated digestive fluids characterized by specific compositions, including pH, mineral constituents, enzyme activity, and other relevant factors, all carried out under controlled mixing and temperature conditions [217,218,219][173][174][175].In recent years, several different in vitro digestion protocols have been created to investigate how emulsion-based products and their components behave within the GIT. These protocols vary slightly in terms of reagents and conditions used to mimic the environment of human GIT. As a result, comparing results from different studies is challenging. To overcome this issue an international consortium introduced INFOGEST, a standardized in vitro digestion model that is now widely applied across food, nutritional, and pharmaceutical research fields. INFOGEST model simulates the physicochemical processes occurring inside the mouth, stomach, and small intestine. One notable distinction between INFOGEST and earlier models is its utilization of different concentrations of digestive enzymes, bile salts, and calcium ion levels. Recently, the INFOGEST model has been successfully validated when compared to human and animal models. This in vitro method has proven useful for the characterization of the food matrices within a simulated digestion environment [216][172], and advancing our understanding of emulsion behavior during the digestive process [217][173].
References
- Kupikowska-Stobba, B.; Grzeczkowicz, M.; Lewińska, D. A one-step in vitro continuous flow assessment of protein release from core-shell polymer microcapsules designed for therapeutic protein delivery. Biocybern. Biomed. Eng. 2021, 41, 1347–1364.
- McClements, D.J. Food Emulsions: Principles, Practices, and Techniques, 3rd ed.; CRC Press: Boca Raton, FL, USA, 2015; pp. 1–676.
- Kasprzak, M.M.; Macnaughtan, W.; Harding, S.; Wilde, P.; Wolf, B. Stabilisation of oil-in-water emulsions with non-chemical modified gelatinised starch. Food Hydrocoll. 2018, 81, 409–418.
- Hu, X.; McClements, D.J. Construction of plant-based adipose tissue using high internal phase emulsions and emulsion gels. Innov. Food Sci. Emerg. Technol. 2022, 78, 103016.
- Ataeian, P.; Aroyan, L.; Parwez, W.; Tam, K.C. Emulsions undergoing phase transition: Effect of emulsifier type and concentration. J. Colloid Interface Sci. 2022, 617, 214–223.
- Tan, Y.; Lee, P.W.; Martens, T.D.; McClements, D.J. Comparison of Emulsifying Properties of Plant and Animal Proteins in Oil-in-Water Emulsions: Whey, Soy, and RuBisCo Proteins. Food Biophys. 2022, 17, 409–421.
- Lee, J.; Wi, G.; Choi, M.J. The rheological properties and stability of gelled emulsions applying to κ-carrageenan and methyl cellulose as an animal fat replacement. Food Hydrocoll. 2023, 136, 108243.
- Yang, F.S.; Caldwell, K.D.; Myers, M.N.; Giddings, J.C. Colloid characterization by sedimentation field-flow fractionation. III. Emulsions. J. Colloid Interface Sci. 1983, 93, 115–125.
- Sanka, I.; Bartkova, S.; Pata, P.; Smolander, O.P.; Scheler, O. Investigation of Different Free Image Analysis Software for High-Throughput Droplet Detection. ACS Omega 2021, 6, 22625–22634.
- Kasprzak, M.M.; Sady, M.; Kruk, J.; Bartkova, S.; Sanka, I.; Scheler, O.; Jamróz, E.; Berski, W.; Onacik-Gür, S.; Szram, R.; et al. Replacement of milk fat by rapeseed oil stabilised emulsion in commercial yogurt. PeerJ 2023, 11, e16441.
- Sanka, I.; Bartkova, S.; Pata, P.; Ernits, M.; Meinberg, M.M.; Agu, N.; Aruoja, V.; Smolander, O.-P.; Scheler, O. User-friendly analysis of droplet array images. Anal. Chim. Acta 2023, 1272, 341397.
- Qiu, L.; Zhang, Y.; Long, X.; Ye, Z.; Qu, Z.; Yang, X.; Wang, C. Scanning Electron Microscopy Investigation for Monitoring the Emulsion Deteriorative Process and Its Applications in Site-Directed Reaction with Paper Fabric. Molecules 2021, 26, 6471.
- Fischer, P.; Windhab, E.J. Rheology of food materials. Curr. Opin. Colloid Interface Sci. 2011, 16, 36–40.
- Zhou, B.; Drusch, S.; Hogan, S.A. Confined flow behavior under high shear rates and stability of oil/water high internal phase emulsions (HIPEs) stabilized by whey protein isolate: Role of protein concentration and pH. Food Res. Int. 2022, 160, 111674.
- Alade, O.S.; Mahmoud, M.; Al Shehri, D.A.; Sultan, A.S. Rapid Determination of Emulsion Stability Using Turbidity Measurement Incorporating Artificial Neural Network (ANN): Experimental Validation Using Video/Optical Microscopy and Kinetic Modeling. ACS Omega 2021, 6, 5910–5920.
- Ravindran, S.; Williams, M.A.K.; Ward, R.L.; Gillies, G. Understanding how the properties of whey protein stabilized emulsions depend on pH, ionic strength and calcium concentration, by mapping environmental conditions to zeta potential. Food Hydrocoll. 2018, 79, 572–578.
- Gerzhova, A.; Mondor, M.; Benali, M.; Aider, M. Study of total dry matter and protein extraction from canola meal as affected by the pH, salt addition and use of zeta-potential/turbidimetry analysis to optimize the extraction conditions. Food Chem. 2016, 201, 243–252.
- Dalmazzone, C.; Noïk, C.; Clausse, D. Application of DSC for Emulsified System Characterization. Oil Gas Sci. Technol.—Rev. D’ifp Energ. Nouv. 2009, 64, 543–555.
- Reiner, J.; Ly, T.T.; Liu, L.; Karbstein, H.P. Melt Emulsions: Influence of the Cooling Procedure on Crystallization and Recrystallization of Emulsion Droplets and their Influence on Dispersion Viscosity upon Storage. Chem. Ing. Tech. 2022, 94, 356–364.
- Nickolov, Z.S.; Paruchuri, V.; Shah, D.O.; Miller, J.D. FTIR–ATR studies of water structure in reverse micelles during the synthesis of oxalate precursor nanoparticles. Colloids Surf. A Physicochem. Eng. Asp. 2004, 232, 93–99.
- Hou, F.; Yang, S.; Ma, X.; Gong, Z.; Wang, Y.; Wang, W. Characterization of Physicochemical Properties of Oil-in-Water Emulsions Stabilized by Tremella fuciformis Polysaccharides. Foods 2022, 11, 3020.
- Ghasemi, H.; Darjani, S.; Mazloomi, H.; Mozaffari, S. Preparation of stable multiple emulsions using food-grade emulsifiers: Evaluating the effects of emulsifier concentration, W/O phase ratio, and emulsification process. SN Appl. Sci. 2020, 2, 1–9.
- Hu, Y.T.; Ting, Y.; Hu, J.Y.; Hsieh, S.C. Techniques and methods to study functional characteristics of emulsion systems. J. Food Drug Anal. 2017, 25, 16–26.
- Akhter, S.; Jain, G.K.; Ahmad, F.J.; Khar, R.K.; Jain, N.; Khan, Z.I.; Talegaonkar, S. Investigation of Nanoemulsion System for Transdermal Delivery of Domperidone: Ex-vivo and in vivo Studies. Curr. Nanosci. 2008, 4, 381–390.
- Medina, S.C.; Anjum, D.H.; Behzad, A.R.; Vilagines, R.D.; Tabatabai, A.; Leiknes, T.O. Microscopy techniques applied to submicron characterization of oilfield produced water. J. Pet. Sci. Eng. 2021, 206, 108930.
- Bellalta, P.; Troncoso, E.; Zúñiga, R.N.; Aguilera, J.M. Rheological and microstructural characterization of WPI-stabilized O/W emulsions exhibiting time-dependent flow behavior. LWT-Food Sci. Technol. 2012, 46, 375–381.
- Bartkova, S.; Vendelin, M.; Sanka, I.; Pata, P.; Scheler, O. Droplet image analysis with user-friendly freeware CellProfiler. Anal. Methods 2020, 12, 2287–2294.
- Binks, B.P.; Dong, J. Emulsions and equilibrium phase behaviour in silicone oil + water + nonionic surfactant mixtures. Colloids Surf. A Physicochem. Eng. Asp. 1998, 132, 289–301.
- Ishibashi, C.; Hondoh, H.; Ueno, S. Influence of morphology and polymorphic transformation of fat crystals on the freeze-thaw stability of mayonnaise-type oil-in-water emulsions. Food Res. Int. 2016, 89, 604–613.
- Saffarionpour, S.; Diosady, L.L. Delivery of Ferric Sodium EDTA by Water-in-Oil-in-Water (W1/O/W2) Double Emulsions: Influence of Carrier Oil on its In Vitro Bioaccessibility. Food Bioprocess Technol. 2022, 15, 421–439.
- Sikorska, E.; Khmelinskii, I.; Sikorski, M. Fluorescence spectroscopy and imaging instruments for food quality evaluation. In Evaluation Technologies for Food Quality; Woodhead Publishing: Cambridge, UK, 2019; pp. 491–533.
- Klymchenko, A.S.; Roger, E.; Anton, N.; Anton, H.; Shulov, I.; Vermot, J.; Mely, Y.; Vandamme, T.F. Highly lipophilic fluorescent dyes in nano-emulsions: Towards bright non-leaking nano-droplets. RSC Adv. 2012, 2, 11876–11886.
- Thijssen, J.H.J.; Schofield, A.B.; Clegg, P.S. How do (fluorescent) surfactants affect particle-stabilized emulsions? Soft Matter 2011, 7, 7965–7968.
- Yu, D.; Li, G.; Liu, W.; Li, Y.; Song, Z.; Wang, H.; Guan, F.; Chen, X. A fluorescent pickering-emulsion stabilizer prepared using carbon nitride quantum dots and laponite nanoparticles. Colloids Surf. A Physicochem. Eng. Asp. 2019, 563, 310–317.
- Klang, V.; Matsko, N.B.; Valenta, C.; Hofer, F. Electron microscopy of nanoemulsions: An essential tool for characterisation and stability assessment. Micron 2012, 43, 85–103.
- Saupe, A.; Gordon, K.C.; Rades, T. Structural investigations on nanoemulsions, solid lipid nanoparticles and nanostructured lipid carriers by cryo-field emission scanning electron microscopy and Raman spectroscopy. Int. J. Pharm. 2006, 314, 56–62.
- Dudkiewicz, A.; Tiede, K.; Loeschner, K.; Jensen, L.H.S.; Jensen, E.; Wierzbicki, R.; Boxall, A.B.; Molhave, K. Characterization of nanomaterials in food by electron microscopy. TrAC Trends Anal. Chem. 2011, 30, 28–43.
- Rosso, A.; Lollo, G.; Chevalier, Y.; Troung, N.; Bordes, C.; Bourgeois, S.; Maniti, O.; Granjon, T.; Dugas, P.-Y.; Urbaniak, S.; et al. Development and structural characterization of a novel nanoemulsion for oral drug delivery. Colloids Surfaces A Physicochem. Eng. Asp. 2020, 593, 124614.
- Review of Nanoemulsion Formulation and Characterization Techniques: EBSCOhost n.d. Available online: https://web.s.ebscohost.com/ehost/detail/detail?vid=0&sid=e1eaf248-dc1e-4691-9a8b-06cc757ccad8%40redis&bdata=Jmxhbmc9cGwmc2l0ZT1laG9zdC1saXZl#AN=136112967&db=asn (accessed on 10 December 2023).
- Franken, L.E.; Boekema, E.J.; Stuart, M.C.A. Transmission Electron Microscopy as a Tool for the Characterization of Soft Materials: Application and Interpretation. Adv. Sci. 2017, 4, 1600476.
- Helene Søgaard, L. General Rights Ultrastructure of Emulsions—A Comparative Electron Microscopy Study; Technical University of Denmark: Lyngby, Denmark, 2013.
- Hurbain, I.; Sachse, M. The future is cold: Cryo-preparation methods for transmission electron microscopy of cells. Biol. Cell 2011, 103, 405–420.
- Kanno, H.; Speedy, R.J.; Angell, C.A. Brief Introduction to High-Pressure Freezing. Science 2013, 189, 880–881.
- Niu, H.; Wang, W.; Dou, Z.; Chen, X.; Chen, X.; Chen, H.; Fu, X. Multiscale combined techniques for evaluating emulsion stability: A critical review. Adv. Colloid Interface Sci. 2023, 311, 102813.
- Mackie, A.R.; Gunning, A.P.; Wilde, P.J.; Morris, V.J. Orogenic Displacement of Protein from the Oil/Water Interface. Langmuir 1999, 16, 2242–2247.
- Zhang, L.Y.; Breen, P.; Xu, Z.; Masliyah, J.H. Asphaltene Films at a Toluene/Water Interface. Energy Fuels 2006, 21, 274–285.
- Ho, T.M.; Abik, F.; Mikkonen, K.S. An overview of nanoemulsion characterization via atomic force microscopy. Crit. Rev. Food Sci. Nutr. 2022, 62, 4908–4928.
- Morris, V.J. Probing molecular interactions in foods. Trends Food Sci. Technol. 2004, 15, 291–297.
- Li, G.; Xu, X.; Zuo, Y.Y. Langmuir-Blodgett transfer from the oil-water interface. J. Colloid Interface Sci. 2023, 630, 21–27.
- Jin, H.; Lu, Q.; Chen, X.; Ding, H.; Gao, H.; Jin, S. The use of Raman spectroscopy in food processes: A review. Appl. Spectrosc. Rev. 2016, 51, 12–22.
- Zhang, Y.; Yang, H.; Zheng, H.; Yuan, D.; Mao, L. Physical properties and salt release of potato starch-based emulsion gels with OSA starch-stabilized oil droplets. LWT 2021, 141, 110929.
- Tadros, T.; Izquierdo, P.; Esquena, J.; Solans, C. Formation and stability of nano-emulsions. Adv. Colloid Interface Sci. 2004, 108–109, 303–318.
- Zhang, S.; Zhang, Q.; Shang, J.; Mao, Z.S.; Yang, C. Measurement methods of particle size distribution in emulsion polymerization. Chin. J. Chem. Eng. 2021, 39, 1–5.
- Carvalho, P.M.; Felício, M.R.; Santos, N.C.; Gonçalves, S.; Domingues, M.M. Application of light scattering techniques to nanoparticle characterization and development. Front. Chem. 2018, 6, 386753.
- Fischer, K.; Schmidt, M. Pitfalls and novel applications of particle sizing by dynamic light scattering. Biomaterials 2016, 98, 79–91.
- Bhattacharjee, S. DLS and zeta potential—What they are and what they are not? J. Control. Release 2016, 235, 337–351.
- Anderson, W.; Kozak, D.; Coleman, V.A.; Jämting, Å.K.; Trau, M. A comparative study of submicron particle sizing platforms: Accuracy, precision and resolution analysis of polydisperse particle size distributions. J. Colloid Interface Sci. 2013, 405, 322–330.
- Klein, M.; Menta, M.; Dacoba, T.G.; Crecente-Campo, J.; Alonso, M.J.; Dupin, D.; Loinaz, I.; Grassl, B.; Séby, F. Advanced nanomedicine characterization by DLS and AF4-UV-MALS: Application to a HIV nanovaccine. J. Pharm. Biomed. Anal. 2020, 179, 113017.
- Hansen, M.; Smith, M.C.; Crist, R.M.; Clogston, J.D.; McNeil, S.E. Analyzing the influence of PEG molecular weight on the separation of PEGylated gold nanoparticles by asymmetric-flow field-flow fractionation. Anal. Bioanal. Chem. 2015, 407, 8661–8672.
- Wang, K.; Li, G.; Zhang, B. Opposite results of emulsion stability evaluated by the TSI and the phase separation proportion. Colloids Surf. A Physicochem. Eng. Asp. 2018, 558, 402–409.
- Kim, Y.J.; Kim, B.K.; Lee, M.H. Effect of small molecular surfactants on physical, turbidimetric, and rheological properties of Pickering nanoemulsions stabilized with whey protein isolate. Food Biosci. 2023, 51, 102214.
- Perrin, L.; Desobry-Banon, S.; Gillet, G.; Desobry, S. Study and optimization of oil-in-water emulsions formulated by low- and high-frequency ultrasounds. Int. J. Cosmet. Sci. 2023, 45, 198–213.
- Mengual, O.; Meunier, G.; Cayré, I.; Puech, K.; Snabre, P. TURBISCAN MA 2000: Multiple light scattering measurement for concentrated emulsion and suspension instability analysis. Talanta 1999, 50, 445–456.
- Preetz, C.; Hauser, A.; Hause, G.; Kramer, A.; Mäder, K. Application of atomic force microscopy and ultrasonic resonator technology on nanoscale: Distinction of nanoemulsions from nanocapsules. Eur. J. Pharm. Sci. 2010, 39, 141–151.
- Benita, S.; Levy, M.Y. Submicron Emulsions as Colloidal Drug Carriers for Intravenous Administration: Comprehensive Physicochemical Characterization. J. Pharm. Sci. 1993, 82, 1069–1079.
- Nordén, T.P.; Siekmann, B.; Lundquist, S.; Malmsten, M. Physicochemical characterisation of a drug-containing phospholipid-stabilised o/w emulsion for intravenous administration. Eur. J. Pharm. Sci. 2001, 13, 393–401.
- Whittinghill, J.M.; Norton, J.; Proctor, A. A fourier transform infrared spectroscopy study of the effect of temperature on soy lecithin-stabilized emulsions. J. Am. Oil Chem. Soc. 1999, 76, 1393–1398.
- Chantrapornchai, W.; Clydesdale, F.; McClements, D.J. Influence of Droplet Size and Concentration on the Color of Oil-in-Water Emulsions. J. Agric. Food Chem. 1998, 46, 2914–2920.
- McClements, D.J. Food Emulsions: Principles, Practices, and Techniques, 2nd ed.; CRC Press: Boca Raton, FL, USA, 2004.
- Silva, C.A.; Saraiva, S.V.; Bonetti, D.; Higuti, R.T.; Cunha, R.L.; Pereira, L.O.; Silva, F.V.; Fileti, A.M. Measurements of bimodal droplet size distribution of emulsions using ultrasonic spectroscopy in the long and intermediate wavelength regimes. Chem. Eng. Sci. 2022, 252, 117274.
- Rahn-Chique, K.; Puertas, A.M.; Romero-Cano, M.S.; Rojas, C.; Urbina-Villalba, G. Nanoemulsion stability: Experimental evaluation of the flocculation rate from turbidity measurements. Adv. Colloid Interface Sci. 2012, 178, 1–20.
- Baboota, S.; Shakeel, F.; Ahuja, A.; Ali, J.; Shafiq, S. Design, development and evaluation of novel nanoemulsion formulations for transdermal potential of celecoxib. Acta Pharm. 2007, 57, 315–332.
- Mirhosseini, H.; Tan, C.P. Discrimination of orange beverage emulsions with different formulations using multivariate analysis. J. Sci. Food Agric. 2010, 90, 1308–1316.
- Liu, Y.; Wei, Z.-C.; Deng, Y.-Y.; Dong, H.; Zhang, Y.; Tang, X.-J.; Li, P.; Liu, G.; Zhang, M.-W. Comparison of the Effects of Different Food-Grade Emulsifiers on the Properties and Stability of a Casein-Maltodextrin-Soybean Oil Compound Emulsion. Molecules 2020, 25, 458.
- Velandia, S.F.; Marchal, P.; Lemaitre, C.; Sadtler, V.; Roques-Carmes, T. Evaluation of the repartition of the particles in Pickering emulsions in relation with their rheological properties. J. Colloid Interface Sci. 2021, 589, 286–297.
- Li, G.; Zhao, Y.; Zhang, J.; Hao, J.; Xu, D.; Cao, Y. CaCO3 loaded lipid microspheres prepared by the solid-in-oil-in-water emulsions technique with propylene glycol alginate and xanthan gum. Front. Nutr. 2022, 9, 961326.
- Zhu, Y.; Gao, H.; Liu, W.; Zou, L.; McClements, D.J. A review of the rheological properties of dilute and concentrated food emulsions. J. Texture Stud. 2020, 51, 45–55.
- Tadros, T.F. Emulsion Formation and Stability; Wiley-VCH Verlag GmbH & Co. KGaA: Weinheim, Germany, 2013.
- Barnes, H.A. Rheology of emulsions—A review. Colloids Surf. A Physicochem. Eng. Asp. 1994, 91, 89–95.
- Kasprzak, M.M.; Berski, W.; Krystyjan, M.; Jamróz, E.; Florczuk, A.; Tkaczewska, J.; Zając, M.; Domagała, J.; Lett, A.M.; Ptasznik, S. Effects of fibre addition and processing on the stability, rheology and in vitro gastric digestion of whey protein-xanthan gum stabilised emulsions with high oil phase. LWT 2023, 178, 114465.
- Ozturk, B.; McClements, D.J. Progress in natural emulsifiers for utilization in food emulsions. Curr. Opin. Food Sci. 2016, 7, 1–6.
- Evans, M.; Ratcliffe, I.; Williams, P.A. Emulsion stabilisation using polysaccharide–protein complexes. Curr. Opin. Colloid Interface Sci. 2013, 18, 272–282.
- Dickinson, E. Hydrocolloids as emulsifiers and emulsion stabilizers. Food Hydrocoll. 2009, 23, 1473–1482.
- Geremias-Andrade, I.M.; Souki, N.P.D.B.G.; Moraes, I.C.F.; Pinho, S.C. Rheological and mechanical characterization of curcumin-loaded emulsion-filled gels produced with whey protein isolate and xanthan gum. LWT 2017, 86, 166–173.
- Howarth, R.W. A bridge to nowhere: Methane emissions and the greenhouse gas footprint of natural gas. Energy Sci. Eng. 2014, 2, 47–60.
- Samavati, V.; Emam-Djomeh, Z.; Mohammadifar, M.A.; Omid, M.; Mehdinia, A.L.I. Stability and Rheology of Dispersions Containing Polysaccharide, Oleic Acid and Whey Protein Isolate. J. Texture Stud. 2012, 43, 63–76.
- Sivapratha, S.; Sarkar, P. Multiple layers and conjugate materials for food emulsion stabilization. Crit. Rev. Food Sci. Nutr. 2018, 58, 877–892.
- Yang, S.; Qin, W.; Zhao, X.; He, F.; Gong, H.; Liu, Y.; Feng, Y.; Zhou, Y.; Yu, G.; Li, J. Interfacial self-assembled behavior of pH/light-responsive host-guest alginate-based supra-amphiphiles for controlling emulsifying property. Carbohydr. Polym. 2021, 266, 118121.
- Liao, W.; Gharsallaoui, A.; Dumas, E.; Elaissari, A. Understanding of the key factors influencing the properties of emulsions stabilized by sodium caseinate. Compr. Rev. Food Sci. Food Saf. 2022, 21, 5291–5317.
- Tadros, T.F. An Introduction to Surfactants; Walter de Gruyter: Berlin, Germany, 2014.
- Malkin, A.Y.; Masalova, I. Shear and normal stresses in flow of highly concentrated emulsions. J. Nonnewton Fluid. Mech. 2007, 147, 65–68.
- Hyun, K.; Wilhelm, M.; Klein, C.O.; Cho, K.S.; Nam, J.G.; Ahn, K.H.; Lee, S.J.; Ewoldt, R.H.; McKinley, G.H. A review of nonlinear oscillatory shear tests: Analysis and application of large amplitude oscillatory shear (LAOS). Prog. Polym. Sci. 2011, 36, 1697–1753.
- Yin, H.; Pu, J.; Wan, Y.; Xiang, B.; Bechtel, P.J.; Sathivel, S. Rheological and Functional Properties of Catfish Skin Protein Hydrolysates. J. Food Sci. 2010, 75, E11–E17.
- Hesarinejad, M.A.; Koocheki, A.; Razavi, S.M.A. Dynamic rheological properties of Lepidium perfoliatum seed gum: Effect of concentration, temperature and heating/cooling rate. Food Hydrocoll. 2014, 35, 583–589.
- Karatay, G.G.B.; Galvão, A.M.M.T.; Hubinger, M.D. Storage Stability of Conventional and High Internal Phase Emulsions Stabilized Solely by Chickpea Aquafaba. Foods 2022, 11, 1588.
- Sridharan, S.; Meinders, M.B.J.; Sagis, L.M.C.; Bitter, J.H.; Nikiforidis, C.V. Starch controls brittleness in emulsion-gels stabilized by pea flour. Food Hydrocoll. 2022, 131, 107708.
- Domian, E.; Mańko-Jurkowska, D. The effect of homogenization and heat treatment on gelation of whey proteins in emulsions. J. Food Eng. 2022, 319, 110915.
- Kundu, P.K.; Cohen, I.M.; Dowling, D.R. Boundary Layers and Related Topics. Fluid. Mech. 2016, 469–532.
- Schmelz, T.; Lesmes, U.; Weiss, J.; McClements, D.J. Modulation of physicochemical properties of lipid droplets using β-lactoglobulin and/or lactoferrin interfacial coatings. Food Hydrocoll. 2011, 25, 1181–1189.
- Avranas, A.; Stalidis, G.; Ritzoulis, G. Demulsification rate and zeta potential of O/W emulsions. Colloid Polym. Sci. 1988, 266, 937–940.
- Madivoli, E.S.; Kareru, P.G.; Gachanja, A.N.; Mugo, S.M.; Makhanu, D.S. Phytofabrication of iron nanoparticles and their catalytic activity. SN Appl. Sci. 2019, 1, 879.
- Moreira, J.B.; Goularte, P.G.; de Morais, M.G.; Costa, J.A.V. Preparation of beta-carotene nanoemulsion and evaluation of stability at a long storage period. Food Sci. Technol. 2019, 39, 599–604.
- Gurpret, K.; Singh, S.K. Review of Nanoemulsion Formulation and Characterization Techniques. Indian J. Pharm. Sci. 2018, 80, 781–789.
- Pinto, I.; Buss, A. ζ Potential as a Measure of Asphalt Emulsion Stability. Energy Fuels 2020, 34, 2143–2151.
- Dickinson, E. Structure formation in casein-based gels, foams, and emulsions. Colloids Surf. A Physicochem. Eng. Asp. 2006, 288, 3–11.
- Li, D.; Zhao, Y.; Wang, X.; Tang, H.; Wu, N.; Wu, F.; Yu, D.; Elfalleh, W. Effects of (+)-catechin on a rice bran protein oil-in-water emulsion: Droplet size, zeta-potential, emulsifying properties, and rheological behavior. Food Hydrocoll. 2020, 98, 105306.
- Kulmyrzaev, A.A.; Schubert, H. Influence of KCl on the physicochemical properties of whey protein stabilized emulsions. Food Hydrocoll. 2004, 18, 13–19.
- Yilmaz, E.; Borchert, H.H. Design of a phytosphingosine-containing, positively-charged nanoemulsion as a colloidal carrier system for dermal application of ceramides. Eur. J. Pharm. Biopharm. 2005, 60, 91–98.
- Đorđević, S.M.; Cekić, N.D.; Savić, M.M.; Isailović, T.M.; Ranđelović, D.V.; Marković, B.D.; Savić, S.R.; Stamenić, T.T.; Daniels, R.; Savić, S.D. Parenteral nanoemulsions as promising carriers for brain delivery of risperidone: Design, characterization and in vivo pharmacokinetic evaluation. Int. J. Pharm. 2015, 493, 40–54.
- Zhang, Z.; Dalgleish, D.G.; Goff, H.D. Effect of pH and ionic strength on competitive protein adsorption to air/water interfaces in aqueous foams made with mixed milk proteins. Colloids Surf. B Biointerfaces 2004, 34, 113–121.
- McLean, J.D.; Kilpatrick, P.K. Effects of Asphaltene Aggregation in Model Heptane–Toluene Mixtures on Stability of Water-in-Oil Emulsions. J. Colloid Interface Sci. 1997, 196, 23–34.
- McClements, D.J.; Lu, J.; Grossmann, L. Proposed Methods for Testing and Comparing the Emulsifying Properties of Proteins from Animal, Plant, and Alternative Sources. Colloids Interfaces 2022, 6, 19.
- Anema, S.G.; Lowe, E.K.; Li, Y. Effect of pH on the viscosity of heated reconstituted skim milk. Int. Dairy J. 2004, 14, 541–548.
- Siau, C.L.; Karim, A.A.; Norziah, M.H.; Wan Rosli, W.D. Effects of cationization on DSC thermal profiles, pasting and emulsifying properties of sago starch. J. Sci. Food Agric. 2004, 84, 1722–1730.
- Eicke, H.F.; Borkovec, M.; Das-Gupta, B. Conductivity of water-in-oil microemulsions: A quantitative charge fluctuation model. J. Phys. Chem. 1989, 93, 314–317.
- Briggs, N.; Raman, A.K.Y.; Barrett, L.; Brown, C.; Li, B.; Leavitt, D.; Aichele, C.P.; Crossley, S. Stable pickering emulsions using multi-walled carbon nanotubes of varying wettability. Colloids Surf. A Physicochem. Eng. Asp. 2018, 537, 227–235.
- Kawanami, T.; Togashi, K.; Fumoto, K.; Hirano, S.; Zhang, P.; Shirai, K.; Hirasawa, S. Thermophysical properties and thermal characteristics of phase change emulsion for thermal energy storage media. Energy 2016, 117, 562–568.
- Chiesa, M.; Garg, J.; Kang, Y.T.; Chen, G. Thermal conductivity and viscosity of water-in-oil nanoemulsions. Colloids Surf. A Physicochem. Eng. Asp. 2008, 326, 67–72.
- Wilson, O.M.; Hu, X.; Cahill, D.G.; Braun, P.V. Colloidal metal particles as probes of nanoscale thermal transport in fluids. Phys. Rev. B 2002, 66, 224301.
- D’alessandro, G.; Potenza, M.; Corasaniti, S.; Sfarra, S.; Coppa, P.; Bovesecchi, G.; de Monte, F. Modeling and Measuring Thermodynamic and Transport Thermophysical Properties: A Review. Energies 2022, 15, 8807.
- Zhang, W.P.; Li, L.Y.; Jia, B.; Ou, W.H.; Song, L.L.; Zhang, Q.J. Preparation and characteristics of multiple emulsions containing liquid crystals. Liq. Cryst. 2018, 45, 1186–1195.
- Gill, P.; Moghadam, T.T.; Ranjbar, B. Differential Scanning Calorimetry Techniques: Applications in Biology and Nanoscience. J. Biomol. Tech. 2010, 21, 167.
- Garti, N.; Aserin, A.; Tiunova, I.; Fanun, M. A DSC study of water behavior in water-in-oil microemulsions stabilized by sucrose esters and butanol. Colloids Surf. A Physicochem. Eng. Asp. 2000, 170, 1–18.
- Niizawa, I.; Sihufe, G.A.; Zorrilla, S.E. Design of whey protein aggregates towards microgel-stabilized emulsion generation. LWT 2021, 152, 112324.
- Abdolmaleki, K.; Alizadeh, L.; Hosseini, S.M.; Nayebzadeh, K. Concentrated O/W emulsions formulated by binary and ternary mixtures of sodium caseinate, xanthan and guar gums: Rheological properties, microstructure, and stability. Food Sci. Biotechnol. 2020, 29, 1685–1693.
- Kasprzak, M.; Jamróz, E.; Nowak, N.; Grzebieniarz, W.; Tkaczewska, J. Design of triple-layer films with blackseed protein as dispersion or emulsion. Food Chem. 2024, 435, 137533.
- Zografi, G. Physical stability assessment of emulsions and related disperse systems: A critical review. J. Soc. Cosmet. Chem. 1982, 33, 345–358.
- Estanqueiro, M.; Conceição, J.; Amaral, M.H.; Santos, D.; Silva, J.B.; Lobo, J.M.S. Characterization and stability studies of emulsion systems containing pumice. Braz. J. Pharm. Sci. 2014, 50, 361–369.
- Cannell, J.S. Fundamentals of stability testing. Int. J. Cosmet. Sci. 1985, 7, 291–303.
- Navarro-Pérez, Y.M.; Cedeño-Linares, E.; Norman-Montenegro, O.; Ruz-Sanjuan, V.; Mondeja-Rivera, Y.; Hernández-Monzón, A.M.; González-Bedia, M.M. Prediction of the physical stability and quality of O/W cosmetic emulsions using full factorial design . J. Pharm. Pharmacogn. Res. 2021, 9, 98–112.
- Dinache, A.; Tozar, T.; Smarandache, A.; Andrei, I.R.; Nistorescu, S.; Nastasa, V.; Staicu, A.; Pascu, M.L.; Romanitan, M.O. Spectroscopic Characterization of Emulsions Generated with a New Laser-Assisted Device. Molecules 2020, 25, 1729.
- Schestkowa, H.; Drusch, S.; Wagemans, A.M. FTIR analysis of β-lactoglobulin at the oil/water-interface. Food Chem. 2020, 302, 125349.
- Hayati, I.N.; Man, Y.B.C.; Tan, C.P.; Aini, I.N. Monitoring peroxide value in oxidized emulsions by Fourier transform infrared spectroscopy. Eur. J. Lipid Sci. Technol. 2005, 107, 886–895.
- Jorgensen, L.; Van De Weert, M.; Vermehren, C.; Bjerregaard, S.; Frokjaer, S. Probing structural changes of proteins incorporated into water-in-oil emulsions. J. Pharm. Sci. 2004, 93, 1847–1859.
- Zhou, G.W.; Li, G.Z.; Chen, W.J. Fourier Transform Infrared Investigation on Water States and the Conformations of Aerosol-OT in Reverse Microemulsions. Langmuir 2002, 18, 4566–4571.
- Sechler, T.D.; DelSole, E.M.; Deák, J.C. Measuring properties of interfacial and bulk water regions in a reverse micelle with IR spectroscopy: A volumetric analysis of the inhomogeneously broadened OH band. J. Colloid Interface Sci. 2010, 346, 391–397.
- Kiefer, J.; Frank, K.; Schuchmann, H.P. Attenuated total reflection infrared (ATR-IR) spectroscopy of a water-in-oil emulsion. Appl. Spectrosc. 2011, 65, 1024–1028.
- Kiefer, J.; Frank, K.; Zehentbauer, F.M.; Schuchmann, H.P. Infrared Spectroscopy of Bilberry Extract Water-in-Oil Emulsions: Sensing the Water-Oil Interface. Biosensors 2016, 6, 13.
- Daoud, S.; Bou-maroun, E.; Dujourdy, L.; Waschatko, G.; Billecke, N.; Cayot, P. Fast and direct analysis of oxidation levels of oil-in-water emulsions using ATR-FTIR. Food Chem. 2019, 293, 307–314.
- Yang, D.; Ying, Y. Applications of Raman Spectroscopy in Agricultural Products and Food Analysis: A Review. Appl. Spectrosc. Rev. 2011, 46, 539–560.
- Huang, W.E.; Li, M.; Jarvis, R.M.; Goodacre, R.; Banwart, S.A. Shining light on the microbial world the application of Raman microspectroscopy. Adv. Appl. Microbiol. 2010, 70, 153–186.
- Jin, H.; Ma, Q.; Dou, T.; Jin, S.; Jiang, L. Raman Spectroscopy of Emulsions and Emulsion Chemistry. Crit. Rev. Anal. Chem. 2023.
- Wu, L.; Wang, L.; Qi, B.; Zhang, X.; Chen, F.; Li, Y.; Sui, X.; Jiang, L. 3D confocal Raman imaging of oil-rich emulsion from enzyme-assisted aqueous extraction of extruded soybean powder. Food Chem. 2018, 249, 16–21.
- Dropsit, E.; Hoppe, S.; Chapron, D.; Durand, A.; Bourson, P. In situ conversion monitoring of styrene emulsion polymerization by deconvolution of a single reference band near 1000 cm−1. J. Raman Spectrosc. 2019, 50, 1938–1948.
- Elizalde, O.; Azpeitia, M.; Reis, M.M.; Asua, J.M.; Leiza, J.R. Monitoring Emulsion Polymerization Reactors: Calorimetry Versus Raman Spectroscopy. Ind. Eng. Chem. Res. 2005, 44, 7200–7207.
- Wei, Z.; Cheng, J.; Huang, Q. Food-grade Pickering emulsions stabilized by ovotransferrin fibrils. Food Hydrocoll. 2019, 94, 592–602.
- Guo, X.; Zhang, Y.; Jamali, M.A.; Peng, Z. Manipulating interfacial behaviour and emulsifying properties of myofibrillar proteins by L-Arginine at low and high salt concentration. Int. J. Food Sci. Technol. 2021, 56, 999–1012.
- Schlappa, S.; Bressel, L.; Reich, O.; Münzberg, M. Advanced Particle Size Analysis in High-Solid-Content Polymer Dispersions Using Photon Density Wave Spectroscopy. Polymers 2023, 15, 3181.
- Sandmann, M.; Münzberg, M.; Bressel, L.; Reich, O.; Hass, R. Inline monitoring of high cell density cultivation of Scenedesmus rubescens in a mesh ultra-thin layer photobioreactor by photon density wave spectroscopy. BMC Res. Notes 2022, 15, 54.
- Hass, R.; Mnzberg, M.; Bressel, L.; Reich, O. Industrial applications of Photon Density Wave spectroscopy for in-line particle sizing . Appl. Opt. 2013, 52, 1423–1431.
- Bressel, L.; Münzberg, M.; Hass, R.; Reich, O. Fiber-optical particle sizing by photon density wave spectroscopy. 23rd Int. Conf. Opt. Fibre Sens. 2014, 915756, 733–736.
- Bressel, K.; Müller, W.; Leser, M.E.; Reich, O.; Hass, R.; Wooster, T.J. Depletion-Induced Flocculation of Concentrated Emulsions Probed by Photon Density Wave Spectroscopy. Langmuir 2020, 36, 3504–3513.
- Kazemeini, S.M.; Campos, D.P.; Rosenthal, A.J. Muscle activity during oral processing of sticky-cohesive foods. Physiol. Behav. 2021, 242, 113580.
- Rosenthal, A.J.; Thompson, P. What is cohesiveness?—A linguistic exploration of the food texture testing literature. J. Texture Stud. 2021, 52, 294–302.
- Rosenthal, A.J. Instrumental characterisation of textural properties of solid and semi-solid food. In Modifying Food Texture: Volume 2: Sensory Analysis, Consumer Requirements and Preferences; Woodhead Publishing: Sawston, UK, 2015; pp. 89–105.
- Yang, X.; Gong, T.; Li, D.; Li, A.; Sun, L.; Guo, Y. Preparation of high viscoelastic emulsion gels based on the synergistic gelation mechanism of xanthan and konjac glucomannan. Carbohydr. Polym. 2019, 226, 115278.
- Ingrassia, R.; Busti, P.A.; Boeris, V. Physicochemical and mechanical properties of a new cold-set emulsion gel system and the effect of quinoa protein fortification. LWT 2022, 156, 113048.
- McMullen, R.L.; Gorcea, M.; Chen, S. Emulsions and their Characterization by Texture Profile Analysis. In Handbook of Formulating Dermal Applications; John Wiley & Sons, Inc.: Hoboken, NJ, USA; Scrivener Publishing LLC: Beverly, MA, USA, 2016; pp. 129–153.
- Ahn, N.; Park, J.H.; Chai, C.; Imm, J.Y. The interaction of milk sphingomyelin and proteins on stability and microstructure of dairy emulsions. J. Dairy Sci. 2022, 105, 3832–3845.
- Tkaczewska, J.; Jamróz, E.; Guzik, P.; Kopeć, M. Attempt to Extend the Shelf-Life of Fish Products by Means of Innovative Double-Layer Active Biodegradable Films. Polymers 2022, 14, 1717.
- Riesz, P.; Kondo, T. Free radical formation induced by ultrasound and its biological implications. Free Radic. Biol. Med. 1992, 13, 247–270.
- Fereidoon, S.; Ying, Z. Lipid oxidation and improving the oxidative stability. Chem. Soc. Rev. 2010, 39, 4067–4079.
- Ghelichi, S.; Hajfathalian, M.; Yesiltas, B.; Sørensen, A.-D.M.; García-Moreno, P.J.; Jacobsen, C. Oxidation and oxidative stability in emulsions. Compr. Rev. Food Sci. Food Saf. 2023, 22, 1864–1901.
- Laguerre, M.; Bily, A.; Roller, M.; Birti’c, S.B. Mass Transport Phenomena in Lipid Oxidation and Antioxidation. Annu. Rev. Food Sci. Technol. 2017, 8, 391–411.
- Nielsen, N.S.; Timm-Heinrich, M.; Jacobsen, C. Comparison of Wet-Chemical Methods for Determination of Lipid Hydroperoxides. J. Food Lipids 2003, 10, 35–50.
- Guillén-Sans, R.; Guzmán-Chozas, M. The thiobarbituric acid (TBA) reaction in foods: A review. Crit. Rev. Food Sci. Nutr. 1998, 38, 315–350.
- Thomsen, B.R.; Yesiltas, B.; Sørensen, A.D.M.; Hermund, D.B.; Glastrup, J.; Jacobsen, C. Comparison of Three Methods for Extraction of Volatile Lipid Oxidation Products from Food Matrices for GC–MS Analysis. JAOCS J. Am. Oil Chem. Soc. 2016, 93, 929–942.
- Merkx, D.W.H.; Hong, G.T.S.; Ermacora, A.; Van Duynhoven, J.P.M. Rapid Quantitative Profiling of Lipid Oxidation Products in a Food Emulsion by 1H NMR. Anal. Chem. 2018, 90, 4863–4870.
- Beysseriat, M.; Decker, E.A.; McClements, D.J. Preliminary study of the influence of dietary fiber on the properties of oil-in-water emulsions passing through an in vitro human digestion model. Food Hydrocoll. 2006, 20, 800–809.
- McClements, D.J.; Li, Y. Review of in vitro digestion models for rapid screening of emulsion-based systems. Food Funct. 2010, 1, 32–59.
- Mat, D.J.L.; Souchon, I.; Michon, C.; Le Feunteun, S. Gastro-intestinal in vitro digestions of protein emulsions monitored by pH-stat: Influence of structural properties and interplay between proteolysis and lipolysis. Food Chem. 2020, 311, 125946.
- Grundy, M.M.; Abrahamse, E.; Almgren, A.; Alminger, M.; Andres, A.; Ariëns, R.M.; Bastiaan-Net, S.; Bourlieu-Lacanal, C.; Brodkorb, A.; Bronze, M.R.; et al. INFOGEST inter-laboratory recommendations for assaying gastric and pancreatic lipases activities prior to in vitro digestion studies. J. Funct. Foods 2021, 82, 104497.
- Mulet-Cabero, A.-I.; Egger, L.; Portmann, R.; Ménard, O.; Marze, S.; Minekus, M.; Le Feunteun, S.; Sarkar, A.; Grundy, M.M.-L.; Carrière, F.; et al. A standardised semi-dynamic in vitro digestion method suitable for food—An international consensus. Food Funct. 2020, 11, 1702–1720.
- Armand, M.; Pasquier, B.; André, M.; Borel, P.; Senft, M.; Peyrot, J.; Salducci, J.; Portugal, H.; Jaussan, V.; Lairon, D. Digestion and absorption of 2 fat emulsions with different droplet sizes in the human digestive tract. Am. J. Clin. Nutr. 1999, 70, 1096–1106.
- Guo, Q.; Bellissimo, N.; Rousseau, D. Role of gel structure in controlling in vitro intestinal lipid digestion in whey protein emulsion gels. Food Hydrocoll. 2017, 69, 264–272.
- Ye, A.; Wang, X.; Lin, Q.; Han, J.; Singh, H. Dynamic gastric stability and in vitro lipid digestion of whey-protein-stabilised emulsions: Effect of heat treatment. Food Chem. 2020, 318, 126463.