Your browser does not fully support modern features. Please upgrade for a smoother experience.
Please note this is a comparison between Version 2 by Rita Xu and Version 1 by Lukas Hausberger.
Previous studies of road or railway infrastructures have shown that traffic emissions outweigh the environmental impacts of the product stage and construction stage over the entire life cycle. Traffic usage is therefore the main emitter over the life cycle (A1–C4). Due to the small number of sustainability assessment systems, the question of how to consider traffic emissions in detail in an integral life cycle assessment has arisen.
- cars driven in Austria
- infrastructure
- integral LCA studies
- life cycle assessment
1. Introduction
Accounting for approximately 37% of global greenhouse gas emissions, the construction industry has a significant impact on the environment, the consumption of energy and the use of natural resources [1]. In view of new regulations at the European and national levels [2], and increased efforts towards sustainability, it is necessary to accurately quantify the emissions of new construction projects and maintenance measures over the entire life cycle (A1–C4).
The life cycle assessment (LCA) of buildings, but also of infrastructures, is becoming increasingly important in society and for decision-makers [3]. For the infrastructure sector in particular, the small number of standardized assessment systems has resulted in difficulties with the data basis and implementation [4]. With regard to the implementation of analyses, it should be noted that the lack of infrastructure assessment systems [3,4,5][3][4][5] often results in labor-intensive and costly individual studies. Current research is attempting to close the “markets gap” and develop life cycle tools [3,4,5][3][4][5].
When investigating the emissions of road infrastructures over their whole life cycle (A1-C4), i.e., from the production of materials (A1–A3), transportation to the site (A4), construction (A5), maintenance (B2–B8), to dismantling and disposal (C1–C4), it is essential to consider the direct operational emissions from traffic use (B1) of the infrastructure. In addition to the emissions generated by construction and the materials used, previous studies have shown that these are only marginal compared to the operating emissions generated over the entire life cycle [6,7][6][7]. In other words, traffic/traffic use (B1) can be identified as the main emitter for traffic infrastructures. In the case of road infrastructures, these emissions can be attributed to emissions from road vehicles. However, this raises the question of which detailed and up-to-date results of traffic emissions are available and how these can be optimally prepared for integration into a life cycle assessment (LCA) or an assessment system for traffic infrastructures.
Ecological data for passenger cars are currently available on the market at the country-specific level for CO2 values (pure CO2 and CO2 equivalents—abbr.: eq.) and particulate matter (PM) from various established assessment systems [8,9,10,11][8][9][10][11]. As these data are not sufficient for an integral LCA of a traffic infrastructure according to EN17472 [12], further investigations are required that consider other environmental impact indicators beyond the values of CO2 and PM, according to ÖNORM EN15804 [13]. In addition to the results on air pollutants from the aforementioned assessment systems, eco-data are partly available from databases (e.g., ecoinvent) [14]. However, these only cover current vehicle populations and current technology standards (e.g., vehicle masses, battery sizes of electric cars, mileage, etc.) to a limited extent. In addition, the datasets in the databases are usually only targeted for larger regions (e.g., Europe, global, etc.) and cannot be further assigned to specific countries [14]. Similarly, no particular route specifics and route gradients can be taken into account in a detailed form in the sustainability assessment of the road infrastructure, as the currently available emission values only cover the average journey in the plain.
The investigated results for the life cycle stage “B1 use” can be included in an integral LCA of a traffic infrastructure; therefore, holistic considerations, such as route variants (e.g., tunnel vs. mountain pass road), detour traffic or traffic scenarios, can be quantified in detail. This will make a further contribution to a more detailed consideration of the environmental effects of the use of road infrastructures (B1) and thus support future sustainable decision-making and, above all, the implementation of a future sustainable built environment.
2. Sustainable Goals and Problems of Traffic
In fulfilling the climate objectives of the United Nations [18][15] and the European Commission [2], as well as in managing the transition to sustainable energy, the transportation sector, and particularly motor vehicle traffic, has a significant and presently notable impact on politics and media [19][16]. In light of the United Nations Environment Program—Global Status Report 2022 [1], it is clear that the transportation industry contributes 22% [1] of the world’s greenhouse gas emissions and faces the challenge of contributing to climate change mitigation [19][16]. Currently, policymakers in Europe and Austria [2,19,20][2][16][17] are prioritizing the replacement of internal combustion engine cars (ICE) with battery electric vehicles (BEVs) [19][16]. By 2030, newly registered cars in Austria must be ”emission-neutral” in accordance with the regulations of the Austrian federal government [20][17]. The changeover is viewed positively in terms of environmental friendliness by transport experts, as per a report by the Austrian automobile club ÖAMTC [19][16]. However, there are still concerns about range deficits and high costs associated with e-cars in comparison to traditional combustion engines [19][16]. On the flip side, the long charging times and inadequate charging infrastructure detract from the benefits [19][16]. To achieve a sustainable transition towards mobility, the focus must be on the technological advancement [19,21][16][18] of a fuel-efficient and emissions-neutral means of transportation. Nonetheless, setting up the requisite charging infrastructure is also crucial [19][16].3. The Austrian Car Stock
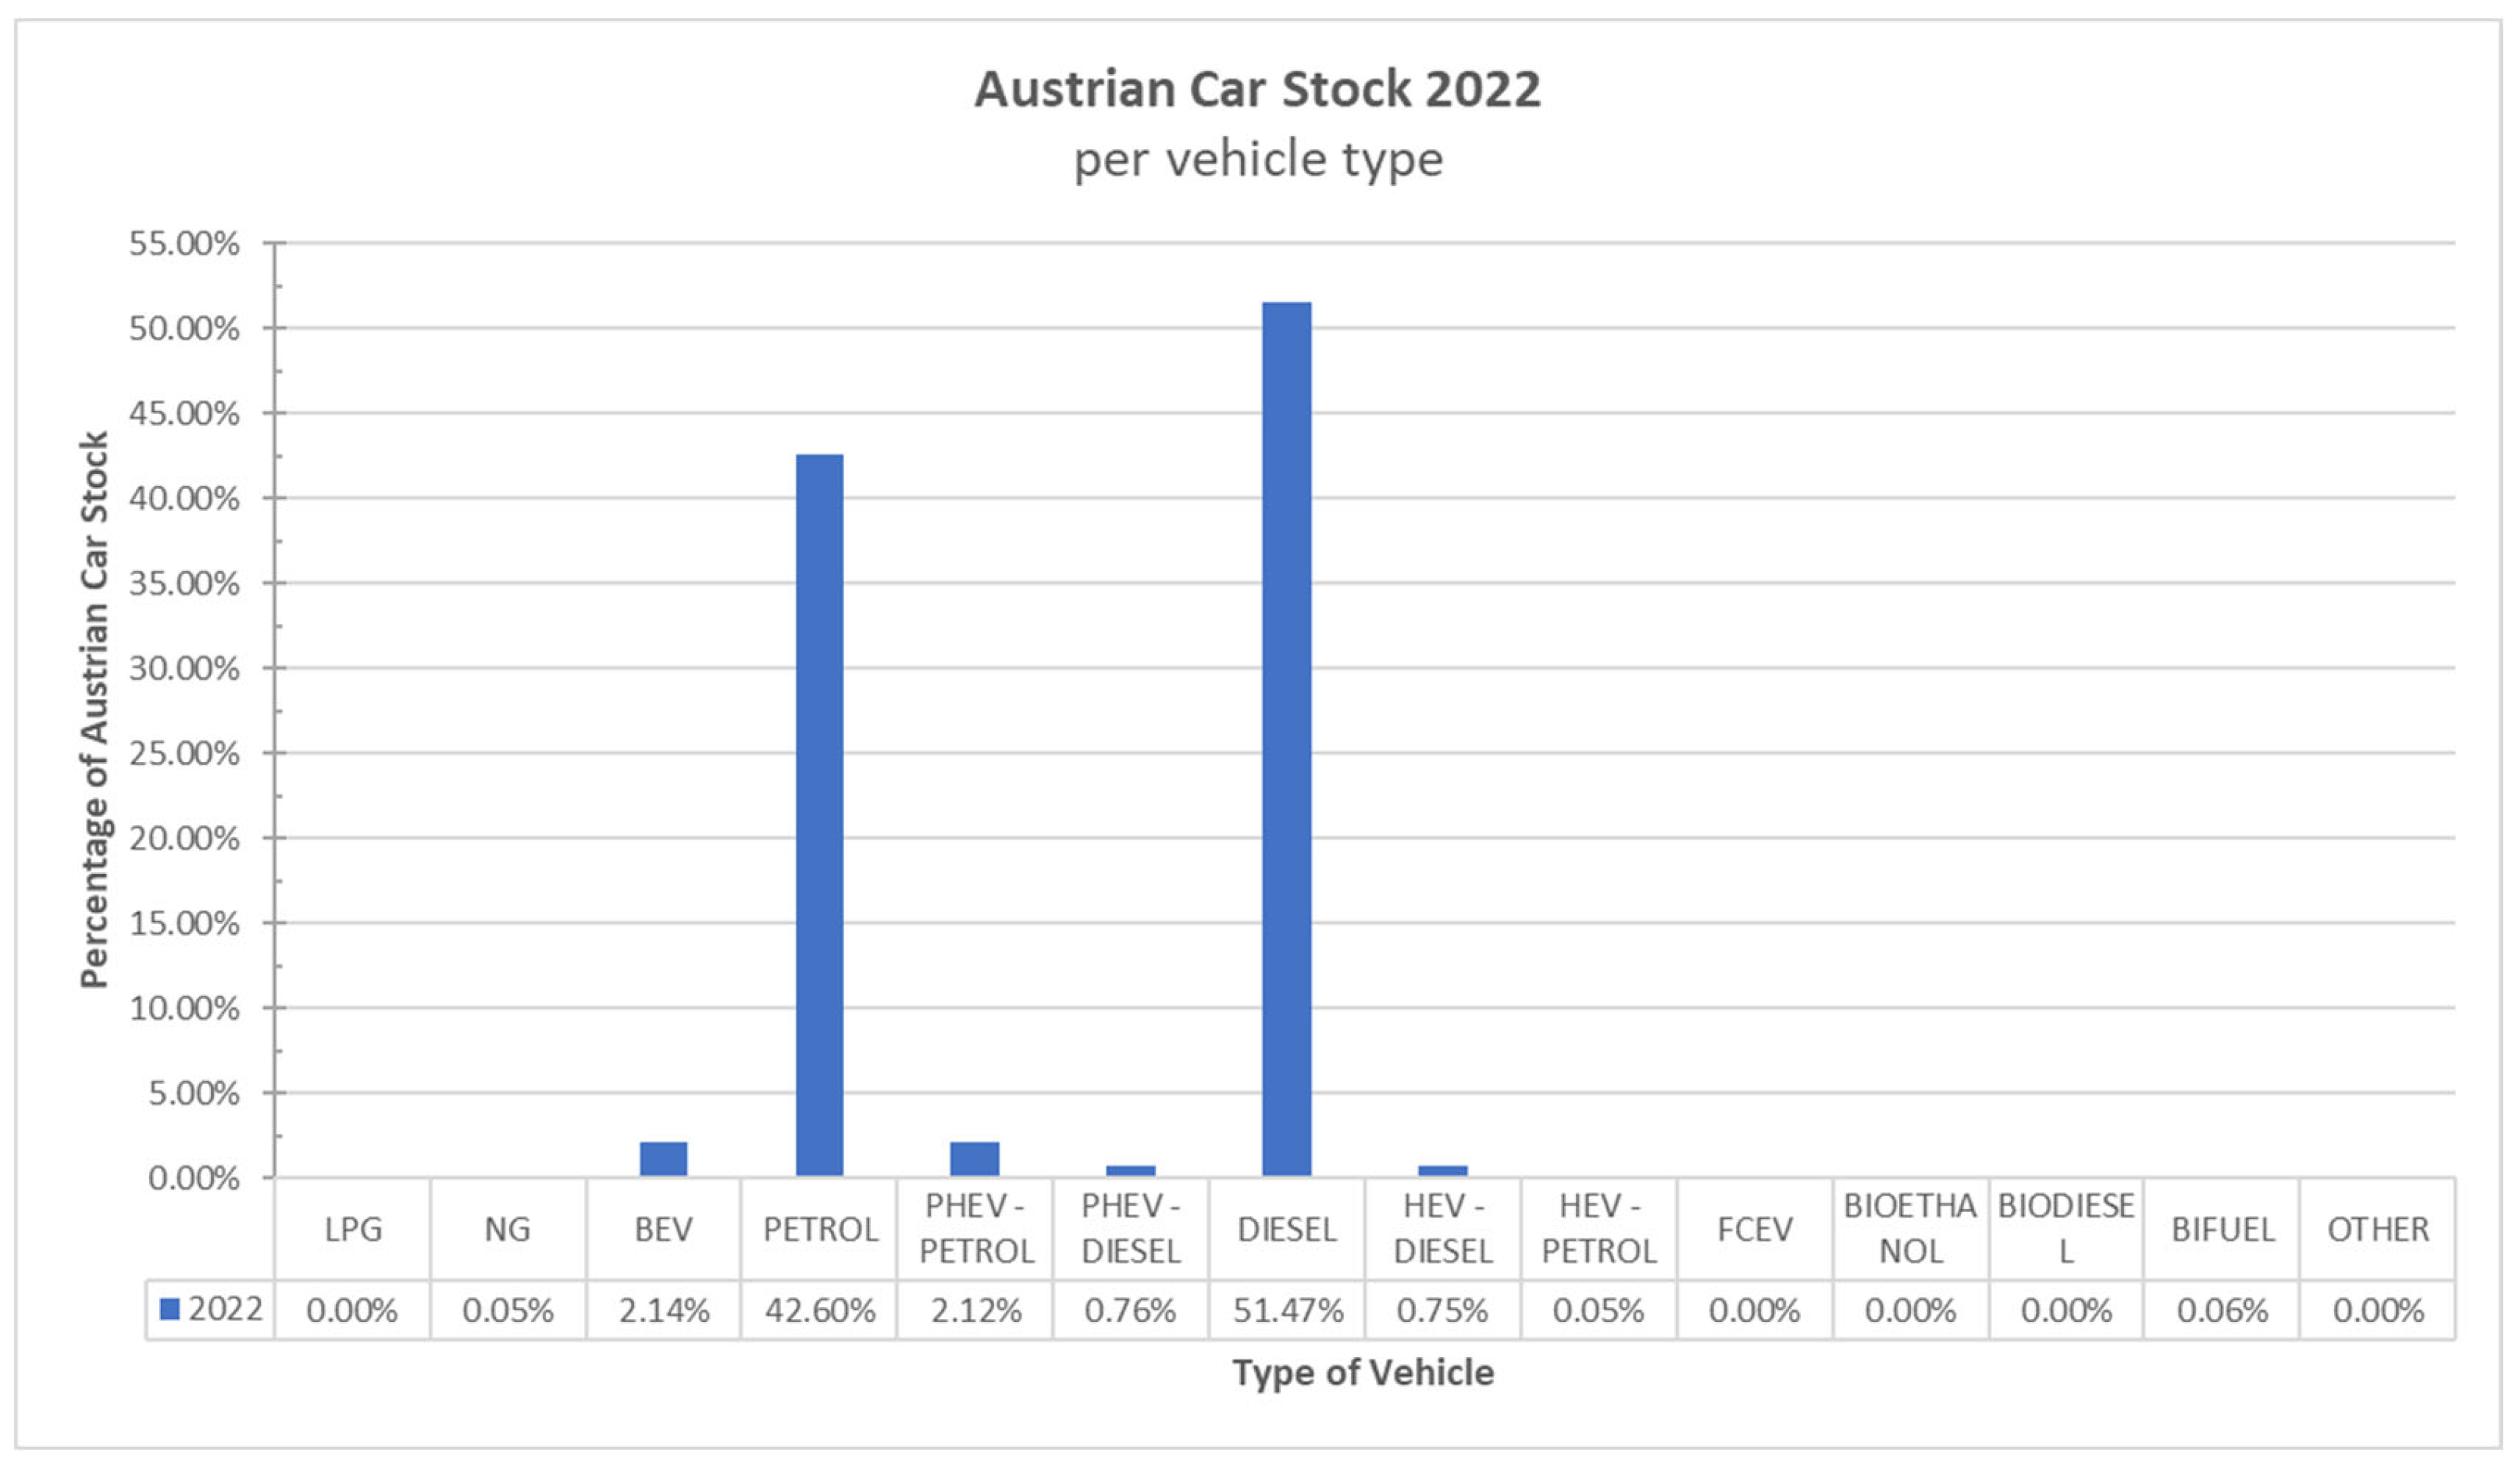
When looking at the Austrian vehicle stock [21[18][19][20][21],22,23,24], it becomes clear that cars with internal combustion engines (ICE) are widely used in Austria. Approximately 94% (according to the data collection of 31 December 2022) [22][19] of the Austrian car stock are cars with pure diesel or petrol engines. The remaining 6% comprises hybrid (HEV) or plug-in hybrid vehicles (PHEV) with petrol/electricity (2.9%), electric cars (BEV) (2.1%), diesel/electric cars (0.8%) and about 0.1% natural gas (NG) cars [22,23][19][20] (see Figure 1).
Figure 1. The Austrian car stock for the year 2022 per vehicle type.

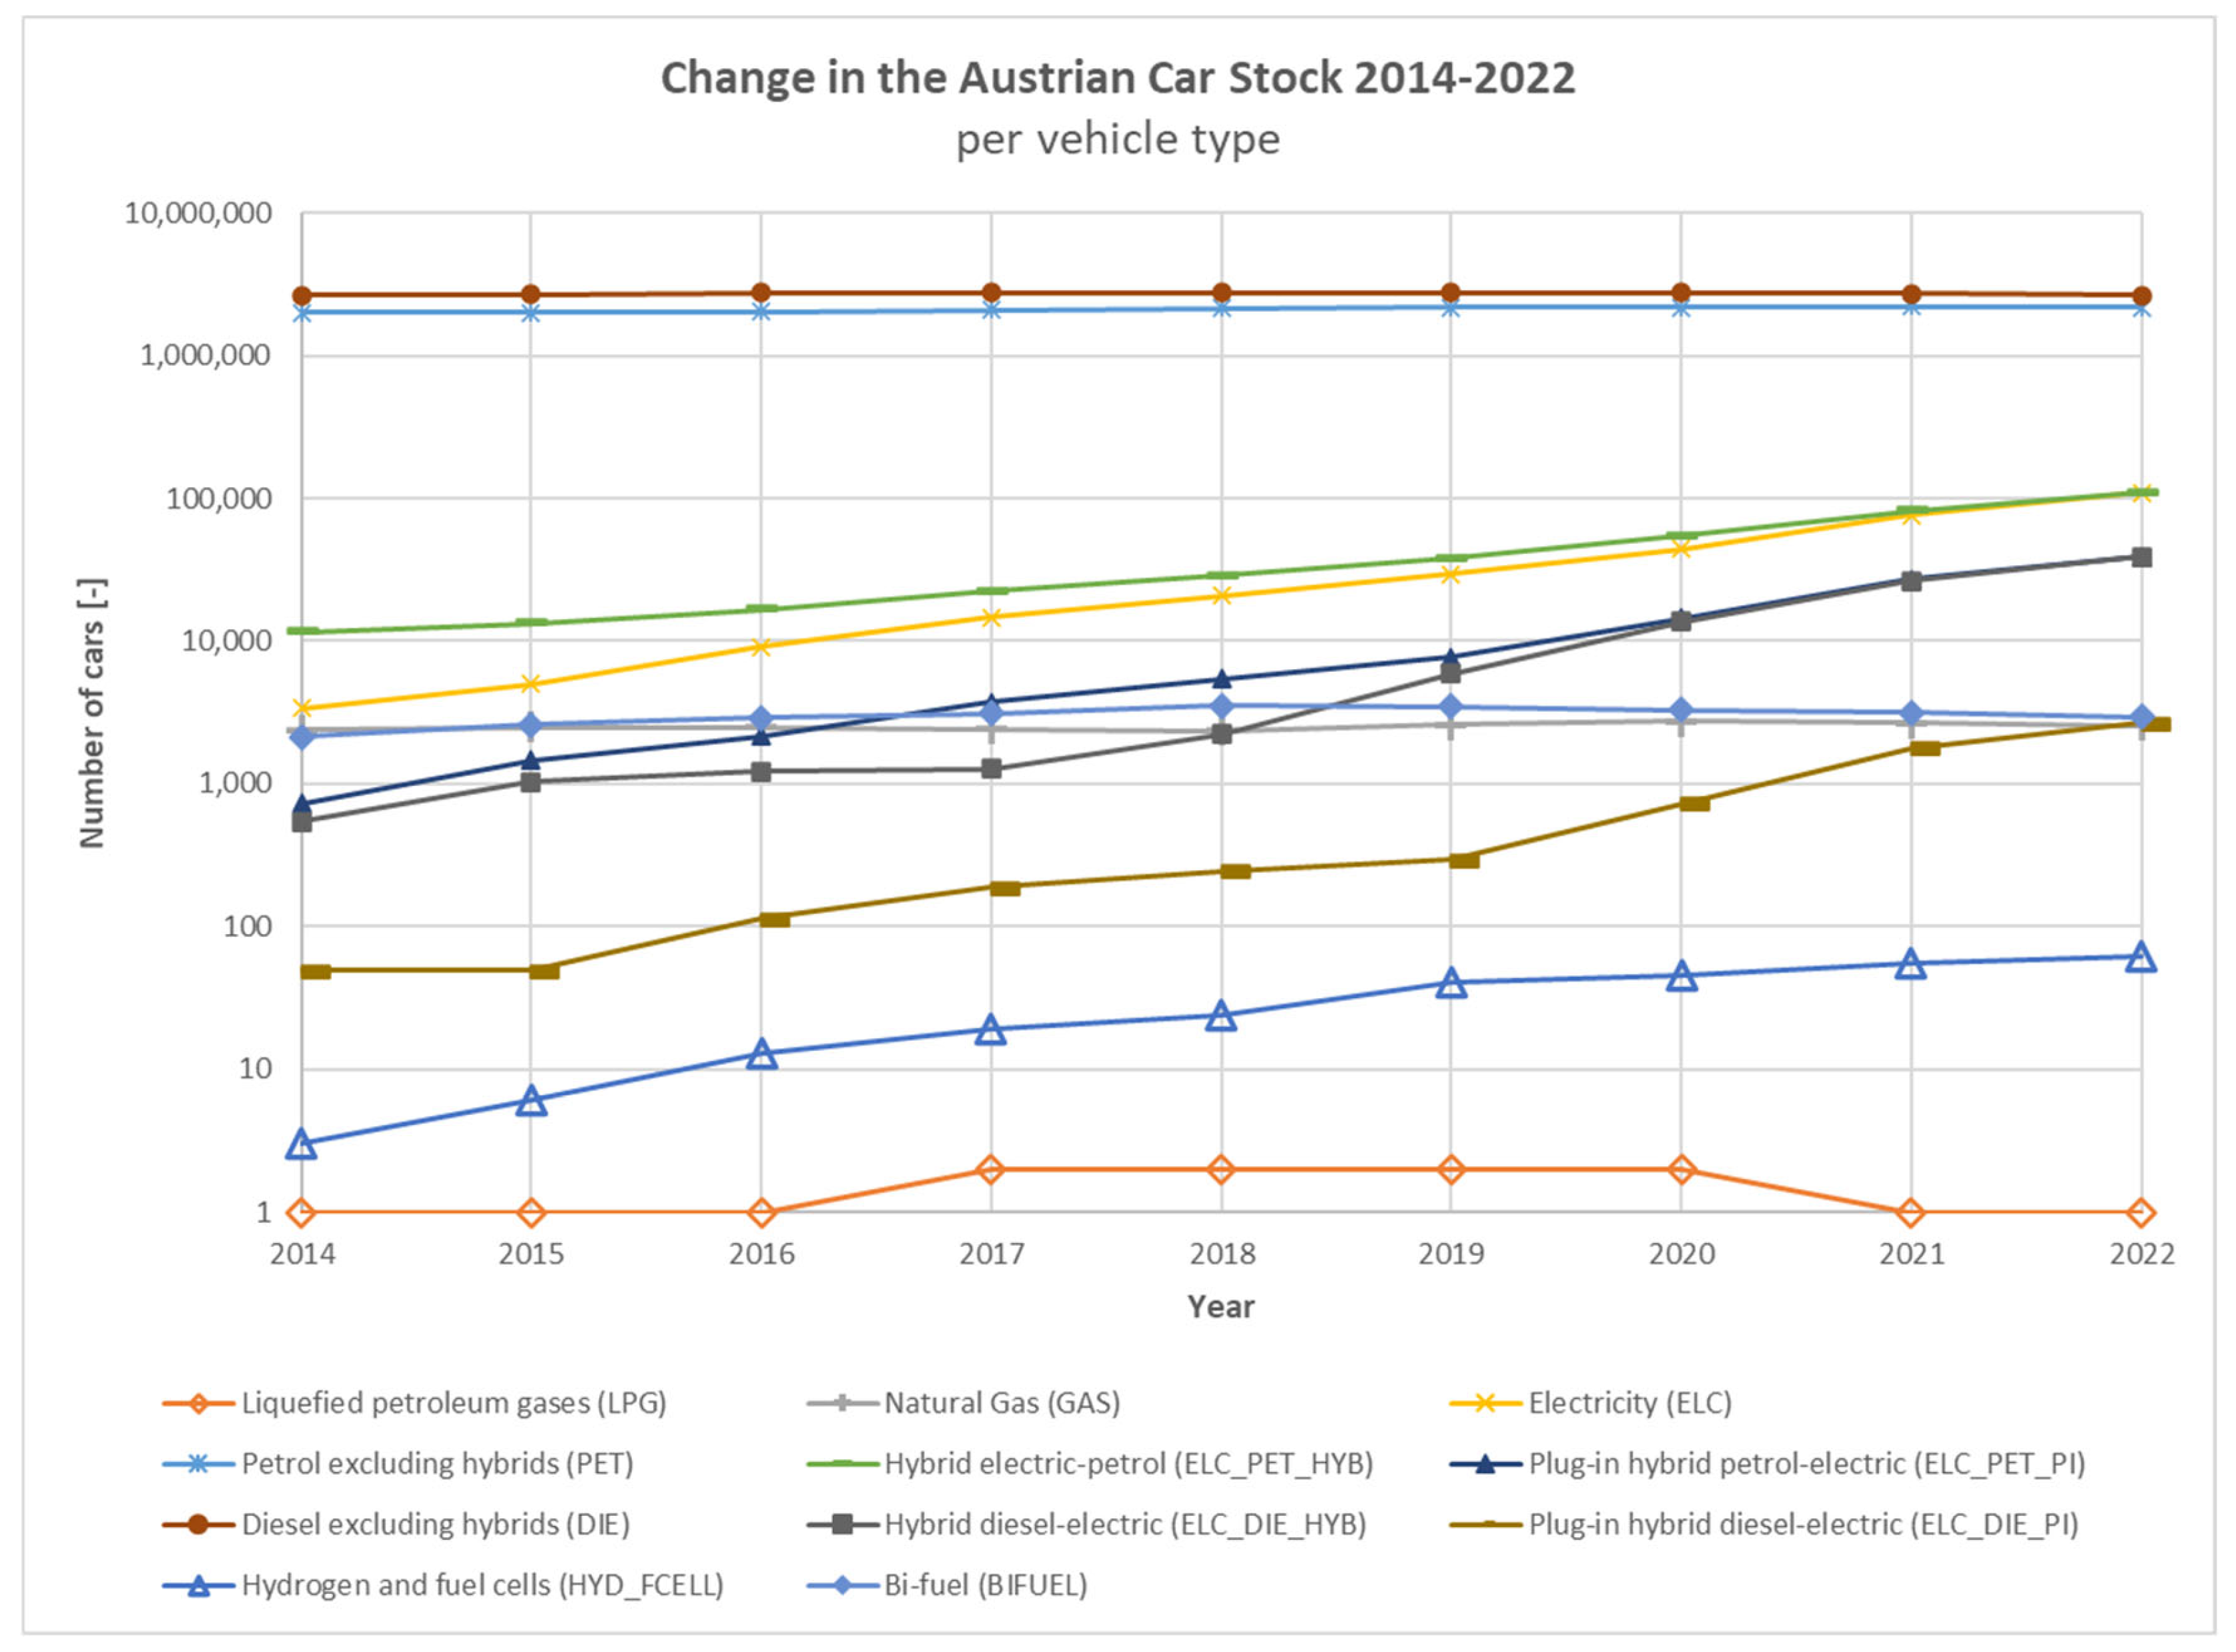
Figure 2. The numerical changes in the Austrian car stock per vehicle type from 2014 to 2022.
References
- United Nations Environment Program. 2022 Global Status Report for Buildings and Construction: Towards a Zero-emission, Efficient and Resilient Buildings and Construction Sector; United Nations Environment Program: Nairobi, Kenya, 2022; ISBN 978-92-807-3984-8.
- European Commission. Umsetzung des Europäischen Grünen Deals. Available online: https://commission.europa.eu/strategy-and-policy/priorities-2019-2024/european-green-deal/delivering-european-green-deal_de#nachhaltige-gestaltung-des-verkehrs (accessed on 17 November 2023).
- Österreichische Bautechnik Vereinigung. Ökologisierung & Nachhaltigkeit im Bauwesen—Sachstand; Österreichische Bautechnik Vereinigung: Wien, Austria, 2022; Available online: www.bautechnik.pro (accessed on 17 March 2023).
- Hausberger, L.; Gschösser, F. Nachhaltigkeit von Verkehrsinfrastrukturen: Bewertung auf drei Ebenen. Bauaktuell 2023, 14, 154.
- Friedrichsen, S. 2. Auflage. In Nachhaltiges Planen, Bauen und Wohnen: Kriterien für Neubau und Bauen im Bestand; Springer Vieweg: Berlin, Germany, 2018; ISBN 978-3-662-56553-7.
- Gschösser, F.; Schneider, R.; Tautschnig, A.; Feix, J. Retrofitting Measure vs. Replacement—LCA Study for a Railway Bridge. In Expanding Boundaries; vdf Hochschulverlag AG an der ETH Zurich: Zurich, Switzerland, 2016.
- Gschösser, F.; Purrer, W.; Sander, P. Environmental Effects of an Alpine Summit Tunnel. In Expanding Boundaries; vdf Hochschulverlag AG an der ETH Zurich: Zurich, Switzerland, 2016.
- Breemersch, T.; De Ceuster, G.; Chiffi, C.; Fiorello, D.; Ntziachristos, L.; Kouridis, C.; Knörr, W. Final Report—Update and Further Development of Transport Model TREMOVE; European Commission: Brussels, Belgium, 2010; Available online: https://climate.ec.europa.eu/system/files/2016-11/2010_tremove_en.pdf (accessed on 5 July 2023).
- De Ceuster, G.; van Herbruggen, B.; Logghe, S.; Proost, S. TREMOVE. 2004. Available online: https://www.asser.nl/upload/eel-webroot/www/documents/TREMOVEreport.pdf (accessed on 5 July 2023).
- Notter, B.; Wüthrich, P.; Heidt, C.; Knörr, W.; Mellios, G.; Papadimitriou, G.; Kouridis, C. Vergleich COPERT—TREMOD, Bern, Heidelberg und Thessaloniki. 2016. Available online: https://bast.opus.hbz-nrw.de/opus45-bast/frontdoor/deliver/index/docId/1891/file/7307b_COPERT_TREMOD_BAST_Schlussbericht.pdf (accessed on 5 July 2023).
- INFRAS. HBEFA—Handbook Emission Factors for Road Transport. Available online: https://www.hbefa.net/ (accessed on 27 November 2023).
- ÖNORM EN 17472; Nachhaltigkeit von Bauwerken—Bewertung der Nachhaltigkeit von Ingenieurbauwerken—Rechenverfahren. Austrian Standards International: Wien, Austria, 2022.
- ÖNORM EN 15804; Nachhaltigkeit von Bauwerken—Umweltproduktdeklarationen—Grundregeln für die Produktkategorie Bauprodukte. Austrian Standards International: Wien, Austria, 2022.
- Ecoinvent. Ecoinvent v3.9 Database. Available online: https://ecoinvent.org/the-ecoinvent-database/ (accessed on 23 November 2023).
- United Nations. THE 17 GOALS|Sustainable Development. Available online: https://sdgs.un.org/goals (accessed on 19 January 2023).
- Alt, R.; Antrekowitsch, H.; Baumann, M.; Borrmann, J.; Brandauer, W.; Eggler, L.; Eichlseder, H.; Eichlseder, W.; Fichtinger, M.; Geringer, B.; et al. ÖAMTC Expertenbericht "Mobilität & Klimaschutz 2030“, Wien. 2018. Available online: https://www.oeamtc.at/club/oeamtc-expertenbericht-mobilitaet-klimaschutz-2030-25873728 (accessed on 5 July 2023).
- Bundesministerium für Verkehr, Innovation und Technologie; Bundesministerium Nachhaltigkeit und Tourismus. #mission2030: Die Österreichische Klima- und Energiestrategie, Wien. 2018. Available online: https://www.bmk.gv.at/dam/bmvitgvat/content/themen/klima/klimaschutz/mission2030/mission2030_oe_klimastrategie_ua.pdf (accessed on 17 November 2023).
- Heinfellner, H. Sachstandsbericht Mobilität und mögliche Zielpfade zur Erreichung der Klimaziele 2050 mit dem Zwischenziel 2030: Kurzbericht; Umweltbundesamt: Wien, Germany, 2018; ISBN 978-3-99004-486-5.
- Statistik Austria. Fahrzeuge. Available online: https://www.statistik.at/statistiken/tourismus-und-verkehr/fahrzeuge (accessed on 22 November 2023).
- European Commission. Eurostat: Database—Transport. Available online: https://ec.europa.eu/eurostat/web/transport/data/database (accessed on 22 November 2023).
- Statistik Austria. Kfz-Neuzulassungen. 2022. Available online: https://www.statistik.at/statistiken/tourismus-und-verkehr/fahrzeuge/kfz-neuzulassungen (accessed on 5 July 2023).
- Bundesministerium für Verkehr, Innovation und Technologie. Erlass betreffend Einstufung in Euro-Abgasklassen: BMVIT-185.321/0005-IV/ST5/2019; Bundesministerium für Verkehr, Innovation und Technologie: Vienna, Austria, 2019.
- European Environment Agency. Monitoring of CO2 Emissions from Passenger Cars—Regulation (EU) 2019/631: (EU) No 2019/631; European Environment Agency: Copenhagen, Denmark, 2022.
- Wirtschaftskammer Österreich. Feststellung der richtigen Euro-Abgasklasse. Available online: https://www.wko.at/transport/abgasklassenzuordnung (accessed on 22 November 2023).
- Ericsson, E.; Nolinder, E.; Persson, A.; Steven, H. Work Programme 2016–2018 for HBEFA Version 4.1 Report of the Work Carried out for Work Package 2, Bern. 2019. Available online: https://assets.website-files.com/6207922a2acc01004530a67e/625e8c74c30e26e022b319c8_HBEFA41_Development_Report.pdf (accessed on 5 July 2023).
- Hausberger, S.; Matzer, C. Update of Emission Factors for EURO 4, EURO 5 and EURO 6 Diesel Passenger Cars for the HBEFA Version 3.3, Graz. 2017. Available online: https://www.umweltbundesamt.de/sites/default/files/medien/376/dokumente/bericht_der_tu_graz_zum_hbefa_3.3.pdf (accessed on 5 July 2023).
- Matzer, C. Bestimmung von Kraftstoffverbrauch und Abgasemissionen von Pkw in realen Betriebszuständen mittels Messung und Simulation. Ph.D. Thesis, Technischen Universität Graz, Graz, Austria, 2020.
- Hellweg, S.; Zah, R. What is new at the data front? Int. J. Life Cycle Assess 2016, 21, 1215–1217.
More
