The electrification of road transport is developing dynamically around the world. Many automotive companies are introducing electric vehicles to the market, and their popularity is constantly growing. The increasing popularity of electric vehicles is caused by individual countries’ governments encouraging people to switch to electric vehicles and their lower operating costs. The aim of the work, which discusses issues related to EVs and their use in many aspects, is to indicate both the benefits and some risks resulting from using these vehicles. The work was divided into two parts. The first one (Part 1 - environmental protection) indicated ecological issues related to the entire life cycle of an EV, including recycling. In the second part presented here (Part 2 - infrastructure and road safety), the attention was focused on two broad areas: infrastructure and the issue of EV safety.
1. Introduction
The use of electric drive-in motor vehicles is not a new idea. The pioneer of electric vehicles was Thomas Devenport, who, in 1834, built a small car powered by a voltaic battery
[1]. The development of the lead-acid battery in 1859 by Gaston Planté and the construction of the generator in 1866 by Warner von Siemens significantly impacted the development of motor vehicles. The first efficient electric vehicle was a tricycle developed by Percy and Ayton in 1882, powered by batteries weighing about 45 kg. The operation of electric vehicles at that time, compared to steam vehicles, revealed several advantages, the most important of which include quiet operation, ease of operation and driving, good dynamics, ease of installing the engine (with smaller dimensions compared to steam vehicles), and simplification of the drive system. At the end of the 19th century, electric carriages and small two-seater electric vehicles with a range of about 48 km appeared in some European cities. In 1898, an electric vehicle set a new speed record of 63.2 km/h. Electric vehicles of the time did not replace horse-drawn vehicles. The main reason was the short range of vehicles, high production costs, and the need to charge batteries with a vast mass frequently.
Electrically powered vehicles are gaining an increasing share of the passenger and commercial vehicle market. Electric vehicles include battery electric cars (BEV), vehicles in which an internal combustion engine works with an electric drive (HEV—hybrid electric vehicles, PHEV—plug-in hybrid electric vehicles), or vehicles equipped with fuel cells or electrochemical batteries (FCLE). The electric drive technology faces many challenges, but its future can be optimistic. New electric vehicle drive system technologies can significantly affect intelligent and sustainable transport development and reduce energy consumption and exhaust emissions under various road conditions
[2][3][4][2,3,4].
2. Infrastructure and its Availability across Countries
2.1. Statistical Data on the Number of Electric Vehicles Worldwide and in the EU
The Electric Vehicles Initiative (EVI) is one of many global initiatives that is dedicated to accelerating the adoption and deployment of electric vehicles worldwide. Sixteen countries have joined EVI:
Canada, Chile,
China, Finland, France, Germany, India, Japan, the Netherlands, New Zealand, Norway, Poland, Portugal, Sweden, the United Kingdom, and
the United States (countries with a co-chair status are underlined)
[5][6][5,6]. The European Commission is also involved in the activities of the EVI. The EVI publishes an annual report on the current status of electric vehicles compared to historical data, and presents forecasts for the coming years. EVI provides two free online tools: Global EV Data Explorer (electric vehicle statistics and forecasts) and Global EV Policy Explorer (policy statistics to support the deployment of electric vehicles). According to the Global EV Outlook 2023
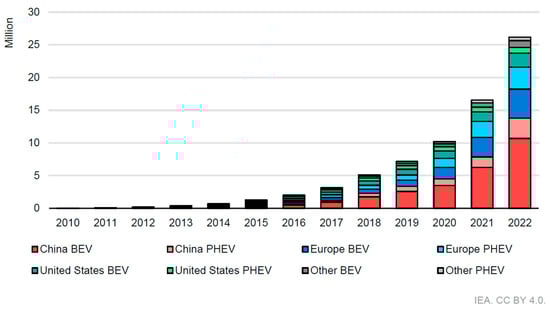
[6], over 26 million electric light-duty vehicles (ELDVs) were on the road in 2022 (
Figure 1), up 60% relative to 2021 and more than five times the stock in 2018. Additionally, global battery electric vehicles (BEVs) make up a significant share of total sales compared to plug-in hybrid electric vehicles (PHEVs).
Figure 1. Global electric car stock in selected regions, 2010–2022 License: CC BY 4.0
[6]. Notes: BEV = battery electric vehicle; PHEV = plug-in hybrid electric vehicle. Electric car stock in this figure refers to passenger light-duty vehicles. In “Europe”, European Union countries, Norway, the United Kingdom, Iceland, Israel, Switzerland, and Turkey. Main markets in “Other” include Australia, Brazil, Canada, Chile, Mexico, India, Indonesia, Japan, Malaysia, New Zealand, South Africa, Korea, and Thailand.
2.2. General Characteristics of Home EV Chargers and Public EV Recharging Stations
There are several ways to charge EV batteries. Based on the charging method, there are inductive and conductive charging. Due to the movement of the vehicle, charging takes place when the vehicle is stationary (stationary charging stations) or while it is moving (electric road systems—ERS). Stationary charging stations will be discussed later. ERS solutions are installed near the roadway or directly on it. Several pilot programs of conductive ERS can be found
[7][9]. The advantage of this solution is the ability to charge the vehicle while it is moving, which allows the use of a smaller battery. Reducing the weight of the battery translates into no restrictions on the load capacity of vehicles (especially important for trucks).
EV batteries can be charged with alternating current (AC) or direct current (DC)
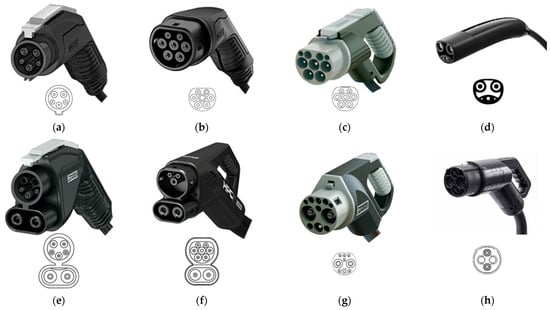
[8][10]. Regrettably, stationary station EVs connectors vary by geographic region and even by model, which makes it impossible to charge an EV at any recharging point across the world. Currently, the following types of EV charging connectors are available (
Figure 24)
[9][10][11][12][13][14][15][11,12,13,14,15,16,17]:
-
Type 1—single-phase AC charging (250 V, 32 A) connector popular mainly in the USA and Japan;
-
Type 1 Combo (combined charging system—CCS 1)—DC charging, Type 1 (AC) connector extended with two additional direct current (DC) contacts; this charging connector is popular mainly in the USA;
-
Type 2—single-phase AC charging (250 V, 13 A or 20 A or 32 A or 63 A or 70 A) or three-phase (480 V, 13 A or 20 A or 32 A or 63 A) connector popular mainly in Europe;
-
Type 2 Combo (CCS 2)—DC charging, Type 2 (AC) connector extended with two additional direct current (DC) contacts, short-term charging power up to 500 kW; this connector is popular mainly in Europe;
-
Type 3—single-phase (250 V, 16 A or 32 A) or three-phase (480 V, 32 A or 63 A) AC charging, currently not used and replaced in Europe by Type 2/Combo,
-
CHadeMO—DC charging, bi-directional energy flow (implementation of the V2G—vehicle to grid standard), charging standard used in various means of transport, output power for wheeled vehicles: 10 kW ÷ 400 kW (150 V ÷ 1000 V), the latest CHAdeMO (3.0) “ChaoJi” protocol provides for charging at up to 900 kW (600 A × 1.5 kV), developed jointly by CHAdeMO and the China Electricity Council (CEC); this connection is prevalent in Japan;
-
GB/T—connector popular mainly in China;
-
Tesla—a proprietary standard of EV connectors used by Tesla; the same connector is used for AC and DC charging; since the end of 2018, vehicles introduced to the EU market are equipped with the European CCS 2 socket.
Figure 24. Types of electric vehicle plugs
[16][17][18][19][20][18,19,20,21,22]: (
a) Type 1; (
b) Type 2; (
c) GB/T (AC); (
d) Tesla inlet (USA); (
e) CCS 1; (
f) CCS 2; (
g) GB/T (DC); (
h) CHadeMO.
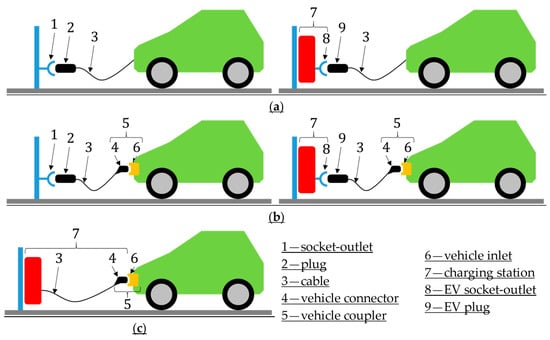
According to the international standard
[21][23], the following methods are used for connecting an EV to the power grid for charging (
Figure 35):
-
Case A—a cable is permanently connected to the vehicle;
-
Case B—a cable that is detachable at both ends;
-
Case C—a cable that is permanently connected to the EV recharging station.
Figure 35. Cases of connections (based on [21]): ( Cases of connections (based on [23]): (a
) case A; (b
) case B; (c
) case C.
The methods of charging electric cars are described in detail in
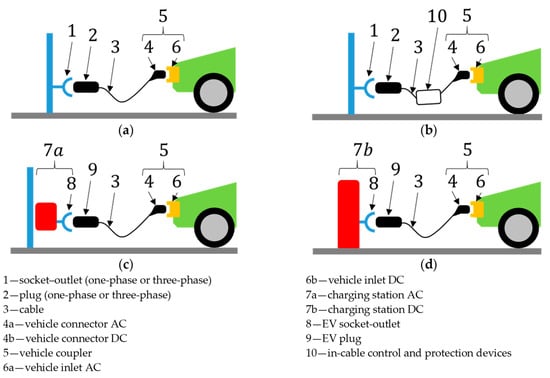
[21][23]; the following solutions are listed (
Figure 46):
-
Mode 1—charging from a standard single-phase AC socket (not more than 250 V, 16 A) or three-phase AC socket (not more than 480 V, 16 A) without an additional protection device;
-
Mode 2—charging from a standard single-phase AC socket (not more than 250 V, 32 A) or three-phase AC socket (not more than 480 V, 32 A) with an additional protection device (e.g., in-cable control box, ICCB) placed between the power socket and the EV (e.g., control and protection devices);
-
Mode 3—charging using a power supply device with an AC output dedicated to EV charging with appropriate protective devices; the device must be equipped with a grounding wire;
-
Mode 4—charging using a power supply device with a DC output dedicated to EV charging with appropriate protective devices; the device must be equipped with a grounding wire.
-
Mode 1 charging is currently not supported by vehicle manufacturers. In this mode, vehicles are charged without additional protection and the leads connected to the electrical outlet are always live. Charging is slow and limited to domestic electric installations. Mode 1 charging is banned in the United States, Israel and the United Kingdom
[21][23].
-
Mode 2 uses the electric vehicle supply equipment (EVSE), which supplies AC to the EV onboard charger (OBC). The OBC converts the AC main current into DC and sends it to the battery. Mode 2 in the United States of America and Canada is limited to 250 V. In Switzerland, mode 2 charging is limited to 16 A and 250 V (in single-phase systems). Some European countries apply charging current limitations during charging (using charging devices equipped with a household plug) for more than 2 h. Modes 1 and 2 are prohibited to use in public places in Italy. No voltage and current limits are set in international standard for modes 3 and 4.
Figure 46. Charging modes (based on [21]): ( Charging modes (based on [23]): (a
) mode 1; (b
) mode 2; (c
) mode 3; (d
) mode 4.
2.3. Distribution of EV Recharging Points/Recharging Stations in the European Union
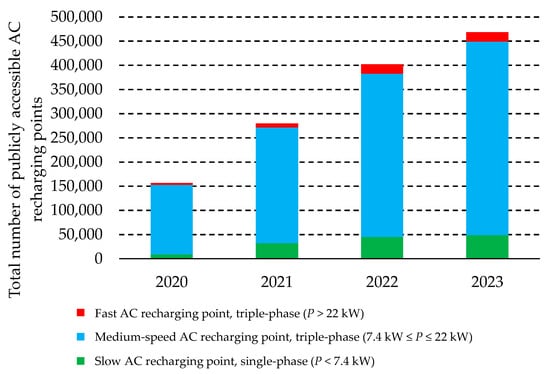
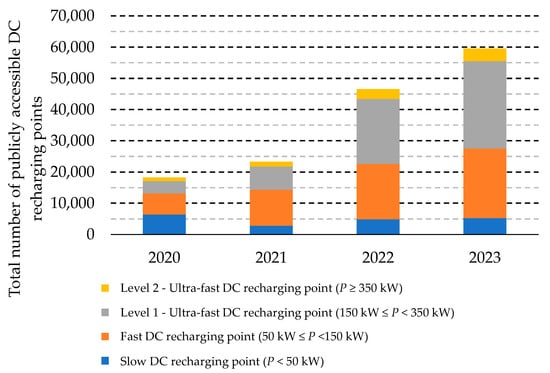
The development of charging infrastructure is crucial in facilitating the widespread use of EVs. The number of public AC and DC recharging points is shown in 7 and Figure 6. The data are presented according to the categorization of the regulation for the deployment of alternative fuels infrastructure (AFIR). Medium-speed AC recharging points are the most common type of public EV recharging stations. Fast and ultra-fast-level 1 prevail among DC recharging points.
8. The data are presented according to the categorization of the regulation for the deployment of alternative fuels infrastructure (AFIR). Medium-speed AC recharging points are the most common type of public EV recharging stations. Fast and ultra-fast-level 1 prevail among DC recharging points.
Figure 57. Total number of publicly accessible AC recharging points in EU-27, according to the AFIR categorization
[22][8].
Figure 68. Total number of publicly accessible DC recharging points in EU-27, according to the AFIR categorization
[22][8].
2.4. EV Charging Time
The EV charging time depends on the charging method (AC or DC), type of recharging points (public or private), battery capacity, and OBC. With publicly accessible chargers, specifically DC chargers, an EV battery can be recharged faster compared to a private/home recharging point. Table 1 summarizes the charging time of selected EVs using AC and DC recharging points. The initial and final state of charge (SoC) are set at 20% and 80%, respectively. Charging the EVs at a DC recharging point takes about 0.5 h, and the EV charging time at the DC recharging point mainly depends on the vehicle specifications. For example, the battery capacity of Tesla 3 and Renault Zoe is similar, but the average charging power of Tesla 3 is more than twice as high as that of Renault, which translates into shorter charging times. Charging times at AC recharging points are longer because they are limited by the OBC and the power of the recharging point. The charging time attributed to OBC-related limitations is marked in orange. EVs with a charging time of more than 10 h are marked grey. A 10 h charging period is based on the assumption that EVs are not used from 8 PM to 6 AM and can be then connected to the AC recharging point.
6 summarizes the charging time of selected EVs using AC and DC recharging points. The initial and final state of charge (SoC) are set at 20% and 80%, respectively. Charging the EVs at a DC recharging point takes about 0.5 h, and the EV charging time at the DC recharging point mainly depends on the vehicle specifications. For example, the battery capacity of Tesla 3 and Renault Zoe is similar, but the average charging power of Tesla 3 is more than twice as high as that of Renault, which translates into shorter charging times. Charging times at AC recharging points are longer because they are limited by the OBC and the power of the recharging point. The charging time attributed to OBC-related limitations is marked in orange. EVs with a charging time of more than 10 h are marked grey. A 10 h charging period is based on the assumption that EVs are not used from 8 PM to 6 AM and can be then connected to the AC recharging point.
Table 16. Charging time of selected EVs with AC and DC recharging points (data for EVs
[23][25]).
| EV |
Battery Capacity [kWh] |
OBC (AC Charging) [kW] |
Energy Consumption [Wh/km] |
Time for AC Charging * [h:min] by Charging Point of Power |
DC Charging Power [kW] |
Time for DC Charging * [h:min] |
Driving Distance ***
[km] |
| 2.3 kW |
3.7 kW |
7.4 kW |
11.0 kW |
22.0 kW |
Max. ** |
Ave. |
| Dacia Spring |
26.8 |
7.4 |
152 |
6:59 |
4:21 |
2:10 |
2:10 |
2:10 |
34 |
29 |
0:33 |
105 |
| VW ID.5 |
76.6 |
11.0 |
179 |
19:58 |
12:25 |
6:12 |
4:10 |
4:10 |
143 |
125 |
0:22 |
256 |
| Kia Niro EV |
64.8 |
11.0 |
168 |
16:54 |
10:30 |
5:15 |
3:31 |
3:31 |
80 |
70 |
0:33 |
231 |
Audi Q4
e-tron |
76.6 |
11.0 |
189 |
19:58 |
12:25 |
6:12 |
4:10 |
4:10 |
143 |
125 |
0:22 |
243 |
| Cupra Born |
58.0 |
11.0 |
166 |
15:07 |
9:24 |
4:42 |
3:09 |
3:09 |
124 |
82 |
0:25 |
209 |
| Hyundai Kona Electric |
39.2 |
11.0 |
157 |
10:13 |
6:21 |
3:10 |
2:08 |
2:08 |
44 |
37 |
0:38 |
149 |
| Tesla 3 |
57.5 |
11.0 |
142 |
15:00 |
9:19 |
4:39 |
3:08 |
3:08 |
170 |
100 |
0:21 |
242 |
| Renault Zoe |
54.7 |
22.0 |
165 |
14:16 |
8:52 |
4:26 |
2:58 |
1:29 |
46 |
41 |
0:48 |
198 |
| Legend: |
* estimated charging time from 20% to 80% of battery capacity,
** EV limitations,
*** estimated driving distance for 60% battery consumption, |
.....— AC charging above 10 h,
.....— limitation due to the OBC. |
3. Safety of EVs
3.1. EV Safety Issues
Before being allowed to operate, all vehicle models must pass tests, the effect of which is to check whether they meet the minimum level of safety (type-approval tests). Their specificity may differ slightly from the area of use, resulting from the legal regulations in a given country. The basic ones may be those resulting from the UN (UNECE) technical regulations applied to the broad automotive sector, addressing the safety and environmental performance of wheeled vehicles, their subsystems and parts (see [24]). It is also worth paying attention to the regulations dedicated to cars equipped with electric drives, such as UN ECE R100 or the American FMVSS 305. A comparison of legal rules in different economic areas is provided in studies [25][26]. Before being allowed to operate, all vehicle models must pass tests, the effect of which is to check whether they meet the minimum level of safety (type-approval tests). Their specificity may differ slightly from the area of use, resulting from the legal regulations in a given country. The basic ones may be those resulting from the UN (UNECE) technical regulations applied to the broad automotive sector, addressing the safety and environmental performance of wheeled vehicles, their subsystems and parts (see [34]). It is also worth paying attention to the regulations dedicated to cars equipped with electric drives, such as UN ECE R100 or the American FMVSS 305. A comparison of legal rules in different economic areas is provided in studies [35,36].
Tests based on regulations enforce compliance with a certain level of safety by each type of vehicle. Still, they do not provide information that would allow for a clear and unambiguous comparison of the safety level of cars. Here, various consumer tests can come in handy, such as x-NCAP (New Car Assessment Programme), which dates back to the late 1970s (US-NCAP). These tests allow objective, quantitative, and qualitative assessments of the safety level of cars according to specific procedures (mainly crash tests) and car equipment with systems that increase their safety. With the wider prevalence of EVs, the results of safety tests and such vehicles began to appear.
Here, Euro-NCAP tests [27] were used for comparison. Here, Euro-NCAP tests [39] were used for comparison. Figure 7 presents the results of 291 trials from 2017–2023, of which 48 concerned vehicles equipped with an electric motor (BEV or HEV version). These results indicate that (at the level of averaged indicators) there are no grounds to conclude that electric cars are less safe for road users (drivers, passengers, and other users), and in the category of vehicle equipment with additional systems that improve safety, there is even a visible advantage of EVs over ICEVs. In the following years, the average rating increased, precisely in the category of additional safety systems and protection of unprotected road users. The improvement in passive safety is somewhat less pronounced.
9 presents the results of 291 trials from 2017–2023, of which 48 concerned vehicles equipped with an electric motor (BEV or HEV version). These results indicate that (at the level of averaged indicators) there are no grounds to conclude that electric cars are less safe for road users (drivers, passengers, and other users), and in the category of vehicle equipment with additional systems that improve safety, there is even a visible advantage of EVs over ICEVs. In the following years, the average rating increased, precisely in the category of additional safety systems and protection of unprotected road users. The improvement in passive safety is somewhat less pronounced.
Figure 79.
Euro-NCAP car safety assessment: (a
) EVs vs. ICEVs; (b
) EV rating trends. 5*—percentage of vehicles with the highest overall rating (5 stars). AOP—adult occupant protection. ChOP—child occupant protection. VRU—vulnerable road user protection. SA—safety assist (evaluation of driver-assistance and crash-avoidance technologies).
3.2. Problems in Cases of Accidents, including Fire
Tests, such as the previously cited NCAP, are general safety assessment methods that do not highlight some new risks associated with using predominantly powerful battery packs (LIBs). Media reports of spectacular fires of electric vehicles lead to some fear among users about the high risk of such an effect. The data (Table 2) indicate that the largest number of fires is in the case of conventional vehicles, which is, of course, related to the actual quantitative dominance of such cars.
7) indicate that the largest number of fires is in the case of conventional vehicles, which is, of course, related to the actual quantitative dominance of such cars.
Table 27. Car fire statistics
[28][84].
| Car Type |
Fire Number (Total) |
Fire Number per 100k Sales |
| HEV |
16,051 |
3474.5 |
| ICEV |
199,533 |
1529.9 |
| EV |
52 |
25.1 |
4. Conclusions
The continuous increase in the popularity of EVs in all countries and the information about the future limitation of registration of cars with internal combustion engines in EU countries means that electric motors are now treated as the primary type of drive in future vehicles. Various incentives and financial subsidies applied by governments to facilitate the purchase of EVs stimulate the growth of sales of these cars and contribute to increasing their share in the automotive market. Many publications have been written about the indisputable advantages of the electric drive. However, considering local conditions, some problems may arise during their use.
In 2022, the total number of ELDVs in the world exceeded 26 million and has increased five-fold in the last 5 years. Following the dynamic increase in the number of electric cars, the development of their charging infrastructure must keep up with the need to ensure the appropriate density of its distribution on roads and to shorten the time of charging the EV battery. However, the variety of solutions used in EVs is not conducive to ensuring an appropriate density of charging stations; unfortunately, the connectors fitted to an EVs vary depending on the geographic region and car model, which excludes the possibility of charging the EV’s battery at any charging point in the world.
Moreover, the charging time of EVs depends on the charging method (AC or DC), location of the charging point (public or private), battery capacity, and OBC.
Public chargers (mainly DC) allow faster charging of the vehicle battery compared to a private/home charging point, but as shown (Table 1), charging an EV at a DC fast charging point takes about 0.5 h, assuming the initial and the final SoC are 20% and 80%, respectively. Compared to the refueling time of an ICEV car (which is several minutes), this is still too much and significantly extends the journey time of the BEV.
6), charging an EV at a DC fast charging point takes about 0.5 h, assuming the initial and the final SoC are 20% and 80%, respectively. Compared to the refueling time of an ICEV car (which is several minutes), this is still too much and significantly extends the journey time of the BEV.
The main general problems of EV safety issues are chemical and electrical risks (including those leading to vehicle fires). Regarding the overall level of EV safety, EV cars are in no way inferior to classic ICEVs. Data from safety assessment tests (Euro-NCAP) make this clear. The rating indices for vehicles with both types of energy sources are similar. In the case of additional safety-enhancing equipment (driver assistance systems and crash-avoidance technologies), they are even higher for EVs.
Research on the occurrence of car fires also quite clearly indicates that the risk of such an effect in the case of EVs is lower than in the case of ICEVs. On the other hand, the course of the thermal runaway phenomenon and the duration of a high-voltage battery fire are slightly different than in the case of ICEV fires, and the extinguishing process is more complicated.
Since the beginning of the broader appearance of the EV (BEV or HEV), a lot of research has been carried out in the field of safety in various areas of engineering knowledge: passive safety, active safety, post-accident safety, vehicle control systems, battery design and management, battery operation, firefighting procedures, material science, etc. This provides the basis for further development and improvement of EV safety.