Methanogenesis is critical in cattle because it prevents accumulation of metabolic hydrogen in the rumen by serving as a reducing equivalent sink. Alternative hydrogen sinks exist, however, and these alternative sinks are affected by the ingredient and chemical composition of the diet, such that the quantity of CH4 produced by cattle varies based on dietary constituents that are fed. Diets that produce acetate liberate hydrogen to be used by methanogenic archaea to produce CH4. Conversely, propionate serves as a net hydrogen sink, and diets that increase propionate and decrease acetate result in decreased ruminal CH4 production, reflecting decreased availability of metabolic hydrogen for methanogens to reduce CO2 to CH4.
1. Introduction
Beef cattle production is the single largest agricultural commodity area in the United States, contributing over USD 66 billion in receipts in 2019
[1]. Although cattle can convert low-quality feeds into high-quality protein for human consumption, they are a source of agricultural greenhouse gas emissions to the atmosphere. The agriculture sector in the United States contributes approximately 10% of total greenhouse gas emissions, and livestock contributes 3.8%
[2]. Nonetheless, enteric CH
4 emissions are responsible for 30% of the anthropogenic methane budget, highlighting the need for a clear understanding of factors that affect CH
4 production and development of practical mitigation strategies.
Methanogenesis is critical in cattle because it prevents accumulation of metabolic hydrogen in the rumen by serving as a reducing equivalent sink
[3]. Alternative hydrogen sinks exist, however, and these alternative sinks are affected by the ingredient and chemical composition of the diet, such that the quantity of CH
4 produced by cattle varies based on dietary constituents that are fed. Diets that produce acetate liberate hydrogen to be used by methanogenic archaea to produce CH
4. Conversely, propionate serves as a net hydrogen sink, and diets that increase propionate and decrease acetate result in decreased ruminal CH
4 production, reflecting decreased availability of metabolic hydrogen for methanogens to reduce CO
2 to CH
4.
2. Dietary Chemical Components and Enteric Methane Production
2.1. Relationships of Methane Production to Dry Matter Intake and Dietary Chemical Components
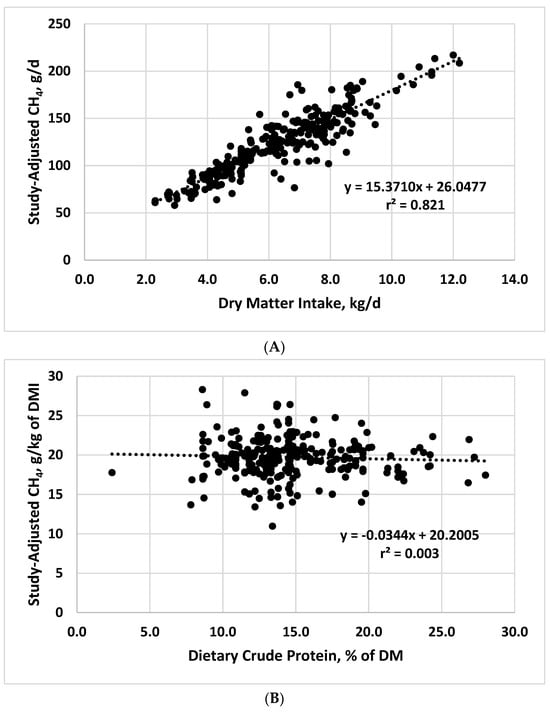
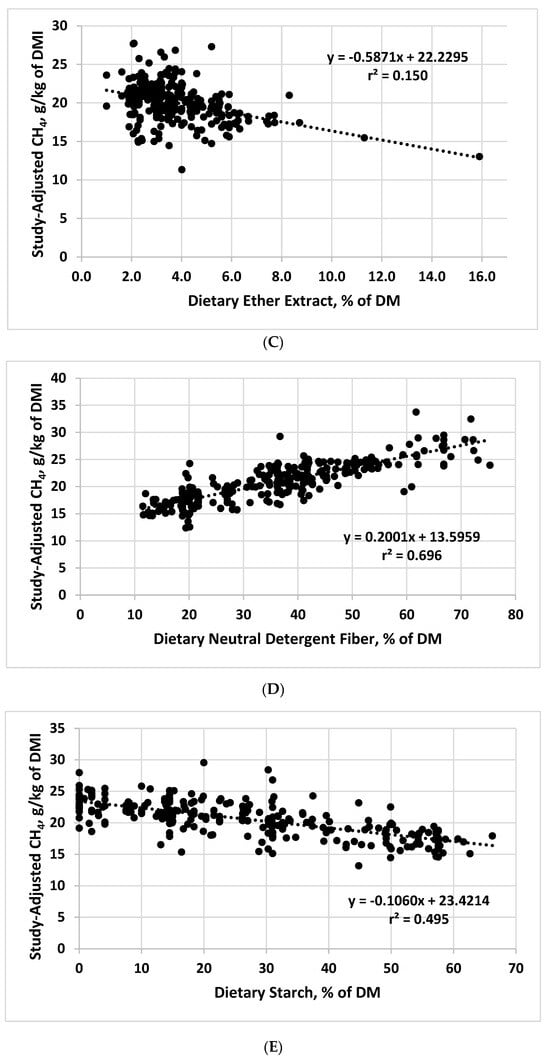
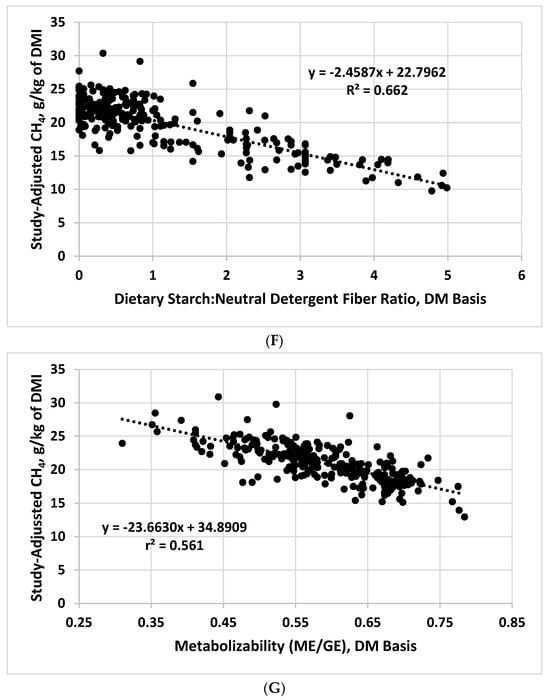
Results of the mixed model regression analyses are shown in
Table 1, with graphical representations of the relationships shown in
Figure 1. Because of the importance of DMI as a driver of enteric CH
4 production, initial analyses involved regression of daily CH
4 production on DMI. As expected, the relationship between these two variables was strong, with DMI accounting for 82.1% of the variation in daily CH
4 production (
Table 1;
Figure 1). Dry matter intake has consistently been identified as a key component of equations to predict CH
4 production in cattle
[4][5][6][7][9,10,11,12], with DMI alone often yielding prediction equations that are equivalent in accuracy and precision to more complex equations.
Figure 1. Relationships between study-adjusted enteric methane production (g/d or g/kg of dry matter intake) and dry matter intake DMI; (A), dietary crude protein (B), ether extract (C), neutral detergent fiber (D), starch (E), starch:neutral detergent fiber ratio (F), and diet metabolizability (metabolizable energy/gross energy; (G) developed from a literature database.
Table 1. Relationships between study-adjusted enteric methane production (g/d) and dry matter intake (DMI) and methane production expressed as g/kg of DMI and various dietary chemical components and diet metabolizability developed from a literature database 1.
| |
Regression Coefficients |
Regression Statistics |
| Item 2 |
Intercept |
Slope |
RMSE |
r2 |
| |
---- CH4, g/d ---- |
|
|
| Dry matter intake, kg/d |
26.0477 |
15.3710 |
13.96 |
0.821 |
| p-values 3 |
<0.001 |
<0.001 |
CV = 11.39% |
|
| Lower 95% CI |
20.2892 |
14.4950 |
|
|
| Upper 95% CI |
31.8062 |
16.2470 |
|
|
| |
---- CH4, g/kg of DMI ---- |
|
|
| Crude protein, % |
20.2005 |
−0.0344 |
2.53 |
0.003 |
| p-values 3 |
<0.001 |
0.381 |
CV = 12.82% |
|
| Lower 95% CI |
19.0317 |
−0.1115 |
|
|
| Upper 95% CI |
21.3694 |
0.0428 |
|
|
| Ether extract, % |
22.2295 |
−0.5871 |
2.31 |
0.150 |
| p-values 3 |
<0.001 |
<0.001 |
CV = 11.57 |
|
| Lower 95% CI |
21.5201 |
−0.7577 |
|
|
| Upper 95% CI |
22.9390 |
−0.4165 |
|
|
| Neutral detergent fiber, % |
13.5959 |
0.2001 |
2.02 |
0.696 |
| p-values 3 |
<0.001 |
<0.001 |
CV = 9.65 |
|
| Lower 95% CI |
12.9563 |
0.1840 |
|
|
| Upper 95% CI |
14.2355 |
0.2162 |
|
|
| Starch, % |
23.4214 |
−0.1060 |
2.04 |
0.495 |
| p-values 3 |
<0.001 |
<0.001 |
CV = 9.89 |
|
| Lower 95% CI |
22.9950 |
−0.1191 |
|
|
| Upper 95% CI |
23.8478 |
−0.0929 |
|
|
| Starch:neutral detergent fiber ratio |
22.7962 |
−2.4587 |
2.18 |
0.662 |
| p-values 3 |
<0.001 |
<0.001 |
CV = 10.91 |
|
| Lower 95% CI |
22.4363 |
−2.6730 |
|
|
| Upper 95% CI |
23.1561 |
−2.2444 |
|
|
| Metabolizability |
34.8909 |
−23.6630 |
1.84 |
0.561 |
| p-values 3 |
<0.001 |
<0.001 |
CV = 8.80 |
|
| Lower 95% CI |
33.3687 |
−26.2140 |
|
|
| Upper 95% CI |
36.4131 |
−21.1120 |
|
|


