Your browser does not fully support modern features. Please upgrade for a smoother experience.
Please note this is a comparison between Version 2 by Jessie Wu and Version 1 by Biswamohan Mishra.
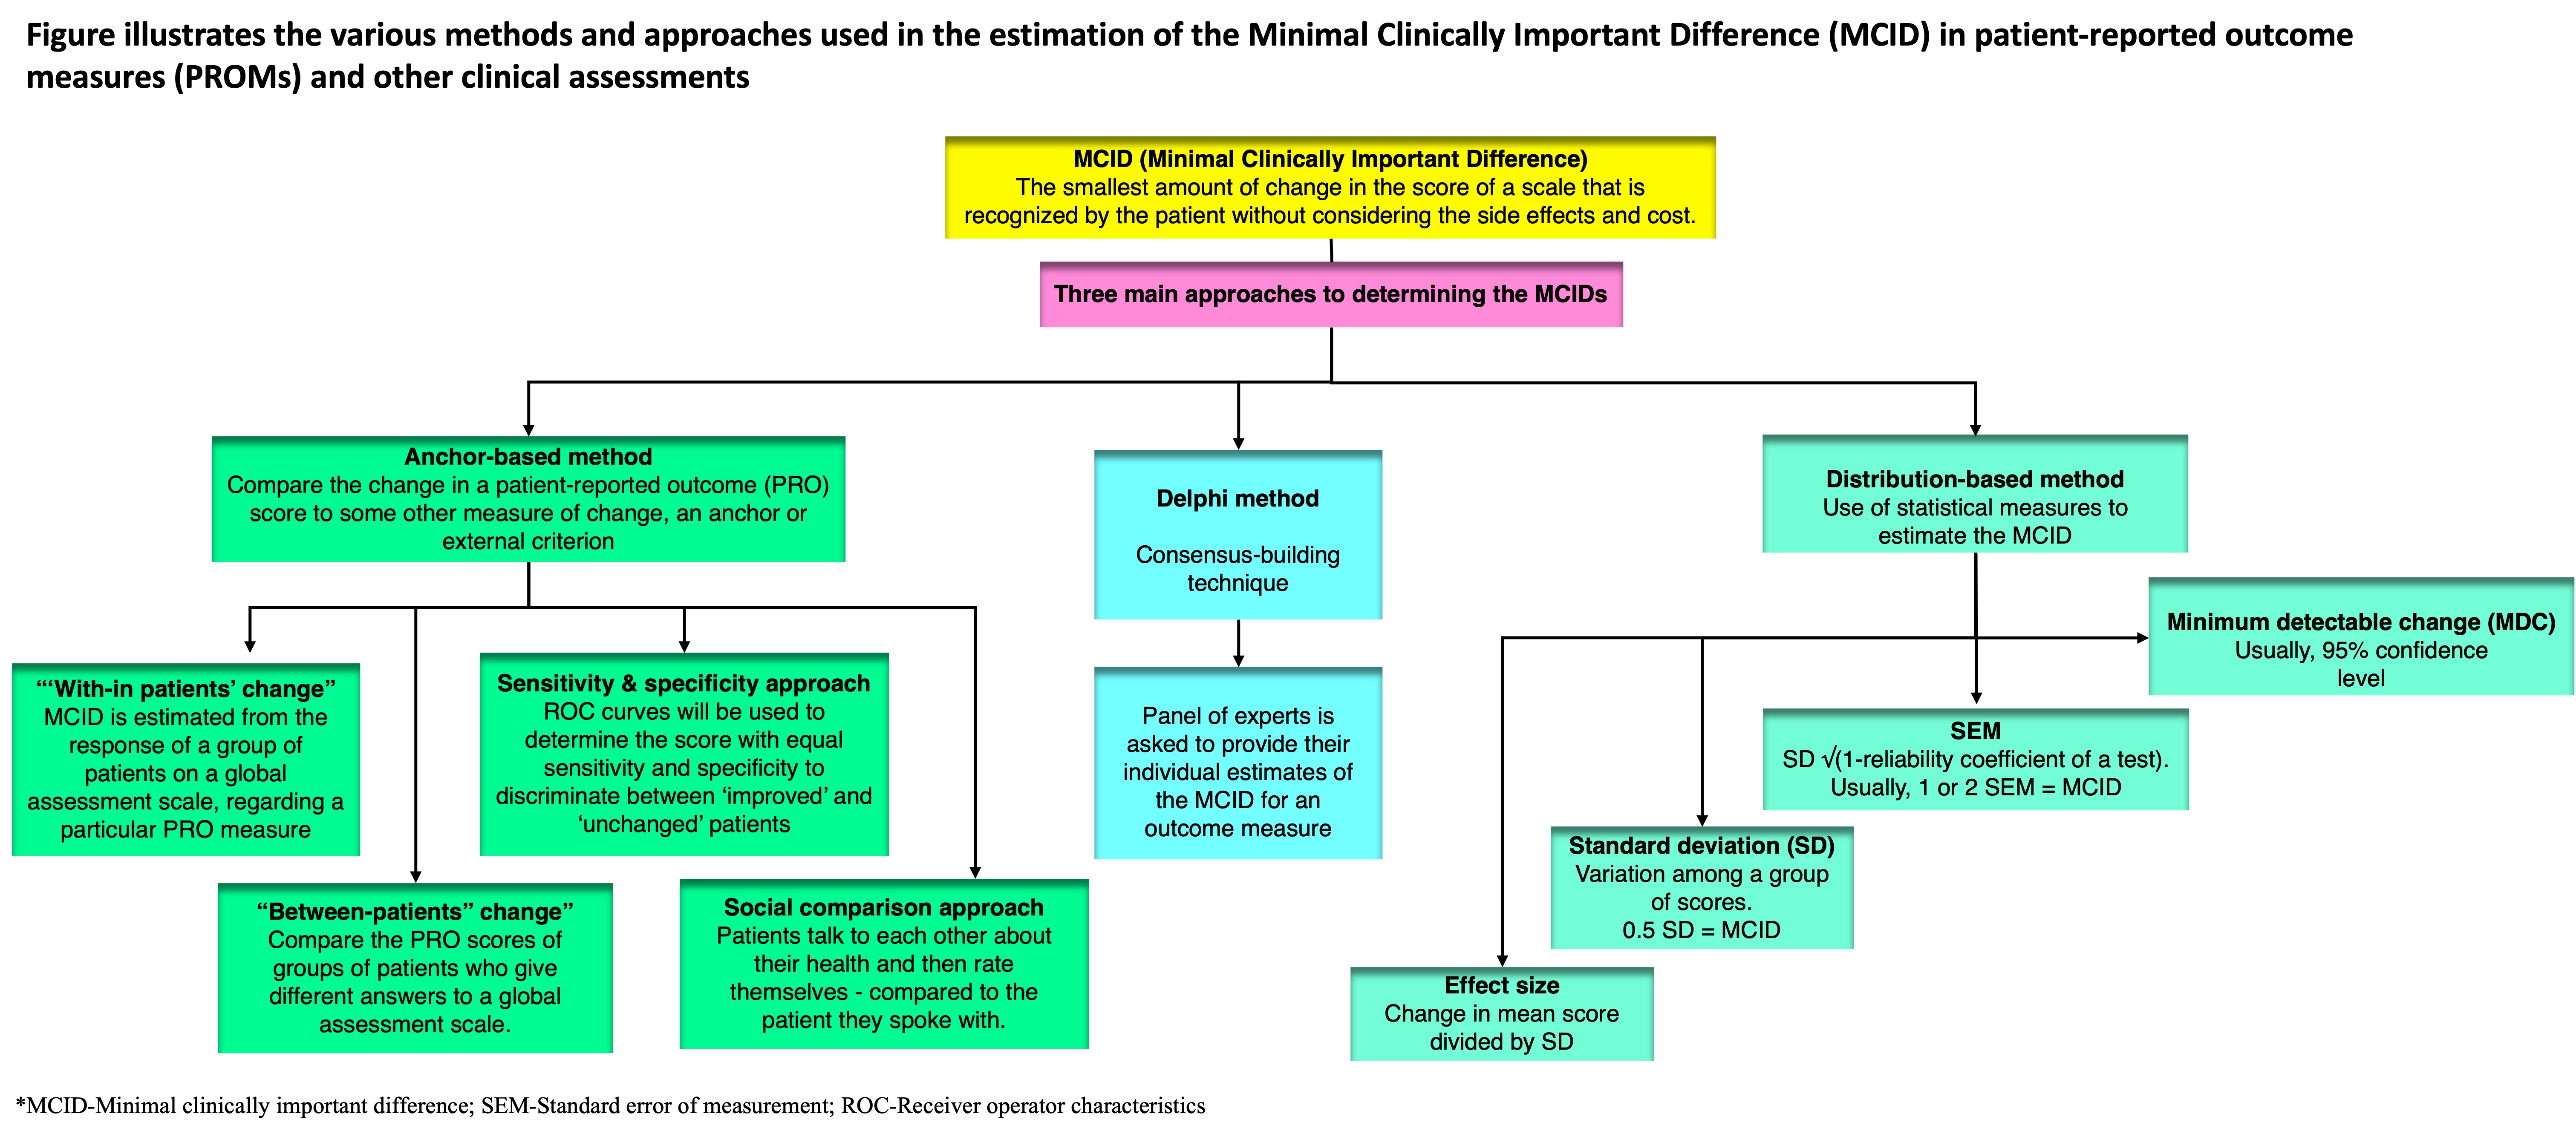
The origin of evidence-based medicine (EBM) dates back to the 1970s. This paradigm emphasizes a methodical evaluation of the evidence for use in health care decision-making, along with the knowledge of decision-makers and the expectations and values of patients. There is a growing awareness of correlating statistically significant results with clinical relevance in clinical trials to avoid the misinterpretation of study findings and prevent patients from being exposed to unnecessary therapies. The concept of “clinically important difference”, which has been developed as a way to overcome the drawbacks of a “statistically significant difference” and which represents a change that the patient feels, is noteworthy. The minimum clinically important difference (MCID) is the threshold value for such a change, first described by Jaeschke and colleagues in 1989. There has been a shift towards considering clinical relevance rather than just statistical significance in interpreting results from clinical trials. Multiple rating scales, such as the Modified Rankin Scale (mRS) and the Barthel Index (BI), are commonly used as outcome measures in both daily neurological practice and clinical trials, including stroke trials.
- stroke
- minimal clinically important difference
- minimal clinically important change
- clinical relevance
- Minimal Detectable Change
- MCID
- MDC
1. Anchor-Based Approach
Anchor-based approaches compare the change in a patient-reported outcome (PRO) score to some other measure of change, called an anchor or external criterion. The anchor can be either objective or subjective.
- a.
-
Objective anchors are based on physical measurements, such as the amount of pain medication a patient takes or the number of steps they can walk. These anchors are more reliable than subjective anchors, but they are not always available.
- b.
-
Subjective anchors are based on the patient’s own assessment of their health, such as how much better or worse they feel. These anchors are less reliable than objective anchors, but they are more commonly used because they are easier to obtain.
Some examples of objective anchors include:
-
The amount of pain medication a patient takes;
-
The number of steps a patient can walk;
-
The patient’s global assessment of their health (e.g., “better”, “worse”, or “unchanged”) (e.g., patient global impression of change (PGIC) or global rating of change (GROC));
-
The patient’s rating of their pain on a scale of 0 to 10;
-
The patient’s functional status (e.g., their ability to bathe, dress, or walk);
-
The patient’s rating of their overall health on a scale of 1 to 10;The patient’s quality of life.
- The clinician’s rating of the patient’s overall health on a scale of 1 to 10 (e.g., clinician global impression of change (CGIC)).
Interpreting patient-reported outcome (PRO) scores through anchor-based approaches is an evolving practice. The choice of anchor plays a crucial role in determining what magnitude of change in the PRO score is considered meaningful. For example, if the anchor is the amount of pain medication a patient takes, then a change of 10% in the PRO score might be considered meaningful. However, if the anchor is the patient’s rating of their overall health, then a change of 20% in the PRO score might be considered meaningful.
The strength of the association between the PRO score and the external criterion also affects how PRO scores are interpreted. A strong correlation suggests that changes in the PRO score are likely to be accompanied by changes in the external criterion. Research suggests that a correlation coefficient of at least 0.3 is necessary to make reliable inferences [11][1].
Objective external criteria are seldom used in studies, with most studies relying on patients’ subjective assessments or global assessment scales, leading to ongoing debates regarding their validity and reliability. The reliance on subjective assessments arises from the lack of satisfactory objective assessments, prompting the use of PROs in the first place [12][2].
Efforts have been made to validate patients’ subjective assessments by combining them with clinicians’ evaluations or considering physical therapists’ reports, yet the choice of external criterion remains critical [12,13,14][2][3][4]. Regardless of the chosen criterion, a well-established association between the criterion and the PRO measurement is essential for drawing meaningful conclusions [15][5]. Despite these efforts, anchor-based methods are vulnerable to recall bias, where recent events are better remembered than those in the distant past, and to the influence of the patient’s current health status on reported changes, underscoring the complexity of accurately capturing treatment effects through these methods [16][6]. Nevertheless, global assessment scales have demonstrated high sensitivity to change, both positive and negative [17][7].
While employing an external criterion is a shared feature in all anchor-based methods, several distinctions persist among these approaches. Four distinct variations can be discerned within anchor-based methodologies.
1.1. “With-in Patients” Score Change
In this method, the minimum clinically important differences (MCID) is estimated from the response of a group of patients on a global assessment scale regarding a particular PRO measure. Typical anchor-based studies have a Likert-type scale, like a 15-point global scale (−7 = ‘‘much worse’’ to 0 = ‘‘no change’’ to +7 = ‘‘much better’’), to record patient-reported changes. In early studies, the MCID was calculated as the average change for patients who reported small changes, meaning they rated themselves as slightly better (scores of 1, 2, or 3) [4][8]. Later, a score of 1 was treated as equivalent to 0, and only patients with scores of 2 or 3 were used to calculate MCID [18][9]. Similar techniques have been used with different scales; for example, some studies use a six-point scale, and the MCID is determined based on the mean change in scores of patients who reported being “much improved” [19][10].
1.2. “Between-Patients” Score Change
Another way to define the MCID is to compare the PRO scores of groups of patients who give different answers to a global assessment scale.
For example, in a cross-sectional study, the PRO scores of patients who say they are “not at all impaired” could be compared to the PRO scores of patients who say they are “very mildly impaired.” The MCID would then be defined as the difference in PRO scores between these two groups.
In a longitudinal study, we could compare the PRO scores of patients who say they have gotten “better” to the PRO scores of patients who say they have stayed “unchanged”. The MCID would then be defined as the difference in PRO scores between these two groups [17,20][7][11].
1.3. Sensitivity- and Specificity-Based Approach
This approach aims to find an MCID that best distinguishes between groups of patients. Sensitivity is how well a test identifies patients with a condition, while specificity is how well it identifies those without the condition. In this context, sensitivity means the proportion of patients who report an improvement in an external criterion and have PRO scores above the MCID value. Specificity means the proportion of patients who do not report improvement and have PRO scores below the MCID value. A sensitivity of 1 means all true positives are identified, while a specificity of 1 means all true negatives are identified [17][7]. There is no agreed-upon ideal sensitivity or specificity level for the MCID, but researchers often aim for balance.
Receiver operating characteristic (ROC) curves are frequently used to identify the PRO score that best distinguishes between “improved” and “unchanged” patients [12,14,19][2][4][10]. The area under the ROC curve reflects how well scores discriminate between these groups. An area of 0.7 to 0.8 is considered good, and 0.8 to 0.9 is excellent for accuracy, but the choice of patient groups for ROC analysis can still be somewhat arbitrary [21][12].
1.4. Social Comparison Approach
In a less commonly used approach, patients talk to each other about their health and then rate themselves as “a little better,” “a little worse”, or “about the same” compared to the patient they spoke with. The MCID is the score difference between those who rate themselves as “a little better” or “a little worse” and those who say they are “about the same” as the other patient [22][13].
2. Distribution-Based Approaches
Distribution-based approaches use statistical measures to determine the MCID. These include those mentioned in the following sections.
2.1. SEM (Standard Error of Measurement)
The SEM represents a variation in scores due to measurement unreliability. If a change is smaller than the SEM, it is likely due to measurement error rather than a real change. At the least, 1 SEM may be used as the yardstick of true change for individual or group change scores, but there is no consensus on a general value [23,24][14][15].
2.2. MDC (Minimum Detectable Change)
The MDC is the smallest change that can be considered real, rather than a measurement error, with a certain level of confidence (usually 95%) [25][16]. A valid MCID should be at least as large as the observed MDC [17][7].
2.3. SD (Standard Deviation)
Some studies have found that 0.5 SD corresponds to the MCID. This is because 0.5 SD represents the limit of human discriminative capacity and is equivalent to 1 SEM with a reliability of 0.75 [26][17].
2.4. Effect Size
Effect size measures change by comparing post-treatment scores to baseline scores, standardized by the baseline score’s standard deviation. An effect size of 0.2 is small, 0.5 is moderate, and 0.8 is large [25][16]. The MCID corresponds to the change score associated with a small effect size (0.2), calculated by multiplying the baseline score’s SD by 0.2 [27][18].
Distribution-based methods solely rely on statistical approaches without incorporating clinical questionnaires and are tailored to the specific characteristics of the patient cohort. While they can capture changes beyond random variation, these methods lack agreed-upon benchmarks for establishing clinically significant improvement. Furthermore, they do not consider the patient’s perspective of what constitutes a clinically important change, which differs significantly from statistical significance [3,28][19][20].
3. The Delphi Method
A lesser-used approach to estimate the MCID is the Delphi method. The Delphi method is a consensus-building technique that can be used to estimate the minimally important change (MCID) for an outcome measure. In the Delphi method, a panel of experts is asked to provide their individual estimates of the MCID. The experts are then given feedback on the range of estimates provided by the other experts. This process is repeated until a consensus is reached on the MCID.
The Delphi method is particularly well-suited for estimating the MCID for technical efficacy outcomes, such as reperfusion after stroke. These outcomes are often difficult for patients to assess, and so expert opinion is needed to determine the smallest change that is likely to be clinically meaningful [29][21].
However, it can be a time-consuming process, as it may take several rounds of feedback to reach a consensus on the MCID. Also, it is subject to the biases of the panel of experts. If the panel is not representative of the population of experts, then the MCID may not be generalizable to the wider population [30][22].
4. Case Scenario: Hypothetical Illustration
Consider the example of a commonly used outcome measure in stroke, i.e., the Modified Rankin Scale (mRS), a six-point scale that is used to assess disability after stroke.
-
Method: Distribution-based method; estimated MCID: one-point change.
A one-point change in mRS score is considered to be a minimally important change because it is associated with a noticeable difference in the patient’s level of disability. For example, a patient who moves from a score of 3 (moderately disabled) to a score of 2 (slightly disabled) is likely to experience a significant improvement in their ability to function independently.
-
Method: Anchor-based method.
MCID: Change in mRS score that is associated with a minimally important change in a patient-reported outcome measure (PROM), such as the Stroke Impact Scale (SIS).
For example, a study might find that a one-point change in mRS score is associated with a ten-point change on the SIS. This would suggest that a one-point change in mRS score is a minimally important change because it is associated with a noticeable difference in the patient’s self-reported quality of life.
-
Method: Expert consensus/Delphi method.
MCID: Change in mRS score that is identified by a panel of experts as being the smallest change that they would consider to be clinically important.
For example, a panel of stroke experts might be asked to estimate the smallest change in mRS score that they would consider to be a minimally important change. The experts might agree that a one-point change in mRS score is a minimally important change because it is associated with a noticeable difference in the patient’s overall neurological status.
5. Choice of Method Depending on Outcome Measure
Various approaches for establishing the minimal clinically important difference (MCID) might be more appropriate depending on the nature of the outcomes. For example, anchor-based methods may be more appropriate for patient-reported outcomes (PROMs) because they compare the change in a scale-based outcome measure with that of a patient-reported outcome or other external criterion. On the other hand, distribution-based methods may be more appropriate for objective measures because they compare the difference in a scale-based outcome measure to a prespecified threshold value of its uncertainty, which facilitates MCID derivation when direct patient or clinician input is not readily accessible [31][23].
6. Limitations of Minimum CIDlinically Important differences
The estimation of MCID has its own limitations. Three general limitations in the accurate determination of an MCID have been identified: the multiplicity of MCID determinations, the loss of the patient’s perspective, and the relationship between the pretreatment baseline and post-treatment score change.
6.1. Multiplicity of Minimum CIDlinically Important Differences Determinations
MCID studies aim to find a unique threshold value, but different methods produce a variety of MCID values. Anchor-based methods will produce different MCIDs depending on the criterion scale and the arbitrary selection or grouping of scale levels. Combining levels on a scale is a common but arbitrary procedure in MCID studies. Distribution-based methods also yield different values of MCID depending on the measure of statistical variability. Although methods relying on the SEM and MCD ensure the statistical soundness of an MCID value, other methods do not. More importantly, distribution-based approaches do not address the question of clinical importance and ignore the purpose of the MCID, which is to distinctly separate clinical importance from statistical significance. Another limitation of distribution-based approaches is that they are sample-specific, in the sense that the MCID value depends on the variability of the scores in the studied samples.
Several other factors can also influence the variability in reported MCID scores, including the characteristics of the study population. Patient-specific attributes such as age, sex, BMI, disease type and severity, treatment modality, and follow-up duration can notably impact the determined MCID score. Consequently, MCID scores should be viewed as context-specific rather than absolute values [18,32][9][24]. For example, in the case of a surgical procedure with high risk and prolonged recovery, patients would anticipate a more substantial improvement to consider it clinically relevant and justifiable compared to instances where minor lifestyle adjustments suffice.
In a recent study, Franceschini et al., 2023, assessed and compared the MCID values for a patient-reported outcome measure (PROM) in knee osteoarthritis patients treated with intra-articular platelet-rich plasma. Utilizing various calculation methods, the study found that the MCID values varied widely, ranging from 1.8 to 25.9 points. Anchor-based approaches produced values ranging from 6.3 to 25.9, while distribution-based methods were between 1.8 and 13.8 points. This restudyearch demonstrated how different MCID calculation methods result in markedly different values, substantially impacting the percentage of patients meeting the MCID in a specific population [33][25].
6.2. Lack of Consideration for the Cost–Benefit Ratio
The cost of treatment is often neglected in determining the MCID. While the original definition of MCID acknowledged the need to consider costs (“in the absence of … excessive cost”), most studies rely on global assessment scales, which fail to account for the expenses associated with the change. Patients may perceive an improvement, but considering the costs, they might not find the benefit to be worth it [34][26].
6.3. Challenges of Ordinal Scales in Minimum CIDlinically Important differences Estimation
Ordinal scales are scales that rank items in order, but the distance between items on the scale is not necessarily equal. For example, a pain scale from 0 to 10 is an ordinal scale, but the difference between 2 and 3 on the scale may not be the same as the difference between 7 and 8 [35][27]. Using ordinal scales to estimate the MCID can be problematic. This is because the lack of a fixed unit in ordinal scales makes it difficult to compare changes in scores across different patients and different studies. Modern techniques like the Rasch model can help to transform ordinal scales into interval-based scales. Interval-based scales are scales where the distance between items on the scale is equal. This makes it easier to compare changes in scores on interval-based scales. However, the Rasch model is a complex statistical technique, and it is not always possible to use it to transform ordinal scales into interval-based scales. In addition, even if the Rasch model is used, it is important to interpret the results carefully, as the MCID is still a subjective measure.
6.4. Changes in Patient-ROeported Outcome Scores Are Linked to Baseline Scores
Reasons for this issue:
- a.
Addressing this issue:
Additional points:
- d.
Determining the MCID in stroke patients can be challenging, as the impact of stroke can vary greatly depending on the severity, location, and type of stroke, as well as the patient’s age, medical history, and overall health. The MCID can also change over time as patients recover or experience further decline. The majority of studies in the literature reporting on MCID measures in stroke use various scales for assessing recovery after stroke.
References
- Ousmen, A.; Touraine, C.; Deliu, N.; Cottone, F.; Bonnetain, F.; Efficace, F.; Brédart, A.; Mollevi, C.; Anota, A. Distribution- and anchor-based methods to determine the minimally important difference on patient-reported outcome questionnaires in oncology: A structured review. Health Qual. Life Outcomes 2018, 16, 228.
- Stratford, P.W.; Binkley, J.M.; Riddle, D.L.; Guyatt, G.H. Sensitivity to change of the Roland-Morris Back Pain Questionnaire: Part 1. Phys. Ther. 1998, 78, 1186–1196.
- Walsh, T.L.; Hanscom, B.; Lurie, J.D.; Weinstein, J.N. Is a condition-specific instrument for patients with low back pain/leg symptoms really necessary? The responsiveness of the Oswestry Disability Index, MODEMS, and the SF-36. Spine 2003, 28, 607–615.
- Riddle, D.L.; Stratford, P.W.; Binkley, J.M. Sensitivity to change of the Roland-Morris Back Pain Questionnaire: Part 2. Phys. Ther. 1998, 78, 1197–1207.
- Guyatt, G.H.; Osoba, D.; Wu, A.W.; Wyrwich, K.W.; Norman, G.R.; Clinical Significance Consensus Meeting Group. Methods to explain the clinical significance of health status measures. Mayo Clin. Proc. 2002, 77, 371–383.
- Norman, G.R.; Stratford, P.; Regehr, G. Methodological problems in the retrospective computation of responsiveness to change: The lesson of Cronbach. J. Clin. Epidemiol. 1997, 50, 869–879.
- Hägg, O.; Fritzell, P.; Nordwall, A. The clinical importance of changes in outcome scores after treatment for chronic low back pain. Eur. Spine J. 2003, 12, 12–20.
- Jaeschke, R.; Singer, J.; Guyatt, G.H. Measurement of health status: Ascertaining the minimal clinically important difference. Control. Clin. Trials 1989, 10, 407–415.
- Juniper, E.F.; Guyatt, G.H.; Willan, A.; Griffith, L.E. Determining a minimal important change in a disease-specific Quality of Life Questionnaire. J. Clin. Epidemiol. 1994, 47, 81–87.
- van der Roer, N.; Ostelo, R.W.J.G.; Bekkering, G.E.; van Tulder, M.W.; de Vet, H.C.W. Minimal clinically important change for pain intensity, functional status, and general health status in patients with nonspecific low back pain. Spine 2006, 31, 578–582.
- Kulkarni, A.V. Distribution-based and anchor-based approaches provided different interpretability estimates for the Hydrocephalus Outcome Questionnaire. J. Clin. Epidemiol. 2006, 59, 176–184.
- Hosmer, D.W.; Lemeshow, S. Applied Logistic Regression, 1st ed.; Wiley: Hoboken, NJ, USA, 2000; Available online: https://onlinelibrary.wiley.com/doi/book/10.1002/0471722146 (accessed on 2 October 2023).
- Redelmeier, D.A.; Guyatt, G.H.; Goldstein, R.S. Assessing the minimal important difference in symptoms: A comparison of two techniques. J. Clin. Epidemiol. 1996, 49, 1215–1219.
- Wyrwich, K.W.; Nienaber, N.A.; Tierney, W.M.; Wolinsky, F.D. Linking clinical relevance and statistical significance in evaluating intra-individual changes in health-related quality of life. Med. Care. 1999, 37, 469–478.
- Wyrwich, K.W.; Tierney, W.M.; Wolinsky, F.D. Further evidence supporting an SEM-based criterion for identifying meaningful intra-individual changes in health-related quality of life. J. Clin. Epidemiol. 1999, 52, 861–873.
- Cohen, J. Statistical Power Analysis for the Behavioral Sciences, 2nd ed.; Routledge: Oxfordshire, UK, 2013; Available online: https://www.taylorfrancis.com/books/9781134742707 (accessed on 2 October 2023).
- Norman, G.R.; Sloan, J.A.; Wyrwich, K.W. Interpretation of changes in health-related quality of life: The remarkable universality of half a standard deviation. Med. Care. 2003, 41, 582–592.
- Samsa, G.; Edelman, D.; Rothman, M.L.; Williams, G.R.; Lipscomb, J.; Matchar, D. Determining clinically important differences in health status measures: A general approach with illustration to the Health Utilities Index Mark II. Pharmacoeconomics 1999, 15, 141–155.
- Copay, A.G.; Subach, B.R.; Glassman, S.D.; Polly, D.W.; Schuler, T.C. Understanding the minimum clinically important difference: A review of concepts and methods. Spine J. 2007, 7, 541–546.
- Watt, J.A.; Veroniki, A.A.; Tricco, A.C.; Straus, S.E. Using a distribution-based approach and systematic review methods to derive minimum clinically important differences. BMC Med. Res. Methodol. 2021, 21, 41.
- Niederberger, M.; Spranger, J. Delphi Technique in Health Sciences: A Map. Front. Public Health 2020, 8, 457. Available online: https://www.frontiersin.org/articles/10.3389/fpubh.2020.00457 (accessed on 22 October 2023).
- Mouelhi, Y.; Jouve, E.; Castelli, C.; Gentile, S. How is the minimal clinically important difference established in health-related quality of life instruments? Review of anchors and methods. Health Qual. Life Outcomes 2020, 18, 136.
- Wang, Y.; Devji, T.; Carrasco-Labra, A.; King, M.T.; Terluin, B.; Terwee, C.B.; Walsh, M.; A Furukawa, T.; Guyatt, G.H. A step-by-step approach for selecting an optimal minimal important difference. BMJ 2023, 381, e073822.
- Wright, A.; Hannon, J.; Hegedus, E.J.; Kavchak, A.E. Clinimetrics corner: A closer look at the minimal clinically important difference (MCID). J. Man. Manip. Ther. 2012, 20, 160–166.
- Franceschini, M.; Boffa, A.; Pignotti, E.; Andriolo, L.; Zaffagnini, S.; Filardo, G. The Minimal Clinically Important Difference Changes Greatly Based on the Different Calculation Methods. Am. J. Sports Med. 2023, 51, 1067–1073.
- Kirwan, J.R. Minimum clinically important difference: The crock of gold at the end of the rainbow? J. Rheumatol. 2001, 28, 439–444.
- Stevens, S.S. On the Theory of Scales of Measurement. Science 1946, 103, 677–680.
- Farrar, J.T.; Portenoy, R.K.; Berlin, J.A.; Kinman, J.L.; Strom, B.L. Defining the clinically important difference in pain outcome measures. Pain 2000, 88, 287–294.
- Beaton, D.E.; Boers, M.; Wells, G.A. Many faces of the minimal clinically important difference (MCID): A literature review and directions for future research. Curr. Opin. Rheumatol. 2002, 14, 109–114.
- Bolton, J.E. Sensitivity and specificity of outcome measures in patients with neck pain: Detecting clinically significant improvement. Spine 2004, 29, 2410–2417, discussion 2418.
More