Chemiluminescence Measurements of Premixed Flames Applying Abel Transform: Comparison
Please note this is a comparison between Version 3 by Jason Zhu and Version 2 by Jason Zhu.

The temperature field and chemiluminescence measurements of axisymmetric flame are obtained simultaneously in only one image. Digital Laser Speckle Displacement measures temperature fields, and direct image flame determines chemiluminescence values. Applying the Abel transform of axisymmetric objects for volume visualization requires smooth intensity profiles. Due to the nature of the experimental setup, direct image flame is corrupted with speckle noise and a crosstalk effect. These undesirable effects deteriorate the measurement results. Then, experimental data need crosstalk correction and speckle noise reduction to improve the measurements. 

  • chemiluminescence
  • optics
  • fluid flow
  • premixed flames

1. Introduction

Studying a combustion process is a very complex task [1]. However, the characterization of a flame is essential to improve the combustion process’s efficiency and reduce pollutant emissions. Measuring several variables in a flame is used to monitor the efficiency of combustion processes. Generally, some measured variables are flame temperature, soot concentration, radical intensities, flame size, luminosity, and flickering [2][3][4][5][6][7][8][9][10][11][12][13][14][15][16][17][18][19][20][21][22]. Full-field optical techniques are usually used to make this kind of measurement because they give a global description of the process and do not disturb the sample. On the other hand, simultaneously measuring several variables is preferable because this avoids the lack of correlation between them [9][16][17][18][19]. However, a complex optical setup is usually employed for measurement in such cases, making the task costly and challenging [16][18].
The flame equivalence ratio (𝛷) is an adimensional variable used to determine if a fuel-oxidizer mixture is rich, lean, or stoichiometric [1]. When 𝛷>1, it denotes a fuel-rich mixing process; on the other hand, 𝛷<1 is related to fuel-lean mixtures, and the last 𝛷=1 in the ratio relationship is the value for stoichiometric mixing. This relation is intrinsically linked to determining a system’s performance. This study, as in others, corroborates that the maximum temperature value is obtained at a value of 𝛷=1.05 for LPG fuel. Other variables that can be connected directly to the flame equivalence ratio are the temperature and radical intensities (chemiluminescence) [10][11][12][13][14][15][16][17][18][19]. In a combustion process, some released species are OH, CH, CH2O, and C2, which have a specific emission spectrum [10][11][12][13][14][15][16][17][18][19]. In these combustion flames, the presence of radicals C2 and CHare inherent in the reaction zone. These two chemical species are most abundant within the flame. Furthermore, these radicals emit in the visible region of the electromagnetic spectrum, centered at wavelengths 430 nm and 525 nm, respectively [14]. For this reason, digital color cameras play an essential role in chemiluminescence measurements [11][12][13][14][15][16][17][18]. In this analysis, each color channel contributes specific information about the object under study. However, most digital color cameras suffer from the crosstalk effect; this occurs when sensors have overlapping sensibilities, contaminating the recorded data and needing correction [15][17].
There are few works in which chemiluminescence and flame temperature are measured [3][16][17][18]. In one of the works, the optical system is simple; they only use a camera, and the temperature is measured using two-color pyrometry. However, temperature measurement is applicable only for sooty flames [3]. In other research, two-color pyrometry is also used to determine the flame’s temperature; however, the optical arrangement is complex [16][18]. In [17], the optical configuration is simple to implement, and Digital Laser Speckle Displacement (DLSD) is used to determine the temperature fields. However, the chemiluminescence measurements are contaminated with speckle noise, making determining these values difficult.

2. Theoretical Development of Intensity Profiles on Flames

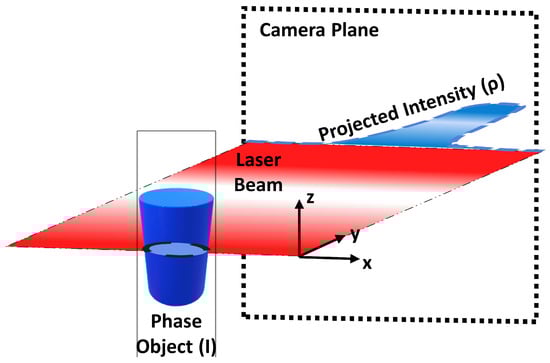
When a frame of information is registered on the camera plane, it corresponds to the projected intensity profile of the flame. In some studies of combustion analysis, it is a common topic of interest to determine the reconstructed profile [23]. Therefore, homolog Abel deconvolution techniques can be used from speckle displacement to intensity. The direct and inverse Abel transforms are linked to analyze the desirable plane:
ρx,z=2msubsup
(1)
Ir,z=mfrac
(2)
where 𝜌(𝑥,𝑧) is represented in rectangular reference coordinates and (x,z) is the profile intensity on the camera plane (see Figure 1). 𝜌 can be the chemiluminescence and temperature values. Moreover, 𝐼(𝑟,𝑧) is the original profile intensity of the object in three dimensions in cylindrical coordinates; this is due to the nature of the axisymmetric flames. The main interest is obtaining the flame’s reconstructed profile intensity 𝐼(𝑟,𝑧). These profiles are contaminated with speckle phenomena and the crosstalk effect, which makes signal clean-up difficult.

Figure 1. Intensity profile projected on the camera plane from the phase object.

3. Algorithm for Profile Intensity Noise Reduction

Temperature and chemiluminescence values are obtained using DLSD. The data corresponding to chemiluminescence values require speckle noise reduction. Noise reduction is achieved using a four-order PDE to create a later curve fitting, utilizing a set of Gaussian functions. 1. Elimination of background noise: Firstly, it is necessary to perform a subtraction from the object image minus the reference image:
msubsup
(3)
In Equation (3), the prefix S refers to the subtracted image obtained from the object (O) minus the reference image (R); the superscript rgb means that these are color images and all the channels are involved. In order to reduce the residual speckle presence in the neighborhood of the flame, a median filter is used. Afterward, a simple segmentation is performed to isolate the flame from the background:
msubsup
(4)
where N and F are the resultant matrices with the background and flame information, respectively, and the superscript 𝑆𝑐 means this operation needs to be applied to each channel independently; here, 𝑡 is found by an iterative method [20]. 2. Filter using a four-order (PDE): The residual existence of speckles is characteristic as the median filter is insufficient to eliminate it. Let the Laplacian of the intensity data be 𝜌𝑛𝑖,𝑗 and the subscripts i,j be the discretized values of the coordinates (x,z) from the data obtained on the camera, then:
msup
(5)
where the superscript 𝑛 means that the target function 𝜌(𝑖,𝑗) is calculated by an iterative method, and is the stepsize, in the first iteration, a seed value is necessary to obtain the next value on the iteration 𝑛+1; therefore, the recursive relation is:
msubsup
(6)
where 𝜔 is a step size linked to the velocity of convergence in the solution, with a suggested value of 𝜔= 0.25. 3. Curve fitting by a set of Gaussian bases and deconvolution: Using a finite differences method implies a stagger effect on the pixel values. Therefore, a curve fitment adjustment improves integration performance over the intensity data [24].
ρx,z=munderover
(7)
where 𝜌(𝑥,𝑧) is the profile to adjust for a fixed z; in this case, for axisymmetric flames, a set of Gaussian functions can be used appropriately to fit the intensity profiles. Here, 𝑓𝑖(𝑥,𝑧)=𝑒𝑥𝑝((𝑥𝜇 )22𝜎2), where μ is the mean value of the data from the respective profile, and 𝜎 is the standard deviation of the intensity values. Equation (7) can be applied to all the profiles of the image and be represented as a matrix system:
msub
(8)
The matrix system in (8) is a system of the type Aw=B, where m is the profile position and can be solved by a matrix solution process to obtain the weights.

3. Abel Reconstruction

After profile noise reduction and curve fitting, 3D Abel transform reconstruction is applied to chemiluminescence and temperature values [17]. Equation (3) is used to fulfill such a purpose. A numerical approximation proposal in N. A. Fomin is used to obtain an approximate reconstruction of the object intensity [25].

4. Crosstalk Correction

Given the nature of the optical setup to perform temperature and chemiluminescence measurements, the construction of the color camera that uses a Bayer-type filter responsible for the sensibility is more prominent on the green channel than the other two in this device. Therefore, crosstalk correction is needed to obtain the trust intensity values on the object plane. Furthermore, due to the regulation of parameters such as exposure time, saturation, and others, an approximation of intensity values in the pixels can be proposed in the following way:
mover
(9)
In this notation, the letter I means that this correction applies to the reconstructed object intensity profiles. Moreover, 𝐼𝑖̂(𝑟,𝑧) in the equation is the corrected profile against the crosstalk effect for each RGB color, which means there is a proportionality for each pixel to denote the influence from the overlapped spectral response in the camera, the 𝐴𝑖,𝑗 coefficient denotes this; as long as 𝐼𝑗 is the uncorrected intensity registered on the camera sensor; here, the indices ‘i’ and ‘j’ refer to the color of the illumination source and each pixel, respectively. This equation can be represented in matrix form as follows.
𝐼𝑟̂=𝐴𝑟0𝐼0+𝐴𝑟1𝐼1+𝐴𝑟2𝐼2
I r ^ = A r 0 I 0 + A r 1 I 1 + A r 2 I 2
𝐼𝑔̂=𝐴𝑔0𝐼0+𝐴𝑔1𝐼1+𝐴𝑔2𝐼2
I g ^ = A g 0 I 0 + A g 1 I 1 + A g 2 I 2
𝐼𝑏̂=𝐴𝑏0𝐼0+𝐴𝑏1𝐼1+𝐴𝑏2𝐼2
I b ^ = A b 0 I 0 + A b 1 I 1 + A b 2 I 2
The values of the A coefficients can be obtained from the camera’s graph spectral response. It has been established that certain chemical species are related to efficiency in a combustion process. Two of them are analyzed due to the nature of the premixed flames. These radicals are CH* and C2, which emit on the visible region of the electromagnetic spectrum around ~430 nm and ~515 nm, respectively [14]. Green and blue channels of the color camera are used to measure them. On the other hand, the illumination source, the He-Ne laser, has a wavelength of 633 nm, and is related to calculating temperature profiles related to speckle displacements. Therefore, the effect or red illumination source is depreciated for crosstalk analysis, so subscripts 1 and 2 can be considered for chemiluminescence analysis, substituting them for G and B, respectively; the set of equations [12] can be approximated to a system of two equations with two unknowns.
𝐼𝑔̂𝐴𝑔𝐺𝐼𝐺+𝐴𝑔𝐵𝐼𝐵
I g ^ A g G I G + A g B I B
𝐼𝑏̂𝐴𝑏𝐺𝐼𝐺+𝐴𝑏𝐵𝐼𝐵
I b ^ A b G I G + A b B I B
The previous equations are solved to find the solutions for intensity values from each color channel, as follows:
msub
(10)
msub
(11)
Therefore, the values of intensities 𝐼𝐺 and 𝐼𝐵 correspond to the chemiluminescence measurements.

References

  1. Günther, R. Flames—Their Structure, Radiation and Temperature. Von A. G. Gaydon und H. G. Wolfhard. Chapman and Hall Ltd., London 1979 4. Aulf., XIII, 449 S., zhalr. Abb. u. Tab., Ln., £18.00. Chem. Ing. Tech. 1979, 51, 765.
  2. Zhou, Y.; Zheng, D. Study on Measurement of Flame Temperature Using a Linear CCD. In Proceedings of the International Technology and Innovation Conference 2006 (ITIC 2006), London, UK, 11–12 October 2006; IEEE: Hangzhou, China, 2006; Volume 2006, pp. 1647–1650.
  3. Toro, N.C.; Arias, P.L.; Torres, S.; Sbarbaro, D. Flame Spectra-Temperature Estimation Based on a Color Imaging Camera and a Spectral Reconstruction Technique. Appl. Opt. 2014, 53, 6351.
  4. Zhao, H.; Feng, H.; Xu, Z.; Li, Q. Research on Temperature Ditribution of Combustion Flames Based on High Dynamic Range Imaging. Opt. Laser Technol. 2007, 39, 1351–1359.
  5. Alvarez-Herrera, C.; Moreno-Hernández, D.; Barrientos-García, B. Temperature Measurement of an Axisymmetric Flame by Using a Schlieren System. J. Opt. A Pure Appl. Opt. 2008, 10, 104014.
  6. Farrell, P.V.; Hofeldt, D.L. Temperature Measurement in Gases Using Speckle Photography. Appl. Opt. 1984, 23, 1055.
  7. Fujisawa, N.; Aiura, S.; Ohkubo, M.; Shimizu, T. Temperature Measurement of Dilute Hydrogen Flame by Digital Laser-Speckle Technique. J. Vis. 2009, 12, 57–64.
  8. Wang, Y.; Chung, S.H. Soot Formation in Laminar Counterflow Flames. Prog. Energy Combust. Sci. 2019, 74, 152–238.
  9. Legros, G.; Wang, Q.; Bonnety, J.; Kashif, M.; Morin, C.; Consalvi, J.-L.; Liu, F. Simultaneous Soot Temperature and Volume Fraction Measurements in Axis-Symmetric Flames by a Two-Dimensional Modulated Absorption/Emission Technique. Combust. Flame 2015, 162, 2705–2719.
  10. Hardalupas, Y.; Orain, M.S.; Panoutsos, C.; Taylor, A.M.K.P.; Olofsson, J.; Seyfried, H.; Richter, M.; Hult, J.; Aldén, M.; Hermann, F.; et al. Chemiluminescence Sensor for Local Equivalence Ratio of Reacting Mixtures of Fuel and Air (FLAMESEEK). Appl. Therm. Eng. 2004, 24, 1619–1632.
  11. Kojima, J.; Ikeda, Y.; Nakajima, T. Basic Aspects of OH(A), CH(A), and C2(d) Chemiluminescence in the Reaction Zone of Laminar Methane–Air Premixed Flames. Combust. Flame 2005, 140, 34–45.
  12. Huang, H.-W.; Zhang, Y. Flame Colour Characterization in the Visible and Infrared Spectrum Using a Digital Camera and Image Processing. Meas. Sci. Technol. 2008, 19, 085406.
  13. Huang, H.W.; Zhang, Y. Digital Colour Image Processing Based Measurement of Premixed CH4+air and C2H4+air Flame Chemiluminescence. Fuel 2011, 90, 48–53.
  14. Trindade, T.; Ferreira, A.; Fernandes, E. Characterization of Combustion Chemiluminescence: An Image Processing Approach. Procedia Technol. 2014, 17, 194–201.
  15. Yang, J.; Ma, Z.; Zhang, Y. Improved Colour-Modelled CH* and C2* Measurement Using a Digital Colour Camera. Measurement 2019, 141, 235–240.
  16. Cai, W.; Kaminski, C.F. A Tomographic Technique for the Simultaneous Imaging of Temperature, Chemical Species, and Pressure in Reactive Flows Using Absorption Spectroscopy with Frequency-Agile Lasers. Appl. Phys. Lett. 2014, 104, 034101.
  17. Zamarripa-Ramírez, J.C.I.; Moreno-Hernández, D.; Martinez-Gonzalez, A. Simultaneous Measurement of Temperature and Color Spectrum of Axisymmetric Premixed Flames Using Digital Laser Speckle Photography and an Image Processing Approach. Meas. Sci. Technol. 2021, 32, 105903.
  18. Chorey, D.; Jagadale, V.; Prakash, M.; Hanstorp, D.; Andersson, M.; Deshmukh, D.; Mishra, Y.N. Simultaneous Imaging of CH*, C2*, and Temperature in Flames Using a DSLR Camera and Structured Illumination. Appl. Opt. 2023, 62, 3737.
  19. Hardalupas, Y.; Orain, M. Local Measurements of the Time-Dependent Heat Release Rate and Equivalence Ratio Using Chemiluminescent Emission from a Flame. Combust. Flame 2004, 139, 188–207.
  20. Lundberg, J.; Henriksen, M.; Gaathaug, A. Using Image Processing for Flame Diagnostics. In Linköping Electronic Conference Proceedings, Proceedings of the 58th Conference on Simulation and Modelling (SIMS 58) Reykjavik, Iceland, 25–27 September 2017; Linköping University Electronic Press: Linköping, Sweden, 2017; pp. 168–173.
  21. Al-Tayyar, M.A.; AlKhafaji, D.; Shahad, H.A. A Review on Flame Height and Structure and Pollutants Formation. Neuro Quantology 2022, 20, 2946–2968.
  22. Tanoue, K.; Ogura, Y.; Takayanagi, M.; Nishimura, T. Measurement of Temperature Distribution for the Flickering Phenomenon around the Premixed Flame by Using Laser Speckle Method. J. Vis. 2010, 13, 183–185.
  23. Dreyer, J.A.H.; Slavchov, R.I.; Rees, E.J.; Akroyd, J.; Salamanca, M.; Mosbach, S.; Kraft, M. Improved Methodology for Performing the Inverse Abel Transform of Flame Images for Color Ratio Pyrometry. Appl. Opt. 2019, 58, 2662.
  24. Rosa-Miranda, E.D.L.; Berriel-Valdos, L.R.; Gonzalez-Ramirez, E.; Alaniz-Lumbreras, D.; Saucedo-Anaya, T.; De La Rosa-Vargas, J.I.; Villa-Hernandez, J.J.; Torres-Arguelles, V.; Castano, V.M. An Alternative Approach to the Tomographic Reconstruction of Smooth Refractive Index Distributions. J. Eur. Opt. Soc.-Rapid Publ. 2013, 8, 13036.
  25. Fomin, N.A. Speckle Photography for Fluid Mechanics Measurements; Springer: Berlin/Heidelberg, Germany, 1998.
More
Video Production Service