Your browser does not fully support modern features. Please upgrade for a smoother experience.
Please note this is a comparison between Version 1 by Gonçalo Oliveira and Version 2 by Lindsay Dong.
Clinical models are simple algorithms, developed by the medical community, that predict the functional outcome usually from no more than ten variables using simple arithmetic, as they are meant to be computed by humans.
- deep learning
- ischemic stroke
- modified Rankin Scale (mRS)
1. Introduction
According to the World Stroke Organization, each year, there are over 7.6 million new ischemic strokes, which corresponds to more than 62% of all strokes. Of these annual ischemic strokes, 3.3 million result in death. Additionally, ischemic stroke patients collectively lose more than 63 million healthy years, due to stroke related death and disabilities, each year [1].
Naturally, both the patient and family want to have early information regarding stroke prognosis. Accurate early prediction of post-stroke disability is crucial to both the patient and family to inform actions that should be taken to adapt to a new reality. Additionally, the administration of the thrombolytic drug usually given to these patients can only be done in a limited time frame, and is not risk free [2]. Therefore, in a future where a post-stroke functional outcome predictor is available, these risk factors could be better considered by physicians, which might also allow the use of personalized treatments [3].
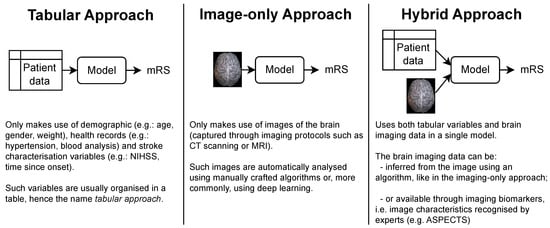
The patient’s functional outcome is commonly considered three months after onset and measured by the modified Rankin Scale (mRS), which is an integer scale that goes from zero to six, where zero corresponds to full independence and six corresponds to death [4][5][4,5]. Several models have been proposed by the medical and machine learning (ML) communities to predict this variable. As shown in Figure 1, each approach gets its name from the type of data ingested:
-
Tabular approach: only demographic, health records and stroke characterization variables;
-
Image-only approach: only brain imaging data;
-
Hybrid approach: both tabular variables and brain imaging data.

Figure 1. The three main approaches for predicting the mRS. Notably, each approach is characterized only by the type of data it uses. In particular, no assumption is made on how these data are given to the model or how it is processed. This means that the brain imaging data can be the raw brain scans or a series of variables that describe it (for example, image biomarkers).
In terms of the complexity of the models that have been proposed for each approach, the tabular models are by far the simplest. Since their only input is a series of patient variables, they do not require an analysis of the brain scans, which either requires the attention of human experts or the use of sophisticated imaging algorithms, usually involving deep learning.
While simple, the tabular models do not have access to imaging data available in brain scans, such as head CTs. Such scans are collected as part of standard patient care [6], and are known to have relevant information for the prediction of patients’ functional outcome, despite the fact that early admission brain CT scans of ischemic stroke patients only exhibit subtle visual changes [7]. For example, lower ASPECT scores (a score used to systematize the evaluation of the brain damage seen in NCCTs [8]) are correlated with poorer outcomes. Also, the presence and location of vessel occlusions, as well as infarct size, can be estimated from CTA scans and both these variables are correlated with the mRS [7][9][7,9]. These findings support the use of the image-only and hybrid approaches (if the brain image scans did not contain predictive information, there would be no point in incorporating them in the models). However, image-only models often underperform relative to the other approaches, and the hybrid models are usually only marginally better than their tabular counterparts.
