Your browser does not fully support modern features. Please upgrade for a smoother experience.
Please note this is a comparison between Version 1 by KATERINA NIKIFORAKI and Version 2 by Peter Tang.
Magnetic Resonance Imaging (MRI) is the modality of choice for a vast range of pathologies but also a sensitive probe into human physiology and tissue function. For this reason, several methodologies have been developed and continuously evolve in order to non-invasively monitor underlying phenomena in human adipose tissue that were difficult to assess in the past through visual inspection of standard imaging modalities.
- MRI
- MRS
- adipose tissue
- relaxometry
- fat fraction
- NAFLD
- NASH
- steatosis
1. Introduction
Magnetic Resonance Imaging (MRI) is the modality of choice for soft tissue imaging in a very wide range of pathological entities, exhibiting a number of advantages over other imaging methods, such as the lack of ionizing radiation, the ability of the user to acquire images at any plane based on anatomy and scanners being readily available and at reasonable cost. Moreover, MRI can deploy contrast mechanisms providing information from different scales of structure, beginning from the molecular and reaching to the macroscopic level, at a single acquisition session. Apart from pure image contrast perceived as variations in signal intensity, contemporarily used MR methodologies decipher the derived information into robust and repeatable biomarkers correlated with different aspects of pathology or physiology status, aiding thus diagnosis, disease classification, and selection of optimal strategy for patient management related to therapy response or planning. In recent decades, the prevailing notion of functionality restricted to storing energy and passively acting as a natural insulator has been thoroughly reconsidered. Modern physiologists now identify the significance of adipose tissue not inferior to that of an endocrine organ, participating and regulating metabolic processes. This fact totally reshapes the role of MRI in clinical imaging as conventional techniques have to be revised to meet the current needs and emerging techniques have to be made adequately sensitive to provide insight at multiples levels of granularity regarding the role of adipose tissue.
2. Lipid and Water Molecules in a Magnetic Field
MRI signals originate mostly from protons (unpaired spins) in the fat and water molecules and, more specifically, from hydrogen nuclei in water molecules or fatty acid chains composing adipose tissue. These are the main signal sources in MR imaging and, luckily, they are very abundant in the human body. However, the nature of water and fat molecule is responsible for the very distinct behavior of each one, which in turn is the basis for the ability to selectively image, amplify or suppress the signal of one of the two and importantly quantify, depending on the clinical need for a certain referral to the scanner suite. The structure and function of adipose tissue varies by location, including subcutaneous white and brown fat, visceral fat, bone marrow fat, and fat within organs or muscle. Fat, as opposed to water, is a slowly moving large molecule. It exists in tissues primarily as long chain of triglycerides, and most of their hydrogen atoms are nestled in aliphatic side chains among relatively electroneutral carbon atoms. Water, on the other hand, is a small molecule with two hydrogen and one oxygen atom. It is the main constituent of human body, making up almost 80% of the muscle tissue, more than 70% of the brain, and even more than 30% of the bones. The difference of the two molecules in size and ability to move, as well as the type of chemical bonds within the molecules, affect their behavior during the MR acquisition process. Water is a rapidly rotating molecule, with a polar character due to its electronegative oxygen atom. Hydrogen atoms are bond to the water molecule by strongly polar bonds, and this polar nature of the atom imposes a certain symmetry rendering the H nuclei equivalent with respect to their environment. The strongly electronegative oxygen atom of a water molecule pulls away the protective electron clouds covering the hydrogen nuclei. This deshielding effect exposes the hydrogen protons to a relatively stronger local magnetic field than they would otherwise experience. Hence, they resonate slightly faster than the more shielded protons in triglyceride molecules. This difference in resonance frequencies between water and fat is named chemical shift, and is the physical principle behind many MR methodologies separating fat from water signal based on their resonance frequency. These differences are more prominent among different molecules, but subtle changes exist within the fat molecule itself among hydrogen atoms, constituting a more complex spectrum for fat, which is composed of a number of different resonance frequencies with known shifts among them in the fat spectrum. They arise from the local differences caused by the variable shielding degree of each hydrogen in its very local chemical environment in the vicinity of the chemical bond. The resulting spectrum from all H nuclei present in the human body comprises a single resonance frequency for the water molecule and a number of different resonance frequencies from adipose tissue, with amplitudes relative to their concentration. This spectrum is the human fingerprint in each elementary volume in the glossary that an MRI scanner comprehends.3. MRI Methodologies
The two main parts of every MRI process is the initial excitation with the RF pulses and the progression of a relaxation to the initial state immediately after, where the signal from the two pools is recorded. While relaxing, H nuclei protons emit energy, which is then received as electrical signal by coils placed adjacent to the body area of interest. The contributions from the fat and water depots can be distinguished both spatially, from which part of the body they come from in order to be placed to the corresponding part of the body, but also chemically, i.e., to identify its origin, either from fat or water. MR contrast stems from finely adjusting acquisition parameters to preferentially amplify the contrast indicative of the physical phenomenon of interest over a number of other physical phenomena that evolve concurrently and also affect the resulting signal. The main characteristics differentiating fat and water signal can be summarized in:-
The fat molecule, being large and ponderous, is the first to lose the energy deposited by RF pulses by interacting with its environment and returns faster than the water molecule to its initial state. This fact is measurably registered in two biomarkers called T1 or T2 relaxation constant capturing the rate at which each tissue type returns to its initial equilibrium status, before the RF pulse. Once the total amount of energy is expended to interactions with the environment, the nuclei are invisible to the receiver coils and thus the imaging process.
-
As mentioned before, the MR signal comes from the single water and the multiple fat resonance peaks. Water and fat are identified by the scanner via their known position(s) in the spectrum. For a number of applications, it suffices to assume that the fat spectrum comprises only the dominant one, while for other applications the relative amplitudes of the fat spectrum peaks are the main outcomes of the imaging session.
4. Brown Adipose Tissue in MRI
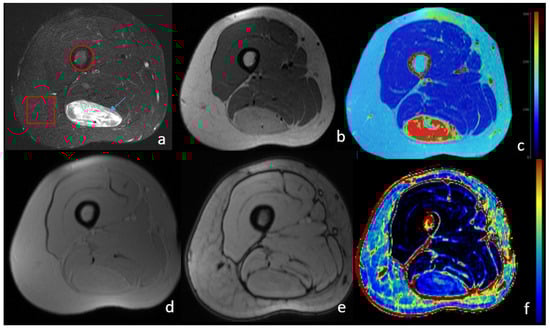
Brown adipose tissue (BAT) is thermogenic tissue with reported beneficial effect in cardiometabolic health and weight management [1][26]. BAT exhibits different structure and functionality from white adipose tissue [2][27]. Several of those differences can become the basis of MRI contrast, and can be highlighted by appropriately tailored MRI protocols to detect BAT, which in adulthood is scarce in a small number of body regions. Such BAT attributes are mainly the presence of numerous mitochondria, the co-existence of a water component, and the presence of multilocular lipid droplets instead of a central unilocular one in white adipocytes [3][28]. The iron rich mitochondria are responsible for the brown color of these adipocytes. Concerning MRI, the paramagnetic nature of iron disturbs the local magnetic field and accelerates the process of T2 relaxation. T2 sequences adjusted by the correct choice of sequences to be more sensitive to such disturbances are named T2*. Both T2* weighted images and T2* relaxometry can reveal possible BAT depots if present, independently if they are activated or not during imaging. Moreover, BAT composition includes a large fraction of water which can be detected in tissue spectrum, as well as in relaxometry studies with multiple compartments [4][29], as previously discussed. Other microstructural differences between white and brown adipocytes that translate into specific MR contrast is the ability of the water molecules to move freely in the intracellular space, diffusion weighted sequences (DWI). The DWI contrast principle relies on signal reduction in the occurrence of restricted water motion, achieved by the addition of two extra RF pulses that accelerate the dephasing of stationary or slowly moving spins to a degree defined by the user. The signal reduction is directly proportional to nuclei ability to diffuse, both in terms of velocity and range, and this is quantified in the DWI derived biomarker named apparent diffusion coefficient (ADC). The inner mitochondrial membrane is a physical barrier for the water to move, and this restricted water motion is reflected in the ADC measurement as a significantly lower value for BAT depots compared to white adipocyte regions. This quantitative measurement is another example of MRI providing microscopic level information. It has to be noted that the imaging of brown fat is not very frequent with MRI, since functional techniques such as PET [5][30] have the advantage of revealing metabolic information which is the key functional attribute of those adipocytes. Obesity and metabolic disorders: Because of the potential activation of BAT through non-shivering thermogenesis, it has been deployed for addressing obesity and related comorbidities. Exposure to cold in combination with dietary intervention can initiate a process called “beiging” [6][31] of white adipocytes, and suggests the metabolic activation from inert to metabolically active, i.e., acquiring the functional characteristics of BAT [7][8][9][32,33,34]. Identifying the presence of brown or activated (beige) adipocytes is an active field of research for addressing obesity and metabolic disorders [10][11][35,36], but can also be deployed in health, in the frame of promoting healthier lifestyles through subtle lifestyle interventions [12][13][37,38]. Lipomatous tumors: One special case of lipomatous tumors are hibernomas, which are benign masses with high brown fat concentration. As such, they can be differentiated from other masses based on the characteristic phenotypes of brown fat imaging [14][39]. Figure 1 presents the imaging phenotype of lower limb hibernoma, exhibiting different characteristics from subcutaneous or bone marrow fat. The presence of water is evident from the high signal in T2 images, as well as for the persistence of high signals even after fat suppression. Moreover, calculated T2 values are higher and the fat fraction is significantly lower in the whole area of the mass. The software used for T2 calculation is an in-house built software platform [15][40], while the fat fraction map was calculated by Evorad 2.1 software Tesla QMRI Utilities-X implemented on the Evorad® (iKnowHow, Athens, Greece) research PACS client platform.Figure 1. MRI image of lower limb with a brown fat lipoma (hibernoma). Histopathologic examination showed 90% of brown fat composition. The arrow shows the hibernoma mass, while the circle and square denote the bone marrow area subcutaneous fat depot, respectively. (a) T1-weighted with fat suppression; (b) T2- weighted; (c) T2 relaxometry parametric map calculated from multi echo T2 images. Brown fat lipoma exhibits high T2 relaxation rates due to the water component of the brown fat composition; (d) T1 in-phase; (e) T1 out-of-phase; (f) fat fraction map calculated from in- and out-of-phase images. Muscle shows minimal fat fraction, while a higher degree is observed for the bone marrow. Hibernoma exhibits smaller fat fraction, which is in accordance to the histopathologic examination showing BAT dominance over white adipocytes. Subcutaneous fat appears with lower fat fraction than the bone marrow as the technique is unable to quantify percentages of more than 50% fat dominance.