The detection of photovoltaic panels from images is an important field, as it leverages the possibility of forecasting and planning green energy production by assessing the level of energy autonomy for communities. This entry proposvides an automatic summary of approach that canes proposed in the literature for detecting photovoltaic panels conforming to a properly formed significant range of colours extracted according to the given conditions of light exposure in the analysed images. The significant range of colours was automatically formed from an annotated dataset of images, and consisted of the most frequent panel colours differing from the colours of surrounding parts. Such colours were then used to detect panels in other images by from remote sensing imagery. These methodologies encompass machine learning, deep learning, spectral information analysing panels, and colours and reckoning the pixel density and comparable levels of light analysis.
- green energy
- environment analysis
- object detection
1. Introduction
2. Detecting Photovoltaic Panels in Aerial Images
2. Proposed Approach
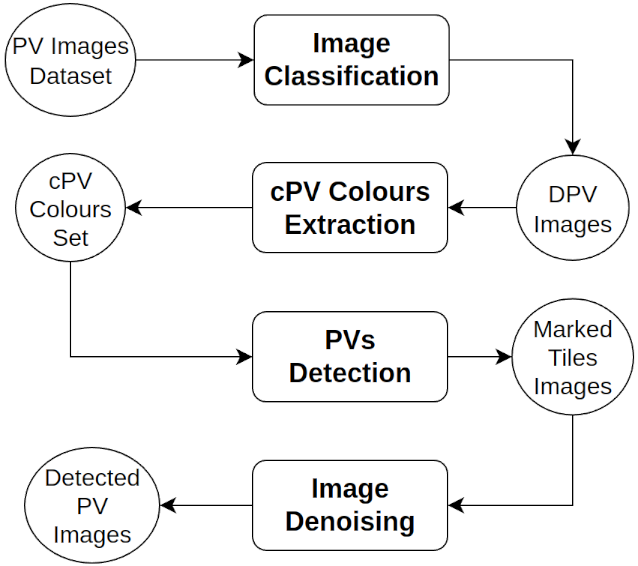
TheA main stratdegy of the proposed approach is to scan the colours of a small number of annotated aerial images and extract from them a set of characterising PV panel (cPV) colours. Then, these selected colours are used as a reference to detect the locationep neural network model called Faster-RCNN was used to design the identification model of PV arrays in other (unannotated) aerial imagespanels [12]. The approach reconsembles and extends the methodology presented in[9][10]isted of two parts: first, a where colour analysis and mobile tile-based detection were employed to automatically determine the green and urban areas in an image and trace the boundaries between them.The ResNet-50 classifier was pretrained, then a CNN was fine-tuned figuore below shows the high-level view of the four main phases of the proposed approach, consisting of: (i) classification, used to identify images featuring Detectable PV (DPV) the identification task of rooftop PV panels, i.e., those exhibiting colours different enough from the colours of roofs, roads, ground, etc.; (ii) extraction of cPV colours from DPV images; (iii) detection of PVs in unannotated images using a sliding window that marks tiles on the panels’ surface; and (iv) denoising to filter the previous results.
2.1 Classification
The . Similarly, three convolutional layers and three fully connected layers were used to evaluate the performance of the identimage classification phase[8]. cMomprises three steps: (i) label assessment; (ii) pixel colour extraction and filtering; and (iii) colour analysis and classification.The label assessment step aimed to reveal the accuracy of the pre-existing reover, eight 2D convolutional layers were used to detect PV panel annotations in the initial datases in residential areas; t[11],o as tche detection results could be misleading if the annotations are not accurate. For this reason, inaccurate labelieve the best performance, thirteen architectures were identifitrained and the corresponding images were manually removed. In genermost accural, labels in the dataset encompass a region that includes PV panels alonge was selected [9]. wiOth a significant portion of the surrounding area, such as terrain, vegetation, shadows, and so on. As a consequence, dataset labels cannot be reliably employed to guide the extraction of PV colours. For this reason, a strategy was devised to analyse the colours within the area enclosed by labels and automatically exclude the subset of colours that are also commonly encountered outside the annotated areaer approaches have used InceptionV3, a CNN used for image analysis and object detection, which was fine-tuned for the task of PV panel identification [10,11]. The strategy operates as follows. Initially, dataset labels are use approaches were designed to partition each image into two regions: the Label Region (LR) and its complement, referred to as the Background Region (BR). Subsequently, the RGB colour components of the pixels are collected and the colour count for each region is computed, indicatidetect PV panels in both residential and non-residential areas; however, due to the lack of PV panel images, data augmentation was performed during the total number of pixels displaying every colour in each of the two regions. This information is aggregated from all images in the dataset and usedraining process. The framework proposed in [10] to build two sets: LR colours and BR colours (see figure below). Then, for each colour within the intersas employed for the detection of the two sets, a comparison is performed between the corresponding counts. If the ratio between the BR count and the LR count exceeds PV panels in Sweden to collect further market statistics [24]. Simila threshold, that colour is characterised as a background colour and is removed from the LR set. The outcome of this filtering operation is a subset denoted as PV Panel (PVP) colours.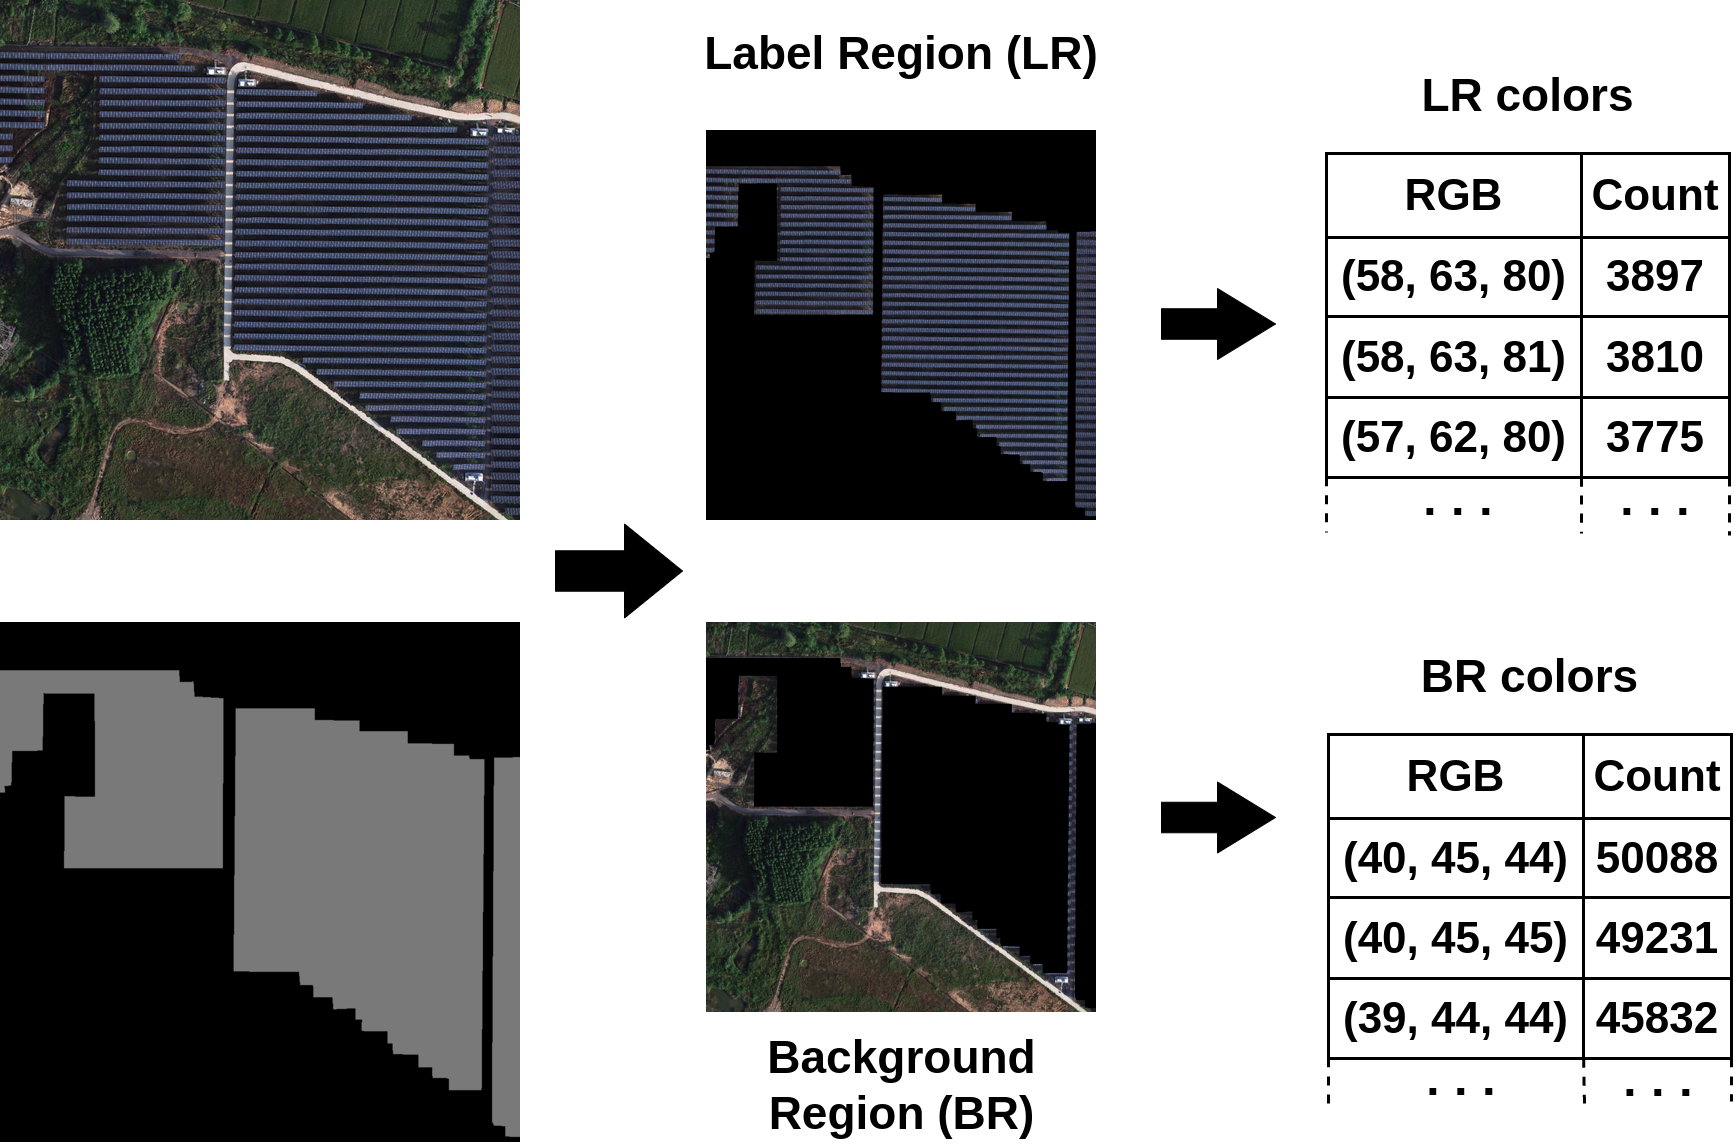 The aly, an innovative approach was presented to detect rooftop PV panels onalysis of the PVP colour sets collected from several images revealed significant colour variationthe three-dimensional (3D) orientation [25]. This, possibly due to differences in illumination conditions and/or PV panel materials. Three classes of PV panels have been identified, based on the properties of their prominent colours: (i) dark panels, which are typically found in images captured in low-light conditions; (ii) grey–white panels, whose shades can result from theapproach employed the InceptionV3 model to classify images; subsequently, segmentation and geocoding steps were performed to analyse the 3D images. ML and deep learning techniques were used for rooftops PV panel material or from sunlight reflecting offs detection in [13]. tThe panel surface; (iii) detectable panels (DPV), that includes all k-means approach was applied to segment the images that do not fall into the previous two classes. A strategy was developed to automate thein order to define the contours of each rooftop, then a support vector machine (SVM) classification of the dataset’s images into such three classes. The strategy is as follows: for each image, the LR colour set is selected and its intersection wither with a CNN was integrated to accurately identify solar PV arrays. A Mask-RCNN was used for segmentation and identification in [14,16,17]. tThe PVP colour set is determined, resulting in the image-specific PVP colour set (iPVP). The iPVP set comprises all PVP colours found within that particularese approaches applied the object detection technique to reveal PV panels on aerial image alongs, with their respective counts.
TCNN being fine-tuned to chassess the amount of dark pixels, RGB coordinates of the iPVP colours are converted into the HSL (Hue, Saturation, Lightness) colour space. Next, the lightness component is evaluated; if aracterise the mask contours used for the arrays. A CNN with the VGG16 encoder was presented in [15]; coloufir falls below a threshold, it is designated as dark. If the aggregated count of dark colours surpasses a predetermined fraction of the total iPVP set counts, then the image is classified as dark.
Tost, image segmentation was performed to select the suitable portions of solar panevaluatels, then the amount of pixels displaying white or grey shades, the fact that such colours can be described as having low saturation is leveraged. Consequently, colours in the iPVP set are trzimuth of the solar arrays was predicted using edge detection and the Hough transforme.
2.2 Characterising PV (cPV) Colours Extraction
The goal of r to identhis phase is to extract colours from DPV images and isolate the characfy pixels related to PV arrays. In a similar approach [19], therising PV (cPV) colours. Similar to focus was on the image classdentification phase, each DPV image is partitioned into a Label Region (LR) and its complementary Background Region (BR). Then colours are aggregated and their respective counts for all images, which are recorded separately for each region, resulting in sets for the LR colours and BR colours. Next, background colours are removed by evaluating the ratio between the BR count and LR count for all colours within the intersection of the two sets. As a result of these operations, the PVP colour set is obtainedof water PV systems (WPV); an RF classifier with 400 trees was trained to extract pixels related to WPV, then postprocessing was performed to remove noise and rooftop PV panels.A furnother filtering process is applied to the PVP colour set with the objective of excluding both dark and low saturation colours. The reason is that, as illustrated earlier, these colours are not representative ofpixel-based RF algorithm used the L-8 surface reflectance (SR) product to identify suitable PV panels [20]. Again,The this assessment uses thresholds for the lightness component in the HSL colour space and the saturation component in the HSV colour space.
2.3 PVs Detection
IRF classifier was based on the Google Earth Engine (GEE) and used to map PV power planitially, PV images are analysed and all pixels with a colour contained in the cPV set are identified and marked. Then the detection of PV panels in the images is further refined by evaluating the colours within the area of a moving square window. Depending on the features of PV installations,s. Similarly, an RF classifier for an Object-Based Image Analysis (OBIA) approach used different combinations of multiple passes with progressively larger windows can greatly enhance the effectiveness of PV detection. A different marking colour isspectral Sentinel-2 imagery and radar backscatter from Sentinel-1 SAR imagery [26]. used iIn each[21], refinementRF run because each successive run assesses the marked colours within an increasingly larger area. If a window in a subsequent refinement iteration contains marked pixels but their cumulative count is not sufficient to trigger the threshold, this indicates that a significant number of pixels within the window do not feature cPV colours. Consequently, it is very likely that the previously marked pixels actually correspond to incorrect detections. In this case, the window is not coloured. An example of detection results is shown in the figure below.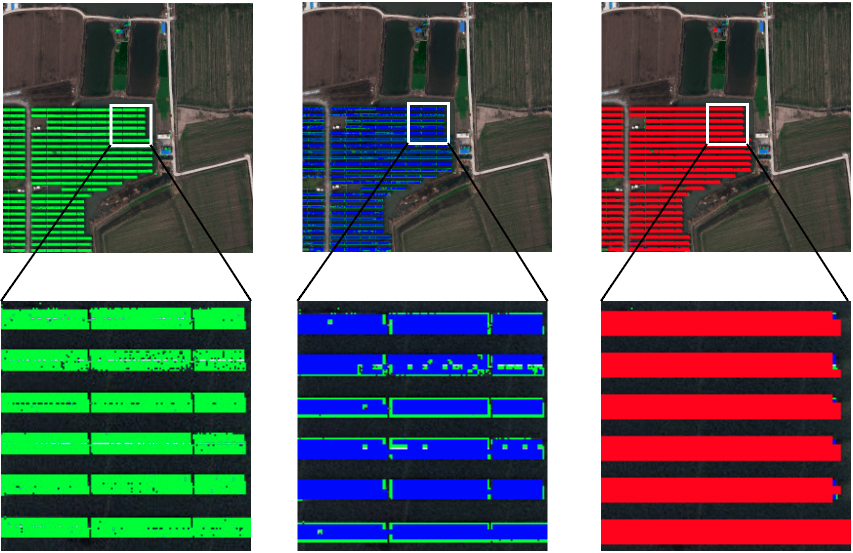
2.4 Image Denoising
Pixclassification was combined with a CNN. First, the RF was used to assign a confidence value to each pixel in order to determine the possibility of that pixel belonging to a solar PV array; then, a CNN was used to classify 40×40 patches of RGB images to determine whether or not they corresponded to solar PV panels. An innovative deelsp displaying cPV colours might be found in background regions, although less frequently than for actual learning technique called EfficientNet-B7 was employed for PV panels. Occasionally, the count of such pixels is sufficient to trigger the moving window detection in [27], threshold, leading to incorrect detections. To address noise, i.e., occurrences of cPV pixels outside of actual panels, it is observed that panel surfaces typically contain large clusters of marked tiles. Conversely, incorrect detections in the surroundings often result in isolated coloured pixels or short coloured stripewing better accuracy and efficiency compared to classic CNN approaches. EfficientNet-B7 was used as a backbone encoder to train a U-Net model for segmenting solar panels. L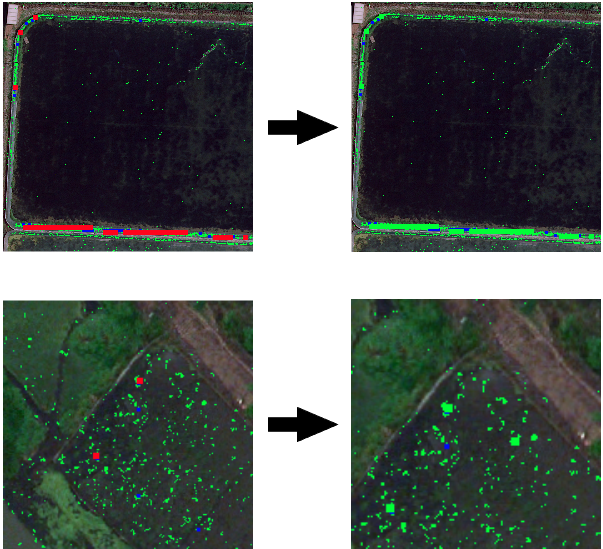
3. Conclusions
Thiscusing on the physical absorption and resflearch presents an approach that accurately detects the parts of images showing photovoltaic panels. First, the proposed approach automatically classifies images according to the brightness and saturation of their colours and selects those images having appropriate brightness and saturation levels. This step is automatic and does not require annotatction characteristics of PV panels. To handle the material diversity of PV panel types, these studies applied a tailored images. Second, the colours characterising photovoltaic panels are gathered by comparing panel colours to the colours of the background/surroundings. This step uses a small number of annotated images to discover the panel colours. Third, spectral library, which together with the hydrocarbon index mitigated the spectral variance caused by the detection of photovoltaic panels isangle.Ts o validate the effectiveness of the approach, experiments were performed using an open-source dataset of aerial images containing photovoltaic pa the pixels forming the panels. The results showed that the proposed appe approach can accurately and consistently identifydetect photovoltaic panels, achieving high precision and recall values. Notably, unlike many CNN methods, the approach is capable of identifying both the areas and the actual precise surfaces of PV panels, offering a dual identification capability.
T conforming to a properly formed significant range of colours extracted according to thanks to the initial classification phase used in the proposed approach, datasets for different regions can bgiven conditions of light exposure in the analysed successfully, e.g., images that have been captured at different times of the day with a specific light can be detected and separated from others, then a subset. The significant range of colours is automatically formed from an annotated dataset of images, and consists of the whole set can be automatically identified for PV detection. Moreover, the automatic extraction of distinctive pixelmost frequent panel colours differing from the colours of surrounding parts. Such colours characteristic of PV panel models specific to a given region provides a level of tuning, flexibility, and versatility when applying the approach toare then used to detect panels in other images with widely varying by analysing panel colours of panels and surrounding areas. Finally, the proposed approach exhibits a fast execution time, as no training phase is required, and works well without a dataset of annotated images, as the gathered representative colours can be used for other regions. A more de and reckoning the pixel density and comparable levels of light. The results show that the approach accurately reveals the contours of panels notwithstailend comparison with the state of the art, along with a description of the experiments conducteding their shape or the colours of surrounding objects and their results, can be found in the related paper environment.