Your browser does not fully support modern features. Please upgrade for a smoother experience.
Please note this is a comparison between Version 1 by Murodbek Safaraliev and Version 3 by Fanny Huang.
Nontechnical losses of electrical energy (NTLEE) have been a persistent issue in both the Russian and global electric power industries since the end of the 20th century. Every year, these losses result in tens of billions of dollars in damages. Promptly identifying unscrupulous consumers can prevent the onset of NTLEE sources, substantially reduce the amount of NTLEE and economic damages to network grids, and generally improve the economic climate. The contemporary advancements in machine learning and artificial intelligence facilitate the identification of NTLEE sources through anomaly detection in energy consumption data.
- nontechnical losses of electrical energy
- neural networks
- machine learning
1. Introduction
Nontechnical losses of electrical energy (NTLEE) are mainly associated with an underestimation of electric energy (EE) released from the networks of the electric grid organization (EGO). NTLEE lead to a decrease in financial revenues from EE transmission services and to an increase in fees for EE losses, which creates damage to EGO and undermines their economy. Such losses are caused by unaccounted and noncontractual consumption, errors and malfunctions of electric power measurement systems (EPMS), or errors in invoicing.
Nontechnical losses of electrical energy (NTLEE) refers to the difference between the input and output values of electrical energy on a section of the electrical network, minus the technical losses of EE caused by the conversion of EE into thermal energy, mechanical energy (like vibrations, noise), and other forms of natural dispersion. NTLEE are primarily associated with the supply of electric energy released from the networks of an electrical grid organization. NTLEE lead to a decrease in financial revenues from services for the transfer of EE and an increase in fees for EE losses, which damages energy supply organizations and undermines their economy.
Identifying NTLEE and sourcing them is a classic task in both the Russian and global electric power industry, retaining its relevance since the end of the 20th century. The annual damage resulting from NTLEE is estimated at tens of billions of dollars globally [1] and billions of rubles in the Russian Federation [2].
In the Russian Federation, NTLEE, in terms of the volume supplied to the distribution network, varies from 0.06% [3] to over 25% [4], depending on the region and the electric grid organization. In countries undergoing difficult socioeconomic and sociopolitical circumstances, relative nontechnical losses can constitute a large percentage of the electricity distributed, reaching up to 60% in Libya and 22% in Iraq [5]. These losses stem from widespread unauthorized EE consumption, either bypassing existing accounting tools or in their complete absence. Meanwhile, even in countries with robust accounting for energy resources and socioeconomic stability like China, Japan, or Germany, the relative values of NTLEE have only decreased to a range of 4.0–5.5% [6]. These figures cannot solely be attributed to the approximated 1.0% error margin of modern EE accounting tools. Main culprits include sudden and hidden failures of EE metering devices and systems, transmission and reception failures over unreliable communication channels, and fraudulent consumption by unscrupulous entities [6][7][8][6,7,8].
Timely identification and mitigation of these issues halt the systematic emergence of NTLEE sources, preventing their persistence and substantially reducing NTLEE values. This positively influences the cost of electrical energy in power systems and the overarching economic climate. Historical analysis reveals that the initial installation of EE meters could exponentially reduce NTLEE by 1.9–2.6 times over 10–15 years [9], equating to a reduction from 18–24% to 8–11% in developing countries, and from 10–12% to 4–5% in developed nations [1][2][1,2]. Nonetheless, the decline in NTLEE has plateaued; stricter accuracy requirements and the broad implementation of auxiliary EE accounting tools have not materialized, leading to undesirable capital inflows into the network. This proves unprofitable for energy supply firms, imposing an extra financial burden on EE consumers. Therefore, there is a pressing need for fundamentally diverse approaches to NTLEE identification, involving computational and analytical methodologies.
Modern advancements in the fields of mathematics, informatics, cybernetics, along with machine learning and artificial intelligence methodologies, facilitate the identification of NTLEE sources through the detection of anomalies in EE consumption data [6]. These developments contributed to the resurgence in the popularity of information methods for pinpointing NTLEE between 2020 and 2023, building on simple rules of thumb previously used in practice. Since 2021, the Russian Federation has employed software platforms and complexes leveraging machine learning techniques to detect NTLEE [10][11][10,11]. Similar trends are evident in other nations [12]. Nonetheless, these IT solutions, while nonspecialized and primarily devised to engage with a user audience and undertake socio–geo analytics, do not account for the attributes requisite for addressing the technical and technological aspects of EE accounting. Thus, this work aims to compare the foundational mathematical methods used in NTLEE analysis and to assess their operational settings.
In the existing classification, computational and analytical methods for identifying NTLEE are divided into two principal categories [8].
Schematic approaches hinge on controlling EE balances and calculating technical losses through electrical ratios. These require details on the electrical network topology and replacement circuit parameters. While these methods boast high sensitivity and the capacity to pinpoint systematic NTLEE, they necessitate complete and reliable source data. Proving effective in networks exceeding 35 kV, where network replacement scheme parameters are well defined and the electrical network possesses limited connectivity and branching, they allow for dual EE accounting and mitigate the likelihood of unauthorized connections. However, implementing these methods broadly in 6–10 kV networks, and especially in 0.4 kV networks, poses challenges due to extensive network lengths and branching, the prevalence of diverse accounting tools, and significant errors in the parameters of such networks’ replacement schemes.
In turn, information methods are methods based on the identification of patterns and anomalies in the power consumption of the final consumer of EE. The advantages of these methods include the fact that they do not require information about network parameters and can be used in the absence of a balance counter. The data source and the basis for the analysis are consumption data. This information is easier to obtain than network characteristics or measurements of operating parameters. The disadvantages of such methods are the need for a large sample of initial data and an unobvious choice of empirical patterns that ensure the identification of NTLEE. Nevertheless, modern EE accounting tools allow for the collection of synchronized high-precision measurements of EE consumption at half-hour intervals, storing this information, as well as measuring of electrical mode parameters. The integration of such systems benefits from the support of the government and network companies, as it is being implemented today in the Russian Federation according to the Government Decree of 19 June 2020. N 890 changes the approach to the identification of NTLEE. In these conditions, the volume of available data ceases to be an obstacle to the application of the information approach, and the methods of machine learning and artificial intelligence allow for automating the assessment of the power consumption profile. Such methods make it possible to identify complex and nontrivial patterns in the change in users’ power consumption, detecting periods of time of the probable existence of the NTLEE. Empirical information methods, in fact, are often hybrid, combining information and schematic methods. Information methods have the potential for application in 6–10 kV networks and especially 0.4 kV.
Before proceeding to the description and analysis of methods for identifying NTLEE, it is necessary to describe the methodology of bibliography search. AFor the review, a search was carried out for articles by leading publishers, primarily devoted to information methods for the period from 2013 to 2023. The second direction of the search was the work considering the correlation between socioeconomic factors and the amount of theft of electricity.
2. Methods of Identification and Assessment of Nontechnical Losses of Electrical Energy
The primary classification of the methods has been delineated in [8]; this is consistent with several other classifications, albeit with minor variations, found in [13][14][15,16]. This schema is employed to pinpoint locations of electrical energy theft by leveraging an extensive knowledge base to analyze a substantial amount of data. Predominantly, this analysis involves approaches such as machine learning, anomaly/outlier detection, distribution network analysis, and cybersecurity.
As it is underlined in the introduction, nontechnical losses of electrical energy detection methods can broadly be categorized into two groups: methods concentrating on consumer data (informational methods) and ones centered on network topology and technical data (schematic methods). In addition, there are hybrid methods that combine the two philosophies mentioned. A distinguishing factor among these methods is their reliance on data pertaining to the power supply system—encompassing elements like network topology and data measurements at the input and/or branching points of supply substations. It is important to emphasize that the efficacy of these methods is significantly tethered to the precision of electrical energy metering devices. Consequently, minimizing both instrumental and methodological errors is pivotal in enhancing the accuracy of results in identifying sites of electrical energy theft [15][16][17,18].
Methods focusing on consumer electrical energy data can be further divided into subcategories: observable and unobservable. Observable methods employ classifications that categorize consumers into two groups. The first group encompasses those involved in the theft of electrical energy, identified using algorithms, as dishonest. The second group consists of honest electrical energy consumers who were not flagged by the algorithm. Methods that bypass this binary classification of users are termed unobservable. Another approach utilizes a classification with only one type of consumer; however, it is seldom adopted in contemporary publications and is thus not discussed further.
Methods utilizing network information typically disregard consumer classification, concentrating instead on the analysis of the supply network’s topology and the physical principles underlying its operation [17][18][19][20][19,20,21,22]. These strategies can be categorized based on their foundational methods: state assessment-based methods, flow distribution assessment-based methods, and approaches founded on sensor networks [14][21][16,23]. Hybrid methods aim to integrate both consumer and network data [22][24]. The focus of this study narrows down to methods engaged with consumer data. While network information may be referred to in the publications under review, it serves only as supplementary data.
Currently, the prevalent methods for identifying sites of electrical energy theft include ensembles of fuzzy logic methods, regression and correlation analyses, multilayer neural networks, empirical methods, decision trees, support vector methods, convolutional neural networks, and hybrid models rooted in them, as well as autoencoders and their related hybrid models utilizing various types of boosters. A concise explanation of each mentioned method follows:
Fuzzy logic methods are grounded in classical mathematical logic, wherein a mathematical expression can denote sets involving conjunctions, disjunctions, and negations. Unlike the discrete “true” or “false” values, it utilizes a “degree of truth” that can assume any value between zero and one, with the extreme values representing truth and falsehood, respectively. Instances of employing this nuanced logic are illustrated in [23][24][25,26].
Regression and correlation methods involve the analysis of a large amount of information to identify existing patterns. Based on the revealed dependencies on the input data, the behavior of the model is predicted. Regressions were used in [25][26][27][28][29][27,28,29,30,31]; correlation analysis was used in [30][31][32][33][34][35][36][37][32,33,34,35,36,37,38,39].
Multilayer neural networks, distinct from single-layer variants, incorporate additional hidden layers, thereby enhancing their accuracy. It is not necessary for the number of hidden layers to be large—even with just one, the model’s efficiency is elevated. Thanks to these hidden layers, input signals undergo preliminary processing before reaching the adder. Studies employing this type of neural networks can be found in [23][25][38][39][40][41][42][43][44][45][46][25,27,40,41,42,43,44,45,46,47,48].
Empirical methods are predicated on identifying verifiable instances of embezzlement through patterns observed in real-world scenarios. Consider a situation in a network with a distributed load: if a specific electricity user’s meter readings decrease, yet no similar decline is registered on the state metering device placed on the outgoing connection or at the entrance of a 10/0.4 kV transformer substation, one can infer that the user has tampered with their metering apparatus. A substantial set of such rules has been put forward in research, with several elaborated in [32][47][48][49][50][51][52][53][54][55][56][57][58][59][60][61][62][63][34,49,50,51,52,53,54,55,56,57,58,59,60,61,62,63,64,65].
Decision trees are methods of automatic analysis of large data arrays. A decision tree is based on a hierarchical tree structure, which uses the rule “If … then …”. The data are split when one of two conditions is met: either it is no longer possible to create a new rule “If … then …”, or when the allowable number of rules is reached. Examples of using decision trees can be seen in [25][38][64][27,40,66].
A support vector machine is a linear algorithm that is used in classification and regression tasks. The idea of the method is to divide objects into several classes by a single line or hyperplane. The points on the graph that are closest to the separation line (hyperplane) are used as reference vectors. Support vectors were used in [25][65][66][67][68][69][70][27,67,68,69,70,71,72].
Convolutional neural networks (CNNs) feature a distinctive architecture among artificial neural networks, characterized by the presence of a convolution operation. This operation involves utilizing a confined matrix of weights, initially termed the “convolution core”, which progressively traverses the entire layer it processes. Weight coefficients emerge solely during the learning phase, culminating in the generation of a neuron activation signal destined for the subsequent layer of the network. Eventually, the neuron outputs’ products are aggregated according to their respective weights, delineating the conclusive output, a process documented in [68][71][72][73][74][75][76][77][78][79][80][81][82][83][84][85][86][87][88][70,73,74,75,76,77,78,79,80,81,82,83,84,85,86,87,88,89,90].
Developed originally to facilitate machine vision, CNNs now excel in discerning various images through the identification of local features within them. To pinpoint occurrences of electricity theft, one can employ one-dimensional or two-dimensional CNNs, or a combination of both.
One-dimensional convolutional neural networks are utilized when the resolution of the output data is limited. A specific instance is the daily monitoring of electricity consumption over a month, from which an input data vector with a dimensionality ranging between 28 and 31 can be derived from the power consumption graph.
Two-dimensional convolutional neural networks come into play in the scrutiny of highly detailed values, such as semi-hourly or hourly recordings of electric energy use spread over a month and differentiated by day. This approach provides the input data vector (image) a resolution embodying 28 to 31 × 24 values.
The integration of two-dimensional and one-dimensional convolutional networks affords the capacity to individually inspect anomalies and patterns before amalgamating the results for deeper analysis. To facilitate the comparison of diverse data sources, time series differing in intervals, specificity, and consumer sets, separately tailored convolutional networks are devised to operate in parallel. For the evaluation of nontemporal series, the convolutional network might be substituted with a direct distribution network. In this scenario, normalization and neuron elimination procedures are advised to mitigate overfitting. The culmination is reached via a pooling layer tasked with standardizing the errors emanating from each parallel-operating neural network, as well as orchestrating the influence of every individual network on the final classification outcome.
Autoencoders are a type of neural network that reconstructs the information fed into its input. This neural network comprises two primary components: an encoder and a decoder. The encoder receives the input information and transforms it into an internal representation. Subsequently, the decoder takes this internal representation generated by the encoder as the source information and endeavors to reconstruct the original input. Examples of autoencoder applications can be found in [89][90][91][92][93][94][95][96][91,92,93,94,95,96,97,98].
Thus, the use of an autoencoder makes it possible to almost completely separate points in the power consumption profile of various categories of consumers with the possibility of their further quantitative (according to the threshold principle) or qualitative (using clustering) classification.
Until 2020, support vector methods and decision trees employing various nodes were prevalently featured in publications, as seen in [64][94][66,96]. However, post-2020, there has been a noticeable uptick in the active utilization of various types of neural networks in research publications.
As of now, CNNs stand as the most frequently used type of neural network, accounting for nearly a quarter of the publications analyzed. Direct feedforward neural networks and autoencoders find less representation in the current literature, a trend visually represented in Figure 1.
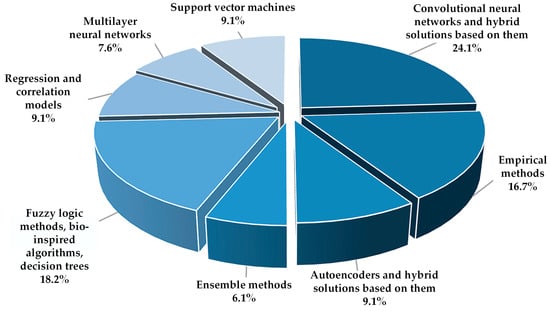
Figure 1.
Dissemination of models and methods for detecting NTLEE.
Currently, there are two fundamental approaches to detecting nontechnical losses due to electrical energy theft, which subsequently influence the configuration of neural networks: identifying NTLEE in a suspicious segment of the profile [71][72][73][79][73,74,75,81], and pinpointing NTLEE tied to a suspicious consumer [24][76][81][84][26,78,83,86].
Searching for dishonest consumers in a dubious section of the profile offers several advantages. It allows for the analysis of a specific consumer’s profile, reducing the frequency of false positives. The approach involves feeding a square matrix and standard convolution settings into the artificial neural network (ANN), demanding relatively low computational power. Moreover, it distinctly identifies the source of nontechnical losses of electrical energy. However, it falls short in detecting already established, continuous energy thefts and unmarked thefts, leaving them unnoticed. Although it specifies the theft source, it fails to pinpoint the exact time of the energy theft occurrence.
On the other hand, the approach focusing on suspicious consumers stands out for its high sensitivity to power consumption anomalies against the broader backdrop. It facilitates the detection of relatively constant energy losses and previously unnoticed thefts, always revealing the time when the NTLEE occurred. Despite these merits, it requires a comparison with neighboring power consumption data, which might not always be available, and struggles to accurately determine the precise source location of the theft.
Since the advantages of one of the approaches can be attributed to the disadvantages of another approach, the logical conclusion is that the greatest efficiency will be achieved only with the joint application of approaches in a modular algorithm.