Your browser does not fully support modern features. Please upgrade for a smoother experience.
Please note this is a comparison between Version 1 by Anne K. Virkki and Version 2 by Lindsay Dong.
Planetary radar observations have provided invaluable information on the solar system through both ground-based and space-based observations. The radar technology is a remote-sensing method for planetary exploration and the methods to interpret the radar data have advanced in the eight decades of increasing use, where the field stands in the early 2020s, and what are the future prospects of the ground-based facilities conducting planetary radar observations and the planned spacecraft missions equipped with radar instruments.
- planetary radar
- synthetic aperture radar
- radar sounding
- radar polarimetry
1. Introduction
Radar observations have been increasingly used for planetary science over the past eight decades. Radar, a term derived from “radio detection and ranging”, is a powerful tool for measuring not only the range and rotation rates of planetary objects, but also their reflective and polarimetric scattering properties at microwave wavelengths. The basic concept of the radar technique for scientific purposes is transmitting a radio signal and receiving the echo, which carries a wealth of information about the object being investigated. For example, the round-trip time of a coded radar signal can be used for an accurate range measurement. In addition, the wave properties of the received signal can be compared to the known properties of the transmitted signal to reveal information about the physical and dynamical properties of the target.
2. Radar Observations of the Moon
2.1. Ground-Based Observations
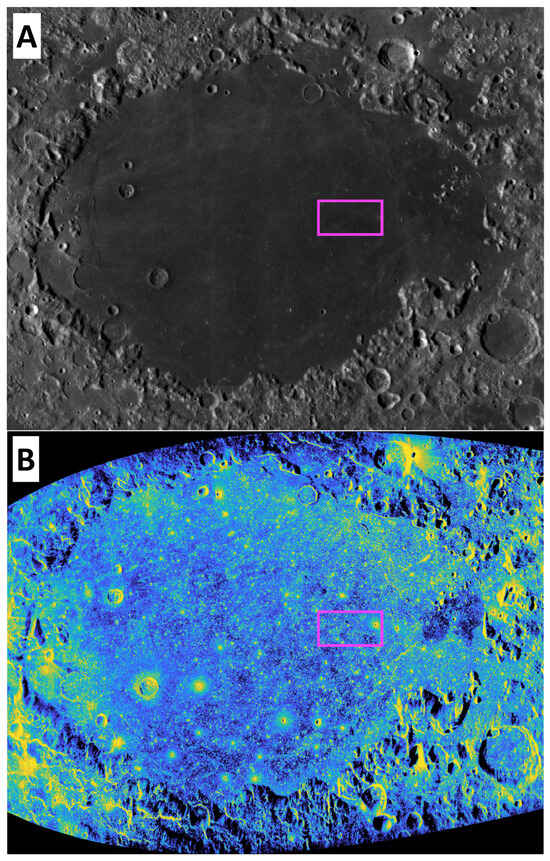
The first detection of radar signals reflecting from the Moon occurred in 1946. The so-called “Project Diana” was conducted by the US Army Signal Corps, and this achievement is considered the start of planetary radar astronomy. Since then, the Moon has been observed over a broad range of radar wavelengths, from 2.2 cm to 7.5 m, from ground-based telescopes such as the Arecibo Observatory, Goldstone Solar System Radar, MIT Haystack Observatory, Jicamarca Radio Observatory, and most recently the Green Bank Observatory. The observatory that has primarily been used for lunar radar science over the years has been the Arecibo telescope, which has provided dual-polarization observations of most of the near-side of the Moon at the P- (70 cm, 430 MHz) and S-band (12.6 cm, 2380 MHz). Due to the time it takes to switch between transmission and receiving modes, these observations were produced using a bistatic configuration, where Arecibo would transmit and the Robert W. Byrd Green Bank Telescope in West Virginia would receive [1][2][88,89]. Because the beam size of the Arecibo telescope is significantly smaller than the Moon, multiple observing sessions were needed; however, this also meant that the north–south ambiguity could be avoided by pointing the telescope at one hemisphere. In addition, because of the moon’s complicated and very slow apparent rotation as viewed from a point on Earth, the Doppler equator shifts over time, so that different points on the surface are affected by the north–south ambiguity, allowing most of the surface to be imaged. The two different observing wavelengths with Arecibo, 12.6 and 70 cm, allowed observations at different penetration depths. The 70 cm observations are particularly apt for identifying lava flows that are partly buried by regolith, while 12.6 cm observations are good for studying regolith properties. For example, Figure 1 shows Arecibo S- and P-band same-circular (SC) backscatter radar maps of Mare Crisium (17°N, 59°E) [1][2][88,89], along with an image from the Lunar Reconnaissance Orbiter's (LRO’s) wide angle camera for context. The S-band SC backscatter map highlights recent impact craters within the basin and their ejecta deposits more clearly than the P-band map. On the other hand, an ancient lava flow is markedly noticeable in the P-band image and not in S-band. This implies that the feature is likely buried at or below the S-band penetration depth (∼1 m) and/or is dominated by structure on the order of decimeters to meters rather than centimeters to decimeters. Indeed, multi-wavelength radar studies of the Moon have helped to reveal its volcanic history and provided important stratigraphic information (e.g., [3][4][90,91]). In particular, Arecibo P-band observations have helped to complete the inventory of lunar mare basalts by revealing buried features, such as cryptomaria [5][92], which are only otherwise visible by surface exposure through impact cratering. Longer wavelengths, such as the 6 m Jicamarca observations, can provide further constraints on ancient activity (e.g., [6][2]).Figure 1. Mare Crisium on the Moon as seen in (A) optical, (B) S-band, and (C) P-band radar. Radar images are maps of SC backscatter in dB scale. Color variation for the radar maps ranges between 1.5 times the interquartile range above and below the lower and upper quartile values from blue to yellow, respectively. In the magenta box, it notes a buried volcanic feature that appears in P-band images but not in the optical or S-band images. Data from NASA.
2.2. Lunar Orbital Radars
India’s lunar Chandrayaan-1 was the first SAR to orbit and observe the Moon. Launched in October 2008, Chandrayaan-1 was shortly followed by NASA’s Miniature Radio-Frequency (Mini-RF) instrument aboard the Lunar Reconnaissance Orbiter, which launched in June 2009. Chandrayaan-1 operated at 12.6 cm, while Mini-RF operates at both 4.2 and 12.6 cm. They operated together until communications were lost from Chandrayaan-1 in August 2009. The first radar experiment on the Moon, though, was conducted with the Clementine spacecraft in 1994 [7][98]. Clementine conducted a bistatic radar experiment by transmitting an S-band signal through its high-gain antenna, which reflected off the south pole of the Moon and was received by the Deep Space Network (DSN). The advantages of orbital radar assets over ground-based planetary radar observations of the Moon are improved spatial resolution, varying viewing geometries over regions during repeat passes, and fully polarimetric data sets. An additional advantage is that an orbital platform allows for radar imaging of the lunar far side. The search for water ice at the lunar poles has continued with orbital radar assets. The 13.2 cm bistatic radar experiment aboard the Clementine spacecraft identified a localized coherent backscatter opposition affect associated with some PSRs at the lunar south pole, but not its north pole [7][98]. These results, though, were not shown to be unique and anomalous for the region in later studies [8][99]. Continued experiments with dedicated synthetic aperture radars (SARs) have been similarly unsuccessful. Using monostatic Mini-RF and Chandrayaan-1 observations, Neish et al. [9][100] studied the S-band circular polarization ratio (CPR) of Cabeus crater, the site of the Lunar Crater Observation and Sensing Satellite (LCROSS). This spacecraft conducted an impact experiment on the Moon in an attempt to reveal buried volatiles. Although the LCROSS experiment identified water-related signatures in the resulting ejecta plume [10][101], pre- and post-impact Mini-RF S-band radar images of the region did not present anomalous backscatter [9][100]. Analysis of the initial CPR maps from the Mini-SAR on Chandrayaan-1 suggested that some polar craters showed high-CPR deposits only in their interiors and have low CPR values in adjacent deposits beyond their rims [11][102]. This finding was also supported by Mini-RF data by [12][103] who identified these features as “anomalous” craters. The interiors of these initially identified anomalous craters are wholly or in large part in permanent shadow and correlate with proposed locations of polar ice, as suggested by Lunar Prospector neutron spectrometer data [13][104]. A plethora of measurements at non-radar wavelengths support the existence of surface water ice at the lunar PSRs (e.g., [10][14][15][16][17][18][19][101,109,110,111,112,113,114]). Nevertheless, to date, radar investigations have not provided unique identification of buried water ice. This stark contrast to observations of Mercury’s poles (see next section) provides constraints on the delivery of water ice to the Moon relative to Mercury. Impact-induced regolith mixing models suggest that water ice deposits will be reworked into the background over scales of hundreds of millions of years for both bodies [20][115]. As such, the difficulty in radar detection of ice at the Moon may suggest intimate mixing with the regolith and burial at great depths, while on Mercury the clear detection of water ice may suggest a recent voluminous delivery of water ice. Continued dual-frequency orbital radar missions, such as the Indian Space Research Organization’s (ISRO) Dual-frequency SAR (DFSAR) aboard Chandrayaan-2, though, may provide new insights into the nature of lunar ice. DFSAR is the first to observe the Moon at L-band in addition to S-band. Orbital radar data has also proven to be an extremely useful tool for studying the geology of the lunar surface. With a now global view of the Moon, it can confirm the ground-based measurements that suggest the radar scattering properties of the Moon are broadly related to the mare–highlands dichotomy. The highlands have higher radar backscatter, likely due to a lower loss tangent in the regolith, which allows for more scattering from subsurface rocks [21][38]. Orbital radars also gave us our first look at the scattering properties of the global crater population of the Moon. These observations confirmed earlier ground-based data that suggested that impact melt deposits were among the rough materials on the Moon [2][89]. This unique property allowed for the construction of the first global data set of lunar impact melts since the 1970s [22][116]. It has also revealed melt deposits in unusual locations, such as the Tycho antipode [23][117].3. Radar Observations of the Planets
3.1. Mercury
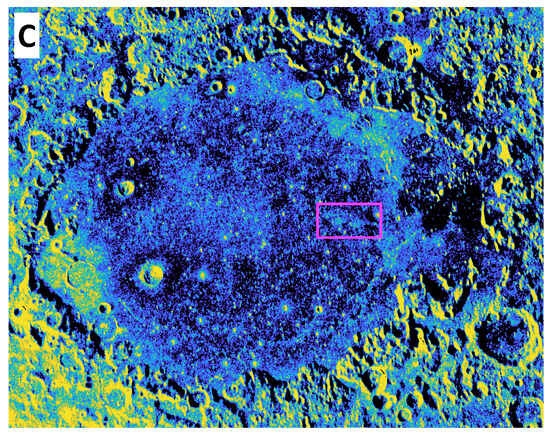
Radar observations of Mercury provided the first compelling evidence of volatiles within permanently shadowed regions (PSRs) of polar craters. Full-disk radar mapping of Mercury conducted via monostatic Arecibo S-band (12.6 cm, 2380 MHz) radar observations [24][14] and bistatic observations, where the Goldstone 70 m antenna transmitted in X-band (3.5 cm, 8560 MHz) and 26 antennas of the Very Large Array received backscattered echoes [25][13], identified anomalously bright features at both poles. The features were associated with CPR > 1. Together these radar properties were reminiscent of the scattering behavior of the icy moons of Jupiter [26][27][28][8,122,123] and the Martian south polar layered deposits [29][124]. In subsequent Arecibo radar observations, delay and Doppler planetocentric projected spatial resolutions were improved to as fine as 1.5 km [30][31][125,126], allowing for tracking of the anomalously high reflectivity to crater-sized features. Figure 2 shows an example delay–Doppler image of Mercury’s north polar radar-bright features using the observations presented in [32][31], which were processed to a delay resolution of 1.5 km. For these features, thermal models demonstrated that within some 10° of the poles most crater geometries would result in PSRs with temperatures low enough to permit stable water ice at the surface, and to lower latitudes if insulated by a thin layer [33][34][127,128]. Thus, the properties of the radar-bright features at Mercury’s poles have been interpreted as resulting from scattering from water ice, with their high reflectivity likely due to the coherent backscatter effect [35][36][15,17].Figure 2. Total power radar backscatter delay–Doppler image of Mercury’s north polar bright features as observed on 19 July 2019. Values are in dB scale and resolution is 1.5 km/pxl. Data were collected in [32][31].
The ground-based-radar-enabled discovery of ice at Mercury’s poles served as one of the motivators for NASA’s MESSENGER mission to Mercury, which launched in 2004, began science operations at Mercury in 2011, and concluded in 2015. Detailed observations by the MESSENGER spacecraft confirmed that radar-bright features are associated with PSR locations [37][38][129,130] and provided further support for the water ice interpretation as it found that the north polar region was on average enriched in hydrogen [39][131]. At the same time, though, MESSENGER observations revealed new complexities. First, not all Mercurian PSRs are associated with a radar-bright feature [38][40][130,132]. This may provide constraints on the source and timing of volatile delivery and deposition. Alternatively, the water ice content within some PSRs may be too thin or buried too deeply to be detected by S-band radar observations.
The heterogeneity of the Mercurian putative ice deposits revealed by MESSENGER motivated a renewed radar investigation. Leveraging the high-resolution topography data from MESSENGER, refs. [32][41][31,135] paired new Arecibo S-band radar observations with a topography-corrected radar incidence angle map to investigate the scattering properties of the features. In their work, they showed that some northern radar-bright features are associated with a distinct pattern in their properties, whereby a central high reflectivity and high-CPR region is surrounded by lower backscatter in a gradational pattern. Radar scattering modeling suggests that high reflectivity regions within PSRs are well characterized by nearly pure water ice decreasing out to >20% impurities by volume [32][31]. Thus, the purest ice deposits at Mercury are likely surrounded by water-ice-rich regolith. This could be due to lateral mixing induced by impact gardening and/or the local thermal environment.
3.2. Venus
Venus’ thick atmosphere, which is opaque at visible wavelengths, has made radar the primary means of studying its surface. These observations go back many decades, to the first accurate determination of the rotation rate of Venus in the 1960s [42][4]. In the 1970s and 1980s, ground-based and orbital platforms returned global topography data and low-resolution (km scale) regional radar images of Venus (e.g., [43][44][141,142]). The most comprehensive imaging of Venus was completed by the Magellan spacecraft in the early 1990s. This returned high-resolution (∼100 m) radar images of 98% of the surface of Venus [45][143].
One of the most intriguing discoveries made by Magellan was the occurrence of a sharp shift to high-reflectivity, low-emissivity material at a specific altitude on Venusian mountains [46][144]. The exact nature of this material remains unknown, but may be consistent with a ferroelectric mineral such as a perovskite [47][145]. Magellan images also revealed a wide range of volcanic features, including familiar features like shield volcanoes and lava flows, but also unusual structures such as flat-topped pancake domes and ring-shaped coronae [48][146]. A key question in Venusian science is whether or not the planet is volcanically active. Ground-based imaging of Venus between 1988 and 2012 did not reveal any obvious changes in radar properties consistent with volcanism [49][147].
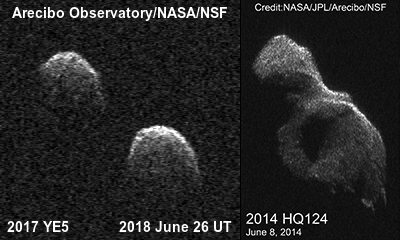 Figure 3. Two typical high-quality delay-Doppler images of asteroids 2017 YE5 (on the left) and 2014 HQ124 (on the right). Data from NASA/NSF/Arecibo Observatory/JPL.
Multi-body systems, i.e., binary and ternary asteroids, are of particular interest in terms of asteroid formation and evolution. They are also relatively common: The fraction of near-Earth asteroids larger than 300 m in diameter that are multiple systems is estimated to be about 15% [76][194]. Planetary radar is a powerful instrument in detecting asteroid moons, because the delay–Doppler imaging, and in some cases even just the Doppler echo power spectra, can reveal the asteroid moons more distinctly than optical lightcurves. This is because the satellites often have their spins tidally locked to their orbits [76][194], which concentrates the radar echo into a very narrow frequency interval, so that they appear bright. To date, 69 multi-body systems have been observed using radar, starting with (1866) Sisyphus in 1986 (though it was not recognized at the time). The first well-characterized near-Earth binary system, 2000 DP107, was discovered using radar in 2000 [77][195].
Figure 3. Two typical high-quality delay-Doppler images of asteroids 2017 YE5 (on the left) and 2014 HQ124 (on the right). Data from NASA/NSF/Arecibo Observatory/JPL.
Multi-body systems, i.e., binary and ternary asteroids, are of particular interest in terms of asteroid formation and evolution. They are also relatively common: The fraction of near-Earth asteroids larger than 300 m in diameter that are multiple systems is estimated to be about 15% [76][194]. Planetary radar is a powerful instrument in detecting asteroid moons, because the delay–Doppler imaging, and in some cases even just the Doppler echo power spectra, can reveal the asteroid moons more distinctly than optical lightcurves. This is because the satellites often have their spins tidally locked to their orbits [76][194], which concentrates the radar echo into a very narrow frequency interval, so that they appear bright. To date, 69 multi-body systems have been observed using radar, starting with (1866) Sisyphus in 1986 (though it was not recognized at the time). The first well-characterized near-Earth binary system, 2000 DP107, was discovered using radar in 2000 [77][195].
3.3. Mars
Radar images of Mars are limited to a few low-resolution, ground-based observations completed at X-band (3.5 cm) and S-band (12.6 cm). The first radar images of Mars were conducted in 1988 using Goldstone and the Very Large Array (VLA) in a bistatic configuration [29][124]. These low-resolution (170 km) X-band images revealed radar-bright features near Mars’s equatorial volcanoes, a radar-dark feature (dubbed “Stealth”) correlated with a low-density, rock-poor deposit, and a radar-bright feature associated with the south polar ice cap. Radar image processing improved during the 1990s and 2000s, utilizing a novel “long-code” method for delay–Doppler imaging [50][151]. This technique addressed issues associated with overspreading in the radar echoes due to Mars’s rapid rotation, and produced the first images of Mars at S-band [51][152]. Data acquired by Arecibo during the 2005–2012 opposition of Mars produced the highest-resolution radar images (∼3 km) of Mars to date [52][53][29,153]. These images have revealed features unseen in optical images of Mars. One of the more surprising discoveries is the presence of many lava flows with CPRs that exceed unity. This property is unusual for terrestrial lava flows, and suggests that Martian lava flows have blocky or disrupted surfaces [54][154]. These data also provided detailed radar images of the Martian polar ice caps. Their radar polarization properties are consistent with the coherent backscatter effect associated with relatively pure ice [53][153]. Radars have also been used to probe the subsurface of Mars. Three radar sounders have reached Mars and are still in operation today, namely, MARSIS, aboard ESA’s Mars Express spacecraft [55][51], SHARAD, on NASA’s Mars Reconnaissance Orbiter [56][34], and MOSIR, on Tianwen-1 [57][53]. As ice is one of the most transparent natural materials at the frequencies employed by radar sounders, the Martian polar caps have been prime targets for observation. Their thickness and volume were thus measured, allowing an estimate of their total water ice content [58][35], and their interior layering was mapped to study their origin and evolution shaped by Martian climate cycles [59][32]. Although covered by layers of rocky debris, ice was found also at mid-latitudes [60][155], and is thus potentially accessible by future human explorers, while the enigmatic Medusae Fossae Formation has been found to be radar-transparent, but no conclusive evidence of the presence of ice in its interior could be provided [61][156].3.4. The Galilean Moons
The Galilean moons are among the most interesting planetary objects in terms of their radar-scattering properties. They were first observed in 1976 at Arecibo [26][62][8,170]. Due to the high abundance of ice on Europa, Ganymede, and Callisto, the radar albedo and the SC radar cross-sections are anomalous compared to other planetary objects. Hapke [36][17] used laboratory experiments to show that the enhancements in both the reflectivity and the polarization are caused by the coherent backscattering effect. This theory has been supported via various numerical models [63][64][171,172]. Two spacecraft missions to Europa equipped with radar sounding systems are planned in the near future: ESA’s Radar for Icy Moons Explorer (RIME) instrument onboard Jupiter Icy Moons Explorer (JUICE) [65][66][173,174], and NASA’s Radar for Europa Assessment and Sounding: Ocean to Near-Surface (REASON) onboard Europa Clipper [67][68][175,176]. These missions have a pioneering opportunity to characterize the subsurface of Europa using radar sounding and the processes that shape Europa’s unique icy surface.3.5. The Moons and Rings of Saturn
The Saturnian system is the most distant radar-detected planetary object in the solar system. Radar observations by ground- and space-based assets have returned important information about its rings and moons. The first radar observations of Saturn’s rings occurred in the early 1970s [69][177]. These observations demonstrated that the ring particles are at least cm sized or greater; these sizes were required in order to have an observable radar echo at S-band (12.6 cm). In the subsequent decades, numerous other ground-based radar measurements were acquired of the rings (e.g., [70][71][178,179]), revealing more detailed information about their geometry. Ground-based radar observatories have also made several observations of Saturn’s moons, including Titan [72][180], Iapetus [73][181], Rhea, Dione, Tethys, and Enceladus [74][182]. The circular polarization ratios of the Saturnian moons are somewhat lower than those of the Galilean satellites, but still consistent with abundant subsurface volume scattering due to the presence of water ice. The observed differences between the Galilean and Saturnian moons are likely due to differences in the composition of their near subsurfaces.4. Radar Observations of Small Solar System Objects
4.1. Asteroids
Due to the rapid fall-off in radar power with distance, the majority of radar-observed SSSOs have been near-Earth asteroids (NEAs). Only 138 main-belt asteroids (MBAs) have been observed using radar compared to more than a thousand NEAs (https://echo.jpl.nasa.gov/asteroids/PDS.asteroid.radar.history.html, accessed on 26 November 2023). Because the received power falls inversely proportional to the fourth power of distance, the targets nearby are more easily observable. The first radar-observed NEA was (1566) Icarus in June 1968, which was observed bistatically at Goldstone and Haystack. From this point up until the end of the 1970s, only up to one asteroid was observed per year. The number increased to 4–15 per year through the 1980s and 1990s, and continued to increase through the 2000s and 2010s as instruments were upgraded and NASA began to provide more funding for asteroid observations. The peak number of 123 NEAs were observed at Arecibo in 2019 [75][43], plus three more using the DSN telescopes at Goldstone and Canberra (https://echo.jpl.nasa.gov/asteroids/PDS.asteroid.radar.history.html, accessed on 26 November 2023). The total number of unique radar-observed NEAs is currently above 1060 and counting, the exact number depending to a small extent on which objects count as successful detections. Note that the target location has to be known with a precision better than the beam width of the radar system to be observable. Radar delay-Doppler imaging allows for higher resolution maps of planetary bodies than any other ground-based imaging method, including VNIR wavelengths, and range measurements can be as precise as a few meters at best. For example, Figure 3 shows an example of delay-Doppler images of NEAs: an equal-mass binary 2017 YE5 at a range resolution of 7.5 m (vertical so that the range increases from top down) and a frequency resolution of 0.0204 Hz (horizontal), and a contact binary 2014 HQ124 at a range resolution of 1.875 m and a frequency resolution of 0.00625 Hz. Furthermore, the disk-resolved images enable a variety of other products from shape models to disk-resolved polarimetric analysis that can give clues of the regolith structure and composition.
Figure 3. Two typical high-quality delay-Doppler images of asteroids 2017 YE5 (on the left) and 2014 HQ124 (on the right). Data from NASA/NSF/Arecibo Observatory/JPL.
Multi-body systems, i.e., binary and ternary asteroids, are of particular interest in terms of asteroid formation and evolution. They are also relatively common: The fraction of near-Earth asteroids larger than 300 m in diameter that are multiple systems is estimated to be about 15% [76][194]. Planetary radar is a powerful instrument in detecting asteroid moons, because the delay–Doppler imaging, and in some cases even just the Doppler echo power spectra, can reveal the asteroid moons more distinctly than optical lightcurves. This is because the satellites often have their spins tidally locked to their orbits [76][194], which concentrates the radar echo into a very narrow frequency interval, so that they appear bright. To date, 69 multi-body systems have been observed using radar, starting with (1866) Sisyphus in 1986 (though it was not recognized at the time). The first well-characterized near-Earth binary system, 2000 DP107, was discovered using radar in 2000 [77][195].