Your browser does not fully support modern features. Please upgrade for a smoother experience.
Please note this is a comparison between Version 1 by JCI Zamarripa-Ramírez and Version 3 by Jason Zhu.
The temperature field and chemiluminescence measurements of axisymmetric flame are obtained simultaneously in only one image. Digital Laser Speckle Displacement measures temperature fields, and direct image flame determines chemiluminescence values. Applying the Abel transform of axisymmetric objects for volume visualization requires smooth intensity profiles. Due to the nature of the experimental setup, direct image flame is corrupted with speckle noise and a crosstalk effect. These undesirable effects deteriorate the measurement results. Then, experimental data need crosstalk correction and speckle noise reduction to improve the measurements.
- chemiluminescence
- optics
- fluid flow
- premixed flames
1. Introduction
Studying a combustion process is a very complex task [1]. However, the characterization of a flame is essential to improve the combustion process’s efficiency and reduce pollutant emissions. Measuring several variables in a flame is used to monitor the efficiency of combustion processes. Generally, some measured variables are flame temperature, soot concentration, radical intensities, flame size, luminosity, and flickering [2][3][4][5][6][7][8][9][10][11][12][13][14][15][16][17][18][19][20][21][22][2,3,4,5,6,7,8,9,10,11,12,13,14,15,16,17,18,19,20,21,22]. Full-field optical techniques are usually used to make this kind of measurement because they give a global description of the process and do not disturb the sample. On the other hand, simultaneously measuring several variables is preferable because this avoids the lack of correlation between them [9][16][17][18][19][9,16,17,18,19]. However, a complex optical setup is usually employed for measurement in such cases, making the task costly and challenging [16][18][16,18].
The flame equivalence ratio (𝛷) is an adimensional variable used to determine if a fuel-oxidizer mixture is rich, lean, or stoichiometric [1]. When 𝛷>1, it denotes a fuel-rich mixing process; on the other hand, 𝛷<1 is related to fuel-lean mixtures, and the last 𝛷=1 in the ratio relationship is the value for stoichiometric mixing. This relation is intrinsically linked to determining a system’s performance. This study, as in others, corroborates that the maximum temperature value is obtained at a value of 𝛷=1.05 for LPG fuel. Other variables that can be connected directly to the flame equivalence ratio are the temperature and radical intensities (chemiluminescence) [10][11][12][13][14][15][16][17][18][19][10,11,12,13,14,15,16,17,18,19]. In a combustion process, some released species are OH, CH, CH2O, and C2, which have a specific emission spectrum [10][11][12][13][14][15][16][17][18][19][10,11,12,13,14,15,16,17,18,19]. In these combustion flames, the presence of radicals C∗2 and CH∗ are inherent in the reaction zone. These two chemical species are most abundant within the flame. Furthermore, these radicals emit in the visible region of the electromagnetic spectrum, centered at wavelengths 430 nm and 525 nm, respectively [14]. For this reason, digital color cameras play an essential role in chemiluminescence measurements [11][12][13][14][15][16][17][18][11,12,13,14,15,16,17,18]. In this analysis, each color channel contributes specific information about the object under study. However, most digital color cameras suffer from the crosstalk effect; this occurs when sensors have overlapping sensibilities, contaminating the recorded data and needing correction [15][17][15,17].
There are few works in which chemiluminescence and flame temperature are measured [3][16][17][18][3,16,17,18]. In one of the works, the optical system is simple; they only use a camera, and the temperature is measured using two-color pyrometry. However, temperature measurement is applicable only for sooty flames [3]. In other research, two-color pyrometry is also used to determine the flame’s temperature; however, the optical arrangement is complex [16][18][16,18]. In [17], the optical configuration is simple to implement, and Digital Laser Speckle Displacement (DLSD) is used to determine the temperature fields. However, the chemiluminescence measurements are contaminated with speckle noise, making determining these values difficult.
2. Theoretical Development of Intensity Profiles on Flames
When a frame of information is registered on the camera plane, it corresponds to the projected intensity profile of the flame. In some studies of combustion analysis, it is a common topic of interest to determine the reconstructed profile [23][25]. Therefore, homolog Abel deconvolution techniques can be used from speckle displacement to intensity. The direct and inverse Abel transforms are linked to analyze the desirable plane: 𝜌(𝑥,𝑧)=2∫∞𝑥𝐼(𝑟,𝑧)𝑟𝑑𝑟𝑟2−𝑥2−−−−−−√
𝐼(𝑟,𝑧)=1𝜋∫∞𝑟∂𝜌(𝑥,𝑧)∂𝑥𝑑𝑥𝑥2−𝑟2−−−−−−√
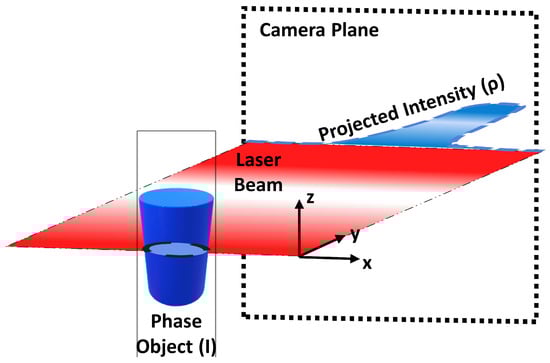
Figure 1.
Intensity profile projected on the camera plane from the phase object.
3. Algorithm for Profile Intensity Noise Reduction
Temperature and chemiluminescence values are obtained using DLSD. The data corresponding to chemiluminescence values require speckle noise reduction. Noise reduction is achieved using a four-order PDE to create a later curve fitting, utilizing a set of Gaussian functions. 1. Elimination of background noise: Firstly, it is necessary to perform a subtraction from the object image minus the reference image: 𝜌𝑆𝑟𝑔𝑏(𝑥,𝑧)=𝜌𝑂𝑟𝑔𝑏(𝑥,𝑧)−𝜌𝑅𝑟𝑔𝑏(𝑥,𝑧)
𝜌𝑆𝑐(𝑥,𝑧)⎧⎩⎨𝑁 𝜌𝑆𝑐(𝑥,𝑧)≤ 𝑡𝐹 𝜌𝑆𝑐(𝑥,𝑧)>𝑡
∇2𝜌𝑛(𝑖,𝑗)=𝜌𝑛𝑖+1,𝑗+𝜌𝑛𝑖−1,𝑗+𝜌𝑛𝑖,𝑗+1+𝜌𝑛𝑖,𝑗+1−4𝜌𝑛𝑖,𝑗ℎ2
𝜌𝑛+1𝑖,𝑗=𝜌𝑛𝑖,𝑗−𝜔∇2𝜌𝑛(𝑖,𝑗)
𝜌(𝑥,𝑧)=∑𝑖=1𝑘𝑤𝑖𝑓𝑖(𝑥,𝑧)