Laccases in Phenolic Compound Detection and Quantification: Comparison
Please note this is a comparison between Version 3 by Mona Zou and Version 2 by Mona Zou.

Phenolic compounds (PheCs) are particularly relevant in many different frameworks due to their pro-oxidant and antioxidant activities. In fact, on the one hand, they are considered very dangerous pro-oxidant agents that can be present in the environment as pollutants in wastewater and soil from different industrial and agricultural industries. On the other hand, the antioxidant influence of PheCs available in natural products (including foods) is nowadays considered essential for preserving human health. Conventional techniques for detecting PheCs present some disadvantages, such as requiring expensive instrumentation and expert users and not allowing in situ measurements. This is the reason why there is a high interest in the development of simple, sensitive, specific, and accurate sensing methods for PheCs. Enzymes are often used for this purpose, and laccases with unique optical properties are adopted as bio-elements for sensing schemes. 

  • laccases
  • phenolic compounds
  • optical properties
  • optical biosensors

1. Optical Properties of Laccase

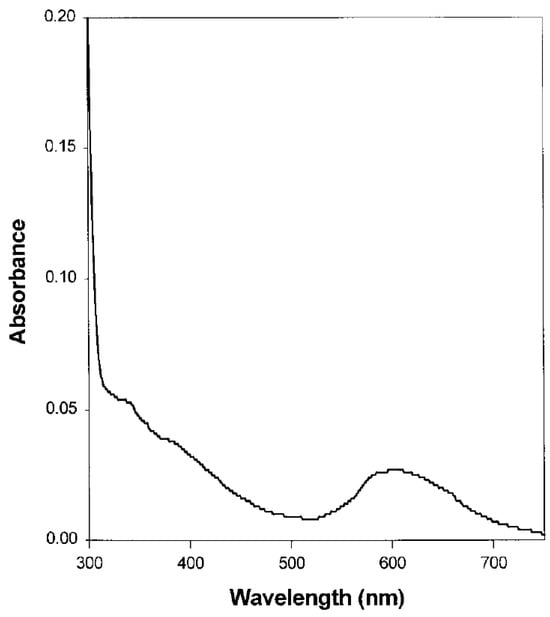
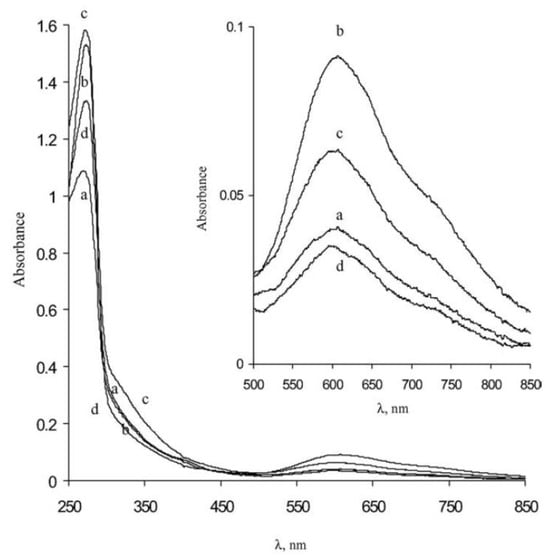
1.1. UV–Vis Absorption Spectroscopy

Most laccases have important optical properties due to the presence of copper atoms in the catalytic center. Most of the kinetic and spectroscopic studies on laccases are summarized in a book by Messerschmidt [1] as well as in several reviews [2][3]. As already mentioned, laccases are also categorized by their optical properties: blue, yellow, and white laccases. Most of the studies reported so far are on blue laccases. In blue laccases, the T1 copper, responsible for the blue color of cuproproteins, has an absorption maximum of about 600 nm [4][5]. These laccases are reported in a variety of organisms, including Pleurotus pulmonarius [6], Pleurotus ostreatus [7][8], Coriolus versicolor, Panus phlebia Radiata, Phlebia tremellosa, Agaricus bisporus [9], Thermus sp. [10], and Trametes versicolor [11]. Those laccases that do not exhibit the absorption feature around 600 nm are known as white or yellow laccases, and they have rarely been studied [12][13]. They differ from blue laccases because they oxidize non-phenolic substrates in the absence of mediator molecules [13], which are required in cases of blue laccases. White laccases have absorption at around 400 nm and contain one copper ion, one iron ion and two zinc ions. They have been observed in Pleurotus ostreatus [7][8], Trametes hirsuta [14][15], and Myrothecium verrucaria [16]. The yellow laccases contain the copper atoms in a modified oxidation state and have been reported in Panus tigrinus [9], Daedalea flavida [17], Trametes sp. [18], Pleurotus ostreatus [19], and Sclerotinia sclerotiorum [12]. As for the copper of type 2, it exhibits weak absorption in the visible spectrum. Finally, the two copper atoms of type 3 are characterized by absorption around 330 nm.
A typical UV–Vis absorption spectrum for a blue laccase has been reported by Shin et al. [20], in their study of the ligninolytic systems of Coriolus hirsutus (a blue laccase) and their role in lignin degradation. The absorption spectrum of laccase showed a signal at approximately 600 nm that is related to T1 copper atoms (Figure 1). The contribution of the copper atoms of type 3 is not clear, but it is associated with a small shoulder that is present at around 330 nm [20].
Figure 1.
Absorption spectrum of
Coriolus hirsutus
laccase; investigated samples were prepared by dissolving 0.7 mg of the enzyme in 20 mM sodium acetate buffer pH 4.5 (reprinted with permission from Ref.
[20]
).
In 2000, Revina et al. [21] obtained spectroscopic insights into the effect of oxygen in aqueous solutions of two types of laccases: Coriolus hirsutus and Coriolus zonatus. These authors report the optical absorption spectrum of Coriolus hirsutus in a neutral aqueous solution saturated with air in Figure 1 of their paper. In that figure, changes in the 360–600 nm range are evident when the solution is found to be saturated with helium. This phenomenon turns out to be reversible; in fact, after the passage of air, the absorption band returns to the initial state [21]. The same was observed for Coriolus zonatus.
Shleev et al. [22] presented a work highlighting the optical properties of the laccases from several basidiomycetes (Trametes ochracea, Trametes hirsuta, Coriolopsis fulvocinerea and Cerrena maxima). Spectroscopic investigations were accomplished to understand the characteristics of the active sites of the different laccases mentioned above. In Figure 2, the large absorption band located at 280 nm (typical of tryptophan) is evident, while a small band at 610 nm (related to copper atoms of type 1) is present and more clearly shown in the inset. Also, in this case, a faint shoulder around 330 nm can be devised. Furthermore, Shleev et al. [22] reported the results of their circular dichroism measurements aimed at defining the secondary structures of laccases. These measurements evidenced contributions from α-helix (~10%), β-sheet (~30%), turn (~20%), and random (~40%) components.
Figure 2.
Absorption spectra of (a)
T. ochracea
, (b)
T. hirsuta
, (c)
Coriolopsis fulvocinerea
and (d)
Cerrena maxima
laccases (1 mg/mL in phosphate buffer pH 6.0) (reprinted with permission from Ref.
[22]
).
Delfino et al. [23] performed a study on the dynamics of the excited state of the T1 copper site of blues laccase from Pleurotus ostreatus, in which they exciting the charge transfer of the 600 nm band with a 15 fs pulse and probing over a broad range in the visible region. The results have been discussed in terms of a peculiar hypothesized trigonal T1 Cu site geometry for the considered enzyme.

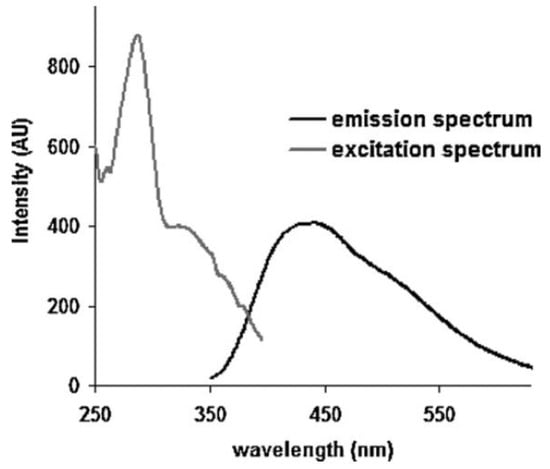
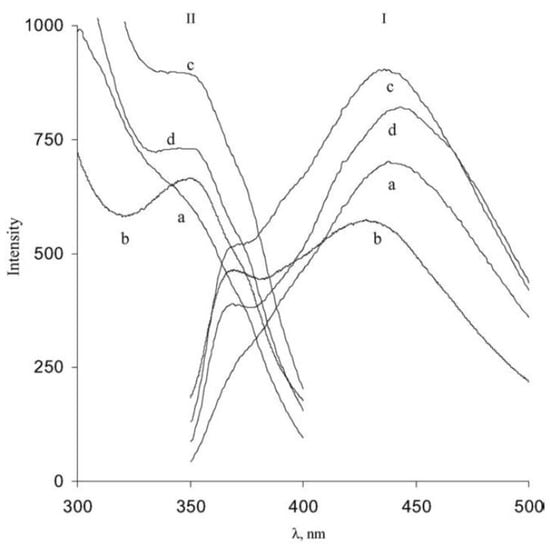
1.2. Fluorescence Spectroscopy

Laccases have been observed to possess intrinsic fluorescence that largely depends on tryptophan residues, which can be excited either directly or by energy transfer from tyrosine residues. Golderg and Pecht [24], in a pivotal study on laccase extracted from Rhus vernicifera lacquer, evidenced this behavior by considering the dependence of the emission spectra on the excitation wavelengths. When the excitation wavelength is equal to 305 nm, it is absorbed only by tryptophan, and the maximum of the emission spectra is located at 338 nm. When the excitation wavelength is equal to 280 nm, it is absorbed by tryptophan and tyrosine and the maximum of the emission spectrum shifts to shorter wavelengths with a significant increase in the fluorescence signal intensity. A similar behavior is observed when the excitation wavelength is equal to 250 nm that is absorbed only by tyrosine. In Ref. [24], the changes in quantum yield induced by reduction processes and dependent from excitation wavelength have been also reported.
Using the same laccase cited above, Wynn et al. [25] confirmed that the presence of O2 influences the reactivity of the enzyme and its excitation and emission spectra. This is because the presence of oxygen influences the oxidation state of the enzyme [25].
The fundamental studies carried out in Refs. [24][25] evidenced the potentiality of fluorescence spectroscopy in characterizing different laccases. Mot et al. [12][26] investigated laccase from the phytopathogenic fungus Sclerotinia sclerotiorum using this spectroscopic approach. The previously cited enzyme presents interesting characteristics; in fact, it can be classified as a yellow laccase by considering its UV–Vis absorption spectral features, but EPR measurements indicate a similarity with blue laccase. In Figure 3, the visible emission spectrum, obtained with an excitation wavelength equal to 330 nm, showing a maximum located at 440 nm, is reported. In this figure, an excitation spectrum with a band at 330 nm is also shown when the fluorescence emission is monitored at 420 nm. This band is a typical characteristic of type-3 copper. Further details on the intriguing optical properties of this enzyme can be found in Refs [12][26].
Figure 3. Fluorescence spectra of laccase from fungus Sclerotinia sclerotiorum. The emission spectrum shows a visible signal with the maximum located at 440 nm, while the excitation spectrum shows a peak located at 280 nm and a band centered at 330 nm. The laccase solutions were prepared using 2-(N-Morpholino) ethanesulfonic acid 4-Morpholineethanesulfonic acid (MES) buffer (reprinted with permission from Ref. [26]).
In the previously mentioned study by Shleev et al. [22], the authors showed the emission and excitation spectra of different blue laccases (see Figure 4). In this case, the excitation spectra clearly show, in almost all of the cases, a band at around 330 nm that is typical of type-3 copper atoms, as above reported. The emission spectra present a maximum of around 440 nm. More recently, the fluorescence properties of laccase from Trametes versicolor were investigated by Saoudi et al. [27]. In particular, the fluorescence emission spectra were collected in the 350–500 nm wavelength region following the excitation of tryptophan residues (λexc = 280 nm), and changes induced by different pH levels were also investigated.
Figure 4. Emission spectra (I: with an excitation wavelength of 330 nm) and excitation spectra (II: with an emission wavelength of 420 nm) of laccases from (a) T. ochracea, (b) T. hirsuta, (c) Coriolopsis fulvocinerea and (d) Cerrena maxima (reprinted with permission from Ref. [22]).

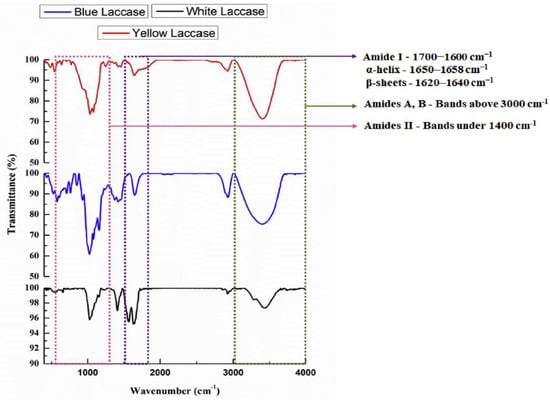
1.3. Fourier Transform InfraRed (FT-IR) Spectroscopy

FT-IR spectroscopy is widely employed for investigating the biochemical features of biological samples. The analysis of FT-IR spectra of proteins and enzymes gives valuable information on the functional groups that are present in a particular sample and the changes induced by external agents or occurring processes [28][29][30][31].
For example, FT-IR spectroscopy has been adopted for investigating differences among various laccases. Agrawal et al. [11] acquired spectra from blue (T. versicolor), white (M. verrucaria ITCC 8447) and yellow (Stropharia sp. ITCC 8422) laccases that are reported in Figure 5. These spectra show the main contribution of Amide I in the 1600–1700 cm−1 wavenumber region, Amide II located around 1550 cm−1 and Amide A and B in the 3000–4000 cm−1 spectral interval. As is widely known, the analysis of Amide I allows the characterization of the different subcomponents of secondary structures (mainly α-helix and β-sheet) [28][29]. By performing this analysis, the authors observed that blue laccase shows signals related to the α-helix and β-sheet bands, and prominently those of amides II, A and B (see Figure 5). In the case of yellow and white laccase, the FTIR spectra present similar contributions, but the bands are characterized by different intensities, thus suggesting different relative weights of the various components.
Figure 5. FT-IR spectra of yellow laccase (red line), blue laccase (blue line) and white laccase (black line) (reprinted from Ref. [11] under open access conditions).
Another relevant application of FT-IR spectroscopy in the case of enzymes is related to the study and characterization of the immobilization processes. In particular, the analysis of the Amide I and Amide II band region is generally used for monitoring the preservation of enzymatic activity after the immobilization procedures, as shown in Refs. [11][32][33][34][35][36].

2. Laccase-Based Sensor Development

The above-described peculiar optical properties of laccase offer remarkable possibilities for developing different biotechnological applications as assays for evaluating laccase activity. Laccases and phenol reaction products show relevant optical signals in the UV and visible range that are usually employed for developing methods for monitoring laccase activity using absorbance or fluorescence measurements [37][38]. The optical properties of laccase are also exploited for elaborating methods for monitoring phenol degradation [39]. However, the most relevant use of optical characteristics of laccases is related to the design of optical biosensors that present significant advantages since they are small, light, chemically inert, non-toxic, and immune to electromagnetic interferences. The use of laccase allows the development of sensors for medical applications, essentially related to the detection of dopamine, catecholamines and other neuromodulator molecules [40][41][42][43][44]. Many optical laccase-based biosensors have been developed to detect and quantify phenolic compounds. Due to the dual role of phenol compounds [45], laccase optical biosensors have essentially been developed for monitoring phenol concentrations for environmental or dietary applications.
In 2015, M.M. Rodriguez-Delgado et al. [46] revised the laccase-based biosensors for the detection of phenolic compounds and described the different optical biosensors reported in the literature.
(a)
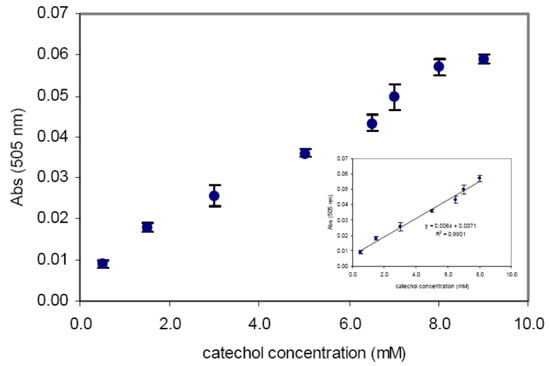
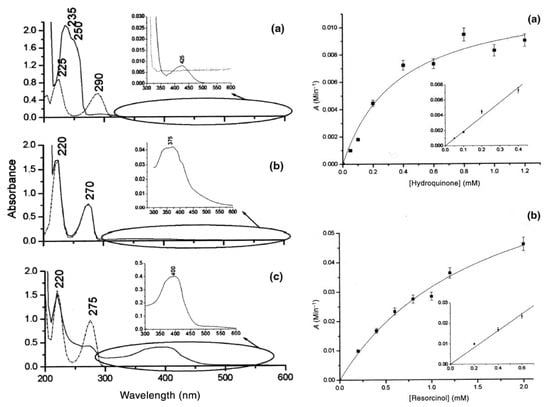
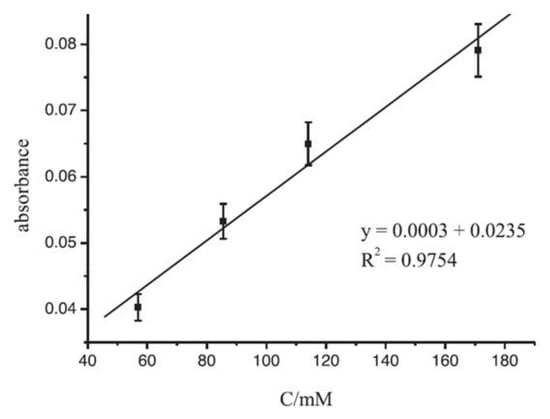
Sensor based on optical absorption spectroscopy.
The most used approach in developing biosensors using laccase is certainly the one related to the measurement of changes in absorption characteristics of the active element. The first optical biosensor that exploited the changes in absorption due to the interaction between immobilized laccase and phenol compound was proposed by Simkus and coworkers in 1996 [47]. The prepared fiber optic biosensor used a sol–gel matrix for immobilizing the enzyme and investigated the changes occurring in the absorption spectra due to the oxidation of 2,5-dimethoxy phenol in the presence of laccase. The intensity changes at 470 nm have been used to quantify the presence of the above-mentioned phenol in a concentration range equal to 1–60 mM. The authors also monitored the response time and time stability of their biosensors. It is worth noting that sol–gel technology offers the possibility to prepare optically transparent matrices useful for immobilizing enzymes. This technology offers the possibility of fabricating matrices for laccase immobilization with suitable chemical stability, optical transparency, and porosity (see Refs. [48][49][50]).
Abdullah et al. [51] designed an optical biosensor taking advantage of the ability of laccase to oxidize methoxy phenols in the presence of 3-methyl-2 benzothiazolinonehydrazone (MBTH) to produce azo-dye compounds for detecting phenols in environmental monitoring. Stacked films of MBTH in hybrid Nafion/sol–gel silicate and laccase in chitosan have been adopted for the preparation of a biosensor that is particularly sensitive to catechol, in comparison with other examined analytes, such as guaiacol, o-cresol, and m-cresol, that have also been considered by the authors. In Figure 6, the response curve of the biosensor is reported for increasing concentrations of catechol in phosphate buffer solution at pH 6.0. As is evident, the linearity range is equal to a 0.5–8.0 mM catechol concentration. A detection limit equal to 0.33 mM is evaluated. The detection limit has been estimated according to Refs. [52][53].
Figure 6.
Calibration curve and linear range (inset) of the optical biosensors proposed by Abdullah et al. for catechol detection (reprinted from Ref.
[51]
under an open access condition).
The same approach used by Simkus et al. [47] has been adopted for preparing a biosensor to determine the concentration of hydroquinone, resorcinol, and catechol. Laccases and phenol reaction products show useful optical signals in the UV and visible range. These signals have been adopted for biosensing applications since the compounds produced by the laccase interaction with different phenols are characterized by different optical absorption spectra. The occurrence of these different spectra increases the specificity of laccase-based biosensors [54], and they have been used to determine hydroquinone, resorcinol, and catechol concentrations, respectively (see Figure 7). In Figure 7, the absorption spectra of laccase solutions in the presence of the three phenol above-mentioned compounds are presented: (a) for hydroquinone, (b) for resorcinol and (c) catechol. For developing useful biosensors, laccase was immobilized in sol–gel matrices as described in Refs. [55][56]. On the right side of Figure 7, the calibration curves of sol–gel immobilized laccase at increasing concentrations of resorcinol and catechol are shown.
Figure 7. In the left of the Figure see panels (ac). (a) Absorption spectra of hydroquinone and a solution of laccase and hydroquinone; (b) absorption spectra of resorcinol and a solution of laccase and resorcinol; (c) absorption spectra of catechol and a solution of laccase and catechol. The (a,b) panels on the right show the calibration curve of the optical biosensors based on sol–gel immobilized laccase at increasing concentrations of resorcinol and catechol (reprinted from Ref. [56] under open access conditions).
The hydroquinone–laccase reaction is characterized by a slow response time that prevented the use of this sensing scheme that was successfully used for resorcinol and catechol. Linear ranges up to 1.4 and 0.2 mM and an LOD of 4.5 and 0.6 µM have been obtained for resorcinol and catechol, respectively. Larger linear ranges, significant sensitivities, and good LODs are obtained with this biodevice in comparison with other biosensors using laccase from Trametes versicolor, as can be seen from Table 4 in Ref. [56]. This biosensor was also used with tap water samples added with known amounts of catechol and resorcinol for testing biosensing performances with real samples.
Sanz et al. [57] developed a laccase-polyacrylamide sensor exploiting the absorption and fluorescence properties of the enzyme and characterized by a linear range of 0.11–2.5 mM and a limit of detection (LOD) of 100 µM for phenols. This biosensor was also challenged with wastewater samples.
In Figure 8, the linear range obtained by considering the absorbance changes versus different concentrations of ABTS is shown. The R2 coefficient for the linear range is close to 1 (R2 = 0.975), indicating good accuracy of the fabricated sensor in a concentration range varying from 57 to 171 µM.
Figure 8. The linear range for an LTCC sensor exploiting the changes in absorbance due to solutions with different concentrations of ABTS (measurement conditions: flow rate = 25 µL/min, LED current: 15 mA) (reprinted with permission from Ref. [58]).
An innovative optical biosensor for determining the catechol concentration has recently been presented by Cano-Raya et al. [59]. Laccase from Trametes versicolor is bonded to anionic polyamide 6 (PA6) porous microparticles integrated into a Pebax MH1657 polymer binder that includes MBTH that gives a colored product when it interacts with the o-benzoquinone produced by the enzymatic reaction of catechol. The catechol concentration was determined by evaluating the changes in absorbance at 500 nm. In Figure 9, the calibration plot obtained for the developed biosensor is reported, and an LOD equal to 11 µM and a linear range up to 118 µM have been obtained.
Figure 9. Calibration plot for catechol concentration determination. In the inset, the linear range is shown (reprinted with permission from Ref. [59] under open access conditions).
The sensor was also tested using water samples from rivers and springs spiked with different concentrations of catechol, and it shows a recovery rate varying in the 97–108% interval.
Sorrentino et al. [60] developed an innovative optical biosensor using a laccase-based chimeric protein. Laccase from Pleurotus ostreatus was combined with hydrophobin layers to improve the immobilization efficiency of laccase. The chimeric protein was immobilized into multi-well plates without any purification step and used for monitoring two phenolic compounds: L-DOPA, which is a relevant compound in the pharmaceutical field; and caffeic acid, which is present in food [60]. The calibration curves for these two compounds have been constructed using changes in the absorption at 420 nm using ABTS as a substrate and the analytes as competing inhibitors in the ABTS oxidation due to laccase in indirect assays. 
The biosensor was also challenged with spiked real samples: L-DOPA in plasma samples and caffeic acid in different beverages, such as tea and fruit juices. In both cases, high efficiency in analyte quantification was obtained [60].
(b)
Sensors based on fluorescence spectroscopy
The first attempt to exploit the fluorescence properties of laccase has been ascribed to Papkovsky et al. [61] in 1993. They aimed to investigate the performance of a solid-state fiber-optic oxygen sensor and design a new approach to enzymatic sensing using flow-injection analysis. The authors developed a simple and robust laccase-based sensing system that is useful for practical applications. In Figure 10, the scheme of the Papkovsky’s enzyme sensor is reported. The sensor was used for determining the concentration of different phenolic substances (Hydroquinone, phenol, 4-chlorophenol, 2,3-dichlorophenol, and 2,3,4-trichlorophenol) and real commercially available samples (Lipton “Yellow Label” tea (UK), Duncans “Double Diamond Leaf Tea” (India), Yun Nan black tea (China), “C.T.C”. granulated tea (India), and Caykur Rize tea (Turkey)). The Papkovsky et al. paper [61] reported the calibration curve for catechol and the quantitation of the polyphenol content in the different above-mentioned teas.
Figure 10. Schematic drawing of Papkovsky’s enzyme sensor. Modified from Ref. [61].
Andreu-Navarro et al. [62] developed a significant approach for the optical detection and quantification of different polyphenol compounds (catechol, gallic acid, hydroquinone, hydroxyhydroquinone, phloroglucinol, pyrogallol, and resorcinol) that can be present in beverages. The described biosensor takes advantage of the inhibition of the green indocyanine fluorescence induced by polyphenols in the presence of laccase and gold nanoparticles with positive charges. Laccase fluorescence rapidly decreases when the fluorophore is added. The decrease can be ascribed to the catalytic effect of the enzyme on fluorophore oxidation. The fluorescence decrease effect is slower proportionally to the concentration of the present polyphenols.
Figure 11 shows the experimental apparatus used, which includes a device for the rapid mixing of reagents. A solution of laccase and gold nanoparticles was placed in one of the syringes; in a second syringe, the sample was placed in a solution with indocyanine green. A third syringe was used for flow control. The fluorescence was excited at 764 nm and is collected at 806 nm using a spectrofluorometer, which allows us to follow the time course of the fluorescence on the time scale of seconds. The spectrofluorometer software used for the treatment of kinetic measurements was adopted for acquiring and processing data. To quantitatively determine the analyte, the authors used the difference in the necessary time to observe a decrease in the fluorescence signal in the presence and absence of the analyte, as shown in Figure 12. In this figure, the slope of the curve obtained in the presence and the absence of the polyphenol has practically the same value, indicating that the oxidation kinetics do not influence each other. The present biosensor allowed catechol to have an LOD of 0.01 mM and a linear range of 0.08–5 mM and has been used for the determination of the concentration of polyphenols in beverages such as tea and fruit juices.
Figure 11. Schematic of the instrumental system: S1 and S2, driving syringes containing laccase + AuNPs and indocyanine green + polyphenolic compound, respectively; S3, stopping syringe; FD, spectrofluorometer; C, observation cell; T, thermostat; PC, computer (reprinted with permission from Ref. [62]).
Figure 12. Kinetic curves have been acquired for the laccase–indocyanine green system alone (1) and in the presence of AuNPs (2), gallic acid (3) and AuNPs + gallic acid (4). [laccase] = 0.1 U mL−1, [indocyanine green] = 5.2 µmol L−1, [gallic acid] = 2 µmol L−1, temperature = 20 °C, pH 7.5 and [Tris] = 25 mmol L−1 (reprinted with permission from Ref. [62]).
The proposed system suffers from the limit of enzyme consumption being higher compared to the normal technological use of enzymes, which provides for their immobilization; however, the consumption is limited. Furthermore, they use positively charged gold nanoparticles to modulate the timing of enzyme kinetics, by exploiting the nanoparticle’s ability to reduce enzyme activity.
Akshath et al. [63] proposed an optical biosensing scheme with a different use of the laccase enzyme. They exploited the conversion mechanism from polyphenols in mono/polyquinones induced by laccase for quenching CdTe quantum dot fluorescence. The resulting mono/polyquinones can quench quantum dot fluorescence as a result of broad spectral absorption due to multiple excitonic states resulting from quantum confinement effects and by a supposed charge transfer process from quinones to QDs. This process, illustrated in Figure 13, was used for detecting and quantifying polyphenols that can detect these analytes in the 1 ng/mL–100 mg/mL range with an LOD equal to 1 ng/mL. The authors observed that quenching of QDs fluorescence is linear with polyphenol concentration, so a differential quenching response provided sensitive “fingerprint” detection of individual polyphenols [63].
Figure 13. Sensing scheme for detection of polyphenols based on “turn-off” photoluminescence using enzyme immobilized CdTe QDs (reproduced with permission from Ref. [63]).
The developed sensor has been also applied to real samples obtained by a water solution of plant extract spiked with various polyphenols. The added quantities have been recovered in a very efficient way, as shown in Table 2 of Ref. [37]. The authors also demonstrated that there are no interference effects due to metal ions like aluminum, copper, zinc, iron, etc., which can be present in small quantities in plant extracts.
Recently, Mediavilla et al. [64] developed a fluorescence-based assay for evaluating the total polyphenol concentration in beverages using laccase from Trametes versicolor and carbon nanodots (CD). Using this bioconjugate, it was possible to monitor the enzymatic reaction thanks to the decrease in fluorescence signal due to the quinone quenching effect. This method has been successfully applied for the determination of the total concentration of polyphenols (represented as gallic acid concentration) in wine, fruit juice, and rice leaf extract spiked samples.
Another fiber-optic-based laccase biosensor for polyphenolic compound detection has been developed by Bilir et al. [65]. They used laccase from Pleorotus ostreatus that was immobilized on the surface of a commercially available fiber optic oxygen sensor. Tetramethyl orthosilicate (TMOS), trimethoxymethylsilane (Tri-MOS), and polyvinyl alcohol (PVA) were added to the immobilized laccase region as a diffusion layer. In Figure 14, the sensing mechanism is shown.
Figure 14. Sensing scheme of the oxygen-detection-based optic system (reproduced from Ref. [65] under open access conditions).
The detection mechanism exploits the luminescence emission from oxygen-sensitive dyes contained in sensing spots. After excitation, the interaction between the luminescent dyes and an oxygen molecule causes the transfer of the excess energy to that molecule, exploiting a dynamic quenching process (Figure 14). The light emission intensity from sensing spots and the average excitation lifetime decreased. The excitation lifetime and oxygen concentration are related by the Stern–Volmer relationship, and the phase modulation technique is applied for precise measurements [66]. The sensor spot is excited with sinusoidally modulated light, and the emitted light is also sinusoidally modulated. The average excitation lifetime is then detected as the phase angle between these two optical signals. The measurements are carried out in a flow-through system.
The Bilir et al. [65] biosensor is characterized by a large linear range for catechol (40–600 μM), as shown in Figure 15. The other working parameters are reported in Table 3. In agreement with the authors, the designed biosensor can be easily produced and is reproducible and stable. The authors propose its use in the food industry as well as in environmental monitoring for the detection of phenolic compounds.
Figure 15. Calibration curve for catechol (reproduced from Ref. [65] under open access conditions).

References

  1. Messerschmidt, A. Special structure of ascorbate oxidase, laccase and related proteins implication for catalytic mechanism. In Multicopper Oxidase; Messerschmidt, A., Ed.; World Scientific Publishing: Singapore, 1997; pp. 23–80.
  2. Wang, Y.; Wu, N.; Chen, Z.-H. Insight of the optical property of laccase during polymerics formation for application in real-time biosensing. J. Mater. Sci. 2021, 56, 14368–14380.
  3. Riva, S. Laccases: Blue Enzymes for Green Chemistry. Trends Biotechnol. 2006, 24, 219–226.
  4. Claus, H. Laccases: Structure, Reactions, Distribution. Micron 2004, 35, 93–96.
  5. Dennison, C. Investigating the Structure and Function of Cupredoxins. Coord. Chem. Rev. 2005, 249, 3025–3054.
  6. Lallawmsanga; Leo, V.V.; Passari, A.K.; Muniraj, I.K.; Uthandi, S.; Hashem, A.; Abd Allah, E.F.; Alqarawi, A.A.; Singh, B.P. Elevated levels of laccase synthesis by Pleurotus pulmonarius BPSM10 and its potential as a dye decolorizing agent. Saudi J. Biol. Sci. 2019, 26, 464–468.
  7. Palmieri, G.; Giardina, P.; Bianco, C.; Scaloni, A.; Capasso, A.; Sannia, G. A Novel White Laccase from Pleurotus Ostreatus. J. Biol. Chem. 1997, 272, 31301–31307.
  8. Jiao, X.; Li, G.; Wang, Y.; Nie, F.; Cheng, X.; Abdullah, M.; Lin, Y.; Cai, Y. Systematic Analysis of the Pleurotus ostreatus Laccase Gene (PoLac) Family and Functional Characterization of PoLac2 Involved in the Degradation of Cotton-Straw Lignin. Molecules 2018, 23, 880.
  9. Leontievsky, A.A.; Vares, T.; Lankinen, P.; Shergill, J.K.; Pozdnyakova, N.N.; Myasoedova, N.M.; Kalkkinen, N.; Golovleva, L.A.; Cammack, R.; Thurston, C.F.; et al. Blue and Yellow Laccases of Ligninolytic Fungi. FEMS Microbiol. Lett. 2006, 156, 9–14.
  10. Navas, L.E.; Martínez, F.D.; Taverna, M.E.; Fetherolf, M.M.; Eltis, L.D.; Nicolau, V.; Estenoz, D.; Campos, E.; Benintende, G.B.; Berretta, M.F. A Thermostable Laccase from Thermus sp. 2.9 and Its Potential for Delignification of Eucalyptus Biomass. AMB Express 2019, 9, 24.
  11. Agrawal, K.; Verma, P. Multicopper Oxidase Laccases with Distinguished Spectral Properties: A New Outlook. Heliyon 2020, 6, e03972.
  12. Mot, A.C.; Coman, C.; Hadade, N.; Damian, G.; Silaghi-Dumitrescu, R.; Heering, H. “Yellow” Laccase from Sclerotinia sclerotiorum Is a Blue Laccase That Enhances Its Substrate Affinity by Forming a Reversible Tyrosyl-Product Adduct. PLoS ONE 2020, 15, e0225530.
  13. Leontievsky, A.; Myasoedova, N.; Pozdnyakova, N.; Golovleva, L. ‘Yellow’ Laccase of Panus Tigrinus Oxidizes Non-phenolic Substrates without Electron-transfer Mediators. FEBS Lett. 1997, 413, 446–448.
  14. Haibo, Z.; Yinglong, Z.; Feng, H.; Peiji, G.; Jiachuan, C. Purification and Characterization of a Thermostable Laccase with Unique Oxidative Characteristics from Trametes Hirsuta. Biotechnol. Lett. 2009, 31, 837–843.
  15. Zhang, L.B.; Deng, Z.Q.; Qiu, T.T.; Yang, W.W.J.; Zhu, F.; Ye, X.Y. Characterisation of a laccase isolated from Trametes hirsuta and its application in the oligomerisation of phenolic compounds. Fungal Biol. 2023, 127, 872–880.
  16. Zhao, D.; Cui, D.Z.; Mu, J.S.; Zhang, X.; Wang, Y.; Zhao, M. Induction of a White Laccase from the Deuteromycete Myrothecium Verrucaria NF-05 and Its Potential in Decolorization of Dyes. Biocatal. Biotransformation 2014, 32, 214–221.
  17. Sondhi, S.; Sharma, P.; George, N.; Chauhan, P.S.; Puri, N.; Gupta, N. An Extracellular Thermo-Alkali-Stable Laccase from Bacillus Tequilensis SN4, with a Potential to Biobleach Softwood Pulp. 3 Biotech 2015, 5, 175–185.
  18. Wang, S.-N.; Chen, Q.-J.; Zhu, M.-J.; Xue, F.-Y.; Li, W.-C.; Zhao, T.-J.; Li, G.-D.; Zhang, G.-Q. An Extracellular Yellow Laccase from White Rot Fungus Trametes sp. F1635 and Its Mediator Systems for Dye Decolorization. Biochimie 2018, 148, 46–54.
  19. Pozdnyakova, N.N.; Turkovskaya, O.V.; Yudina, E.N.; Rodakiewicz-Nowak, Y. Yellow Laccase from the Fungus Pleurotus Ostreatus D1: Purification and Characterization. Appl. Biochem. Microbiol. 2006, 42, 56–61.
  20. Shin, K.-S.; Lee, Y.-J. Purification and Characterization of a New Member of the Laccase Family from the White-Rot Basidiomycete Coriolus Hirsutus. Arch. Biochem. Biophys. 2000, 384, 109–115.
  21. Revina, A.A.; Khaikin, G.I.; Protasova, E.L.; Mezentseva, N.B.; Stepanova, E.V.; Skorobogat’ko, O.V. Oxygen Effects in Aqueous Solutions of Laccases: Absorption Spectra and Reactivity. Russ. Chem. Bull. 2000, 49, 1464–1467.
  22. Shleev, S.V.; Morozova, O.V.; Nikitina, O.V.; Gorshina, E.S.; Rusinova, T.V.; Serezhenkov, V.A.; Burbaev, D.S.; Gazaryan, I.G.; Yaropolov, A.I. Comparison of Physico-Chemical Characteristics of Four Laccases from Different Basidiomycetes. Biochimie 2004, 86, 693–703.
  23. Delfino, I.; Viola, D.; Cerullo, G.; Lepore, M. Ultrafast Excited-State Charge-Transfer Dynamics in Laccase Type I Copper Site. Biophys. Chem. 2015, 200–201, 41–47.
  24. Goldberg, M.; Pecht, I. Fluorescence Enhancement of Laccase Induced by Reduction of Cu(II) Sites. Proc. Nat. Acad. Sci. USA 1974, 71, 4684–4687.
  25. Wynn, R.M.; Sarkar, H.K.; Holwerda, R.A.; Knaff, D.B. Fluorescence Associated with the Type 3 Copper Center of Laccase. FEBS Lett. 1983, 156, 23–28.
  26. Moţ, A.C.; Pârvu, M.; Damian, G.; Irimie, F.D.; Darula, Z.; Medzihradszky, K.F.; Brem, B.; Silaghi-Dumitrescu, R. A “Yellow” Laccase with “Blue” Spectroscopic Features, from Sclerotinia Sclerotiorum. Process Biochem. 2012, 47, 968–975.
  27. Saoudi, O.; Ghaouar, N.; Othman, T. Fluorescence study of laccase from Trametes versicolor under the effects of pH, chemical denaturants and ionic liquids. J. Mol. Liq. 2017, 225, 56–63.
  28. Susi, H.; Byler, D.M. Resolution-Enhanced Fourier Transform Infrared Spectroscopy of Enzymes. Methods Enzymol. 1986, 130, 290–311.
  29. Yang, H.; Yang, S.; Kong, J.; Dong, A.; Yu, S. Obtaining Information about Protein Secondary Structures in Aqueous Solution Using Fourier Transform IR Spectroscopy. Nat. Protoc. 2015, 10, 382–396.
  30. Baker, M.J.; Trevisan, J.; Bassan, P.; Bhargava, R.; Butler, H.J.; Dorling, K.M.; Fielden, P.R.; Fogarty, S.W.; Fullwood, N.J.; Heys, K.A.; et al. Using Fourier Transform IR Spectroscopy to Analyze Biological Materials. Nat. Protoc. 2014, 9, 1771–1791.
  31. Errico, S.; Moggio, M.; Diano, N.; Portaccio, M.; Lepore, M. Different experimental approaches for Fourier-transform infrared spectroscopy applications in biology and biotechnology: A selected choice of representative results. Biotechnol. Appl. Biochem. 2023, 70, 937–961.
  32. Ragusa, S.; Cambria, M.T.; Pierfederici, F.; Scirè, A.; Bertoli, E.; Tanfani, F.; Cambria, A. Structure–Activity Relationship on Fungal Laccase from Rigidoporus Lignosus: A Fourier-Transform Infrared Spectroscopic Study. Biochim. Biophys. Acta (BBA)-Proteins Proteom. 2002, 1601, 155–162.
  33. Portaccio, M.; Della Ventura, B.; Mita, D.G.; Manolova, N.; Stoilova, O.; Rashkov, I.; Lepore, M. FT-IR Microscopy Characterization of Sol–Gel Layers Prior and after Glucose Oxidase Immobilization for Biosensing Applications. J. Solgel Sci. Technol. 2011, 57, 204–211.
  34. Samui, A.; Sahu, S.K. One-Pot Synthesis of Microporous Nanoscale Metal Organic Frameworks Conjugated with Laccase as a Promising Biocatalyst. New J. Chem. 2018, 42, 4192–4200.
  35. Almeida, L.C.; Correia, R.D.; Marta, A.; Squillaci, G.; Morana, A.; La Cara, F.; Correia, J.P.; Viana, A.S. Electrosynthesis of poly-dopamine films-tailored matrices for laccase-based biosensors. Appl. Surf. Sci. 2019, 480, 979–989.
  36. Perna, V.; Baum, A.; Ernst, H.A.; Agger, J.W.; Meyer, A.S. Laccase activity measurement by FTIR spectral fingerprinting. Enzym. Microb. Technol. 2019, 122, 64–73.
  37. Cantarella, G.; d’Acunzo, F.; Galli, C. Determination of Laccase Activity in Mixed Solvents: Comparison between Two Chromogens in a Spectrophotometric Assay. Biotechnol. Bioeng. 2003, 82, 395–398.
  38. Zuyun, H.; Houping, H.; Ruxiu, C.; Yun’e, Z. Organic Solvent Enhanced Spectrofluorimetric Method for Determination of Laccase Activity. Anal. Chim. Acta 1998, 374, 99–103.
  39. Sun, X.; Bai, R.; Zhang, Y.; Wang, Q.; Fan, X.; Yuan, J.; Cui, L.; Wang, P. Laccase-Catalyzed Oxidative Polymerization of Phenolic Compounds. Appl. Biochem. Biotechnol. 2013, 171, 1673–1680.
  40. Huang, J.; Fang, H.; Liu, C.; Gu, E.; Jiang, D. A Novel Fiber Optic Biosensor for the Determination of Adrenaline Based on Immobilized Laccase Catalysis. Anal. Lett. 2008, 41, 1430–1442.
  41. Navarro, J.; Galban, J.; de Marcos, S. A label-free platform for dopamine biosensing. Bioanalysis 2018, 10, 11–21.
  42. Baluta, S.; Zając, D.; Szyszka, A.; Malecha, K.; Cabaj, J. Enzymatic Platforms for Sensitive Neurotransmitter Detection. Sensors 2020, 20, 423.
  43. Sangubotla, R.; Kim, J. Fiber-optic biosensor based on the laccase immobilization on silica-functionalized fluorescent carbon dots for the detection of dopamine and multi-color imaging applications in neuroblastoma cells. Mater. Sci. Eng. C 2021, 122, 111916.
  44. Pimpilova, M.; Kamarska, K.; Dimcheva, N. Biosensing Dopamine and L-Epinephrine with Laccase (Trametes pubescens) Immobilized on a Gold Modified Electrode. Biosensors 2022, 12, 719.
  45. Castañeda-Arriaga, R.; Pérez-González, A.; Reina, M.; Alvarez-Idaboy, J.R.; Galano, A. Comprehensive Investigation of the Antioxidant and Pro-Oxidant Effects of Phenolic Compounds: A Double-Edged Sword in the Context of Oxidative Stress? J. Phys. Chem. B 2018, 122, 6198–6214.
  46. Rodríguez-Delgado, M.M.; Alemán-Nava, G.S.; Rodríguez-Delgado, J.M.; Dieck-Assad, G.; Martínez-Chapa, S.O.; Barceló, D.; Parra, R. Laccase-Based Biosensors for Detection of Phenolic Compounds. TrAC Trends Anal. Chem. 2015, 74, 21–45.
  47. Simkus, R.A.; Laurinavicius, V.; Boguslavsky, L.; Skotheim, T.; Tanenbaum, S.W.; Nakas, J.P.; Slomczynski, D.J. Laccase Containing Sol-Gel Based Optical Biosensors. Anal. Lett. 1996, 29, 1907–1919.
  48. Gupta, R.; Chaudhury, N.K. Entrapment of Biomolecules in Sol–Gel Matrix for Applications in Biosensors: Problems and Future Prospects. Biosens. Bioelectron. 2007, 22, 2387–2399.
  49. Klein, L.; Aparicio, M.; Jitianu, A. (Eds.) Handbook of Sol-Gel Science and Technology; Springer International Publishing: Cham, Switzerland, 2018.
  50. Figueira, R.B.; de Sorrentino, J.M.; Ferreira, B.; Coelho, L.; Silva, C.J.R. Optical Fiber Sensors Based on Sol–Gel Materials: Design, Fabrication and Application in Concrete Structures. Mater. Adv. 2021, 2, 7237–7276.
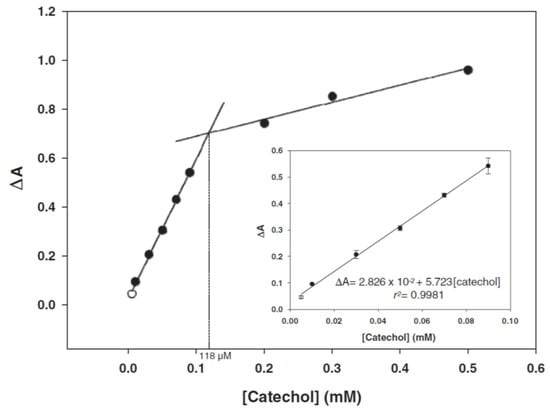
  51. Abdullah, J.; Ahmad, M.; Heng, L.; Karuppiah, N.; Sidek, H. An Optical Biosensor Based on Immobilization of Laccase and MBTH in Stacked Films for the Detection of Catechol. Sensors 2007, 7, 2238–2250.
  52. Karweik, D.H. Quantitative Analysis, 4th Edition (Day, R.A.; Underwood, A.L.). J. Chem. Educ. 1982, 59, A105.
  53. Navas Díaz, A.; Ramos Peinado, M.C.; Torijas Minguez, M.C. Sol–Gel Horseradish Peroxidase Biosensor for Hydrogen Peroxide Detection by Chemiluminescence. Anal. Chim. Acta 1998, 363, 221–227.
  54. Xu, F. Oxidation of Phenols, Anilines, and Benzenethiols by Fungal Laccases: Correlation between Activity and Redox Potentials as Well as Halide Inhibition. Biochemistry 1996, 35, 7608–7614.
  55. Delfino, I.; Portaccio, M.; Della Ventura, B.; Manzo, G.; Mita, D.G.; Lepore, M. Optical Properties of Sol-Gel Immobilized Laccase: A First Step for Its Use in Optical Biosensing; Berghmans, F., Mignani, A.G., De Moor, P., Eds.; SPIE: Bellingham, WA, USA, 2012; p. 84391X.
  56. Lepore, M.; Portaccio, M. Optical Detection of Different Phenolic Compounds by Means of a Novel Biosensor Based on Sol–Gel Immobilized Laccase. Biotechnol. Appl. Biochem. 2017, 64, 782–792.
  57. Sanz, J.; de Marcos, S.; Galbán, J. Autoindicating Optical Properties of Laccase as the Base of an Optical Biosensor Film for Phenol Determination. Anal. Bioanal. Chem. 2012, 404, 351–359.
  58. Jędrychowska, A.; Malecha, K.; Cabaj, J.; Sołoducho, J. Laccase Biosensor Based on Low Temperature Co-Fired Ceramics for the Permanent Monitoring of Water Solutions. Electrochim. Acta 2015, 165, 372–382.
  59. Cano-Raya, C.; Dencheva, N.V.; Braz, J.F.; Malfois, M.; Denchev, Z.Z. Optical Biosensor for Catechol Determination Based on Laccase-immobilized Anionic Polyamide 6 Microparticles. J. Appl. Polym. Sci. 2020, 137, 49131.
  60. Sorrentino, I.; Giardina, P.; Piscitelli, A. Development of a Biosensing Platform Based on a Laccase-Hydrophobin Chimera. Appl. Microbiol. Biotechnol. 2019, 103, 3061–3071.
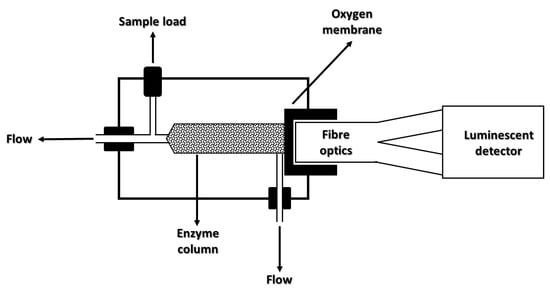
  61. Papkovsky, D.B.; Ghindilis, A.L.; Kurochkin, I.N. Flow-Cell Fibre-Optic Enzyme Sensor for Phenols. Anal. Lett. 1993, 26, 1505–1518.
  62. Andreu-Navarro, A.; Fernández-Romero, J.M.; Gómez-Hens, A. Determination of Polyphenolic Content in Beverages Using Laccase, Gold Nanoparticles and Long Wavelength Fluorimetry. Anal. Chim. Acta 2012, 713, 1–6.
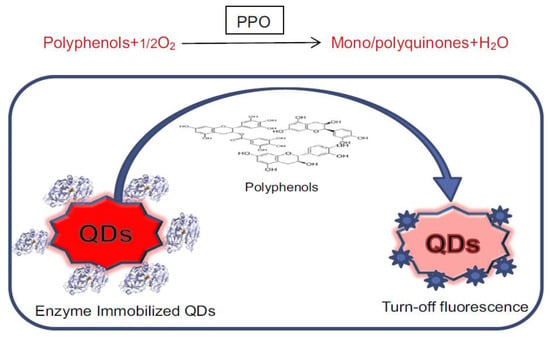
  63. Akshath, U.S.; Shubha, L.R.; Bhatt, P.; Thakur, M.S. Quantum Dots as Optical Labels for Ultrasensitive Detection of Polyphenols. Biosens. Bioelectron. 2014, 57, 317–323.
  64. Mediavilla, M.; Revenga-Parra, M.; Gutierrez-Sanchez, C.; Hernandez-Apaolaza, L.; Pariente, F.; Lorenzo, E. Fluorescent enzymatic assay for direct total polyphenol determination in food-related samples. Talanta 2022, 247, 123576.
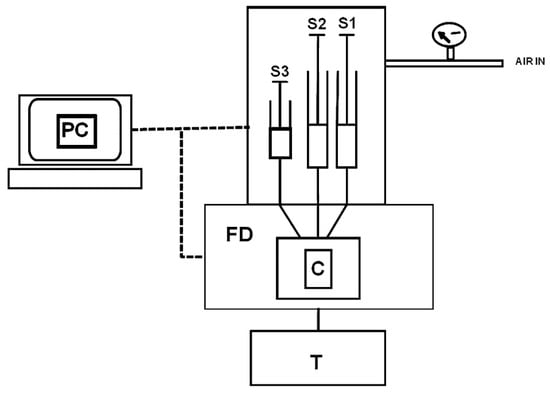
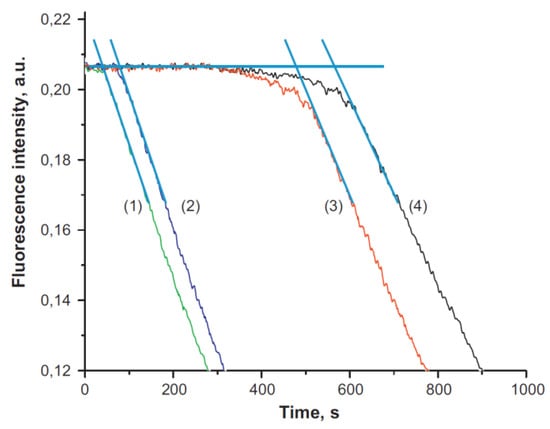
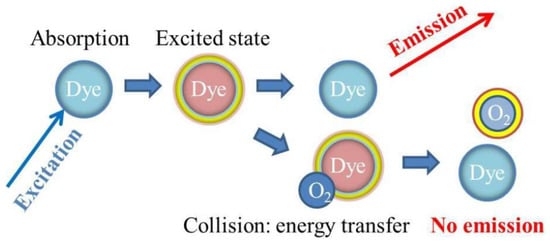
  65. Bilir, K.; Weil, M.-T.; Lochead, J.; Kök, F.N.; Werner, T. Construction of an Oxygen Detection-Based Optic Laccase Biosensor for Polyphenolic Compound Detection. Turk. J. Biol. 2016, 40, 1303–1310.
  66. Lakowicz, J.R.; Weber, G. Quenching of Fluorescence by Oxygen. Probe for Structural Fluctuations in Macromolecules. Biochemistry 1973, 12, 4161–4170.
More
Video Production Service