Direct injection mass spectrometry (DIMS) entails the direct introduction of a gaseous sample into a mass analyser without prior treatment or separation. DIMS techniques offer the opportunity to monitor processes in time, with limits of detection as low as 0.5 parts per trillion in volume (for a 1 s measurement time) while providing results with high informational content. hanks to its unique characteristics, DIMS allows the online monitoring of volatile organic compounds (VOCs) released by grapes during fermentative bioprocesses or by wine directly from the glass headspace or during drinking. A DIMS-based approach can also be adopted to perform quality control and high-throughput analysis, allowing us to characterise the volatile profile of large sample sets rapidly and in a comprehensive fashion.
- direct injection mass spectrometry
- wine
- grape
- ethanol
1. Introduction
- (1)
-
Primary ion generation: air, a synthetic gas mixture or a solution are submitted to an electric discharge, microwaves or radiations, which in turn generates a beam or plume of reagent ions.
- (2)
-
Ion-molecule reaction: primary ions travel through a drift region where they react with neutral volatile organic compounds (VOCs) contained in the sample. Ionisation proceeds according to one or more mechanisms (e.g., proton transfer, electron capture or hydride abstraction), leading to the formation of product ions.
- (3)
-
Analysis: product ions generated during step 2 are further analysed by means of a mass spectrometer.
| Technique | Primary Ion Generation |
Ion-Molecule Reaction | Analysis | Ref. |
|---|---|---|---|---|
| Proton Transfer Reaction—Mass Spectrometry (PTR-MS) | Hollow cathode discharge or α particles | Takes place in drift tube. Ionisation energy depends on electrical field | Quadrupole mass spectrometer: unit mass resolution; isobar and isomer discrimination are not possible | [1] |
| Proton Transfer Reaction—Time of Flight (PTR-TOF) | Hollow cathode discharge | Takes place in drift tube. Ionisation energy depends on electrical field | Time-of-flight mass spectrometer: accurate mass of analyte ions is determined. Isobar discrimination is possible, isomer discrimination is not possible | [1] |
| Selected Ion Flow Tube—Mass Spectrometry (SIFT-MS) | Microwave discharge source with quadrupole mass filter | Takes place within flow tube. Product ions transported to mass analyser by means of He/N2 flow | Quadrupole mass spectrometer | [2] |
| Atmospheric Pressure Chemical Ionisation—Mass Spectrometry (APCI-MS) | Corona discharge | The sample enters the source through a venturi inlet, sheathed with a second tube, flushed with a constant flow of nitrogen | Performance depends on mass spectrometer. Most APCI sources are coupled to quadrupole MS | [3] |
| VOCUS—Chemical Ionisation—Mass Spectrometry (VOCUS-CI-MS) | Discharge reagent ion source | Ion-molecule reactor, consisting of a glass tube with resistive heating, mounted inside a radio frequency quadrupole | Time-of-flight mass spectrometer | [4] |
| Secondary Electrospray Ionisation—Mass Spectrometry (SESI-MS) | Nano-electrospray ion source | The reagent ions are mixed with the gas carrying the analytes of interest, the charge is then transferred to the analytes | Performance depends on mass spectrometer. Most SESI sources are coupled to Orbitrap MS, which provides accurate mass of analyte ions | [5] |
2. DIMS Analysis of Ethanolic Systems
A key prerequisite to all DIMS techniques is for the primary ion (in most cases H3O+) to be largely in excess with respect to the analytes. When ethanol is present at concentrations of at least 2–4% (v/v) within the sample [12[6][7],13], or at least 100 ppmV (parts per million, in volume) within the headspace [14][8], standard primary ions are nearly entirely depleted, whereas protonated ethanol (m/z 47), along with other products of ethanol chemistry, act as primary ions. These conditions, which are typically encountered in the DIMS headspace analysis of wine and other alcoholic beverages, result in the following drawbacks:- (1)
-
Since ethanol has a proton affinity (PA) of 776 kJ mol−1, which is considerably higher than that of water (PA = 691 kJ mol−1), molecules with a PA comprised within that of water and ethanol (e.g., acetaldehyde PA = 710 kJ mol−1), can no longer be protonated and are, therefore, not detectable.
- (2)
-
Reaction kinetics are more complex because multiple species—each having its own reaction constant and proton affinity—may act as the primary ion. Therefore, mass spectral data are more challenging to interpret. For instance, in the case of PTR-MS analysis conducted under standard conditions ([15][9] and Figure 21), abundant ions may include protonated ethanol (m/z 47) water/ethanol clusters (m/z 65), ethanol dimers and trimers (m/z 93 and 139) and several dehydration products (m/z 29, 75 and 121).
- (3)
-
Since the amount and type of ethanol-derived ions will depend on how much ethanol is in the headspace, the sample alcohol content will affect the analytical response and sample discrimination may occur mainly based on sample ethanol content.
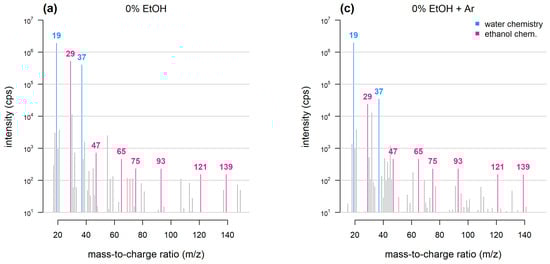
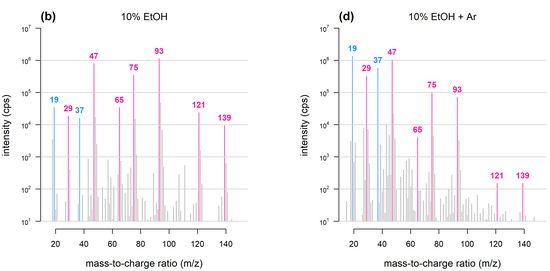 Figure 21. Mass spectra obtained with PTR-TOF. Samples consist of dry air bubbled through water or 10% ethanol (adapted from [16][10]). Under conventional PTR-TOF chemistry (a) and when 10% ethanol is added (b), ethanol-related peaks dominate the mass spectrum and deplete water-related peaks. Argon as buffer gas (c,d) reduces the intensity of ethanol dimers, trimers and ethanol-water cluster peaks and prevents hydronium ion depletion.Over the last two decades, several approaches have been adopted to obviate these problems:
- (1)
-
Ethanol saturation: this can be achieved by diluting sample headspace in ethanol-saturated nitrogen when using PTR-MS [14][8] or by adding ethanol to the makeup gas in APCI-MS [12][6]. This creates conditions whereby ethanol completely replaces water in driving primary ion generation, and sample ethanol content does not affect results. However, ionisation chemistry remains complex and spectral interpretation is difficult.
- (2)
-
Sample dilution: this can be carried out either by diluting the sample headspace in a stream of nitrogen [17][11] or by adding water directly to the sample prior to analysis [18][12]. The reduction of ethanol concentration in the sample headspace allows the re-establishment of standard ionisation conditions at the expense of sensitivity.
- (3)
-
Argon as buffer gas: PTR-TOF analysis of wine has been carried out by introducing argon into the drift tube either directly or through the sample inlet [16][10]: this results in a reduction in the proportion of ethanol dimers and clusters (Figure 21). The argon-based approach exploits a previously described effect whereby when air or nitrogen are replaced with a buffer gas having a larger molecular mass (i.e., argon), the internal energy of the reactive species is affected, shifting overall reactivity towards dissociation [19][13].
- (4)
-
High E/N: the ‘reduced drift field’ (or E/N) is a measure of the energy delivered in ion-molecule collisions. In PTR-MS, E/N is typically 120–150 Td (1 Td = 10−17 V·cm2). The hydronium ion pool, which is normally depleted measuring ethanolic systems, when operating at conditions of E/N ≥ 250 [20][14] is replenished thanks to the dissociation of protonated ethanol. On the other hand, high E/N results in high fragmentation and mass spectral data with low informational content.
- (5)
-
FastGC-PTR-TOF: a hyphenated system has been reported, coupling PTR-TOF with a short (3.5 m), resistively heated capillary column [21][15]. FastGC allows to perform a quick (90 s) chromatographic separation prior to analysis: if the first eight seconds of the analysis—during which ethanol is eluted—are discarded, wine headspace analysis can be carried out under conventional PTR-TOF conditions, with the extra benefit of isomer separation.
3. Grape Analysis
DIMS techniques have been applied to grape analysis, effectively addressing oenologically relevant questions and providing information on the quality of raw material.SIFT-MS has been used to discriminate 23 white and red grape varieties [22][16]. Key compound classes for discrimination were short-chain alcohols and aldehydes, phenols, monoterpenols and C13-norisoprenoids.The DIMS approach can also be used to measure the headspace of intact berries throughout the ripening process, thus providing useful indicators of ‘aromatic’ maturity to be used to complement more classic measurements, such as total acidity and sugar content. When SIFT-MS or SESI-MS were used to monitor the ripening of different grape varieties, most mass peaks showed a downward trend, possibly indicative of the fact that volatile compounds are being progressively converted into non-volatile aroma precursors [23,24][17][18].A particular case of the winemaking process is represented by the production of the so-called ‘passito’ wines, whereby grapes undergo withering under controlled conditions. During this process, grapes experience progressive dehydration, accompanied by the development of a typical microflora (i.e., ‘noble rot’). The grape withering characteristic of the production of ‘Amarone’ wine (typical of the Valpolicella region in Italy) has been monitored using PTR-MS [25][19]. VOC release kinetics allowed us to highlight key processes such as the decline of grape metabolism during dehydration and the release of compounds specific to noble rot (octen-3-one and octen-3-ol).4. Fermentation Monitoring
Alcoholic fermentation (AF) is a process common to all alcoholic beverages. A straightforward AF helps afford a microbially and chemically stable beverage [26][20], but AF also affects the aroma profile [27][21]. AF, especially if conducted with industrial starters, takes place in a reasonably short time span, ranging from a few days to a couple of weeks. Therefore, the process lends itself well to online monitoring using DIMS. The selection of suitable yeast starter strains is a paramount step for every type of alcoholic beverage. PTR-TOF has been employed to monitor VOC production during growth in a synthetic medium by different Saccharomyces cerevisiae strains, including two laboratory strains and four wine isolates [28][22]. The two lab S. cerevisiae had an identical genetic makeup with the exception of a single frameshift mutation, affecting amino acid transport. This resulted in measurable differences in the production of higher alcohols (3-methyl-1-butanol, 2-methyl-1-butanol), short-chain fatty acids (isovaleric acid, 2-methylbutanoic acid) and mercaptans (methanethiol). DIMS has been employed to study the alcoholic fermentation of mead (i.e., an alcoholic beverage produced from diluted honey). The work [29][23] compares PTR-MS with Fourier-Transform Infrared (FTIR) spectroscopy and HPLC. Whereas FTIR allows for online process monitoring, HPLC requires offline sampling and analysis and has limited throughput. PTR-MS represents a valuable compromise between the previously mentioned techniques: in fact, it allows for non-invasive monitoring of fermentation kinetics in real time, at the same time providing information on the production or consumption of key metabolites and aroma compounds, such as ethanol, acetaldehyde, acetic acid and esters. PTR-TOF has been used as an AF online monitoring tool in experimental brewing to investigate the impact of different yeasts and hops and their combination [30][24]. The results highlighted complex interaction between factors, with hops affecting aroma profile directly, but also indirectly affected by yeast growth and metabolism. An approach similar to that applied for brewing has been adopted using PTR-TOF to study fermentation and aroma production kinetics during experimental winemaking [33][25], with AF being carried out using different microbial strains (S. cerevisiae, Metschnikowia pulcherrima and Torulaspora delbrueckii either alone or in combination) in either fresh must or commercial grape juice. In consideration of the different applications, the interest in DIMS techniques to explore the ‘space’ of interactions between the chemistry of the must/wine and the pro-technological microorganisms is evident, as well as in exploring the different interactions between microorganisms of oenological interest (Saccharomyces and non-Saccharomyces yeasts and malolactic bacteria) that can be inoculated with diverse timing.5. Static and Dynamic Headspace Analysis of Model Ethanolic Systems
During drinking, the first olfactory interaction with the product occurs when aroma compounds reach the nasal epithelium directly through the nose: the process gives rise to the so-called orthonasal perception. The accurate measurement of the composition of the above-the-glass headspace is key to understanding the chemical mechanisms underlying appreciation. In alcoholic beverages, ethanol may affect the air-to-liquid partitioning of aroma compounds in different ways. APCI-MS was used to characterise the headspace composition of water and ethanol/water model systems, showing that in conditions of static equilibrium [12][6], ethanol reduces headspace VOC concentration: headspace analysis of water or 12% ethanolic solutions containing different VOCs showed a decrease of up to 42% in headspace concentration for the ethanolic system. The impact of ethanol addition on headspace concentration varies as a function of the compound hydrophobicity, as determined by the log p value. A major advantage of the DIMS approach is the possibility of directly performing dynamic measurements, which are more representative of real-life/real-system situations. When APCI-MS was used for dynamic headspace measurements in water and in 12% ethanol solutions [35[26][27],36], the resulting VOC profiles started with a sharp decrease in measured concentrations, followed by dynamic equilibrium. In ethanolic solutions, VOC concentrations in dynamic equilibrium conditions were generally higher than in water alone; therefore, in such conditions, ethanol helps maintain the compound concentration in the headspace constant and reduces headspace dilution. The magnitude of this effect, which was somewhat affected by the air-to-liquid partitioning coefficient of the target compound, is likely related to the surface-active properties of ethanol. In fact, ethanol evaporation might create local areas of higher evaporation and surface tension, recalling liquid from areas with lower evaporation. The resulting convection phenomenon constantly recalls fresh solution towards the surface, thus helping to keep a constant headspace concentration for most VOCs. In alcoholic beverages, molecules other than ethanol can also contribute to matrix effects: APCI-MS has been used to study their behaviour. Volatile release has been investigated in model solutions containing odour-active esters and heterocyclic compounds typical of whisky aroma [38][28]. Ethyl-hexadecanoate, used as representative of long-chain ethyl esters typical of new-make whiskies, reduces aroma release at concentrations above its critical micelle concentration, especially in the case of hydrophobic compounds. This means that whisky dilution may affect perception by altering the balance between hydrophobic and hydrophilic compounds in the headspace, also depending on the content in long-chain ethyl esters. This is particularly relevant in describing real-life conditions, as whisky is often diluted with water to reduce pungency and improve aroma appreciation, both during professional tastings and for everyday consumption. Another field for the application of DIMS is the direct measurement of carbonated beverages, such as beer or sparkling wine. In such systems, the opening of the bottle creates rapidly evolving dynamic conditions. Therefore, static measurements may provide results which are not representative of the real conditions. When model beers with different compositions were measured using APCI-MS under static equilibrium conditions [40][29], no statistically significant effect of alcohol, hop acids or carbonation on aroma release was observed.6. Nosespace Analysis
After wine is swallowed, the opening of the epiglottis and the velum–pharynx barrier allows VOCs to travel from the mouth to the olfactory epithelium; in a later phase, VOCs released from liquid remainders adhering to the mouth and throat mucosal surfaces sustain perception over time. This mode of perception is labelled ‘retronasal’ and generally follows orthonasal perception. The possibility of employing DIMS to analyse ’in vivo’ aroma release was first explored by developing a dedicated APCI-MS source [42][30]. The technique, generally referred to as ‘nosespace’ analysis, is performed by connecting the instrument inlet to the assessor’s nose by means of a custom nosepiece. The results typically obtained consist of time-resolved release profiles (Figure 32); from these, some key metrics of particular significance can be extracted (e.g., ‘area’, ‘maximum’ or ‘t.max’) and used to provide an analytical determination capable of supporting the description of the evolution of perception over time.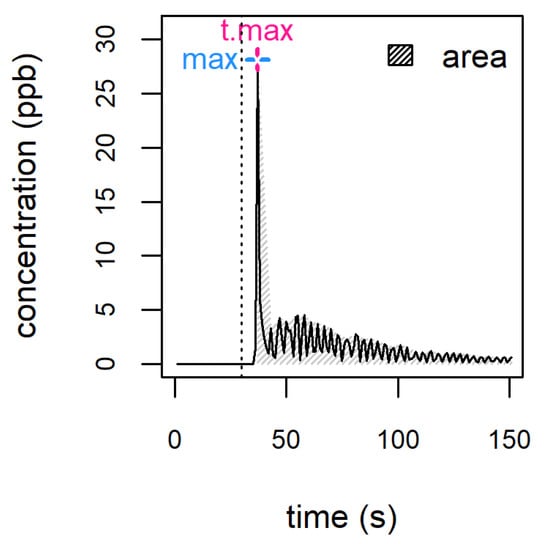 Figure 32. Example of a nosespace profile. Different metrics can be extracted from each profile, such as the area under the curve (area), the maximum intensity (max) and the time after which maximum intensity is reached (t.max). The vertical dotted line marks the moment of sample introduction.DIMS has been used to perform nosespace measurements on ethanolic model systems [40,43][29][31], as well as real alcoholic beverages, including wine [44][32], brandy [45][33], vodka [46][34] and palm wine [47][35].When APCI-MS nosespace measurements were performed on model systems mimicking VOC release in beer [40][29], the maximum and total area of release profiles were increased by both ethanol and CO2 addition. In fact, both compounds are surface-active and might increase release directly or by reducing VOC adhesion to mucosal surfaces. The effect of carbonation has also been observed in non-alcoholic beverages during PTR-MS measurements carried out in vivo [48][36] and using artificial mouths [49][37].
7. Headspace Analysis of Wine and Other Alcoholic Beverages
Whenever a new DIMS-based approach is developed for the analysis of ethanolic systems, wine discrimination has often been employed as a case study. Proof of concept for the PTR-MS ethanol saturation method was first obtained, discriminating commercial red and white wines from different regions and grape varieties [14][8]. PTR-MS, with the dilution method, was used in the separation of experimental wines obtained from Cabernet Sauvignon and Pinot Noir grapes harvested on different days and at different altitudes. The wine samples from the higher altitude sites and at later harvesting dates displayed higher signal intensities for a number of VOCs as compared to earlier harvested, lowland samples. The PTR-MS high E/N method was tested in the discrimination of eight French brandies from different producers with 2–6 years of ageing [58][38]. The authors compared results obtained at E/N = 145 and 454 Td. Samples were well separated in both instances, but discrimination took place according to different ions and when the same ions were present in both sets of conditions, they were not likely to come from the same compound. This is not unexpected, as with high E/N, PTR-MS reactivity is definitely shifted more towards dissociation; furthermore, under such conditions, mass spectral interpretation is difficult because multiple analytes may easily give rise to the same fragment. In the case of APCI-MS, application to real alcoholic beverages has been less frequent, with applications published on the targeted analysis of wort, commercial beer and cider samples [59][39] and palm wine [60][40]. PTR-TOF has instead been used more often, possibly due to its improved characteristics in terms of mass and time resolution, guaranteeing improved performance in untargeted analysis. PTR-TOF with argon as buffer gas has been employed in the separation of experimental wines resulting from malolactic fermentation (MLF) performed using three different Oenococcus oeni strains [16][10]. The main drawback when using argon was the reduction in sensitivity (sometimes as high as ten-fold) but the method allowed to preserve standard PTR-TOF chemistry even in the presence of high amounts of headspace ethanol.8. Quality Control
DIMS techniques have been used in quality control of ingredients, materials or finished products. For instance, SIFT-MS has been employed to detect methylamine contamination in agricultural ethanol [13][7] or to determine methanol content in beer, wine, gin and whisky [62][41]. Interestingly, the reactivity conditions observed when measuring ethanolic samples with SIFT-MS are close to those occurring in APCI-MS or PTR-MS under ethanol saturation conditions. VOCUS-CI-MS has been used in combination with a dedicated autosampler with the aim to quantify 2,4,6-Thrichloroanisole (TCA), the most widespread cork stopper contaminant [63][42]. This custom setup allowed the high-throughput analysis of TCA on intact cork stoppers with outstanding results: 5000 stoppers were analysed in a little over 4 h, whereas for a subset of these corks, a good correlation was observed with TCA concentrations obtained according to the ‘releasable TCA’ method [64][43].
References
- Ellis, A.M.; Mayhew, C.A. Proton Transfer Reaction Mass Spectrometry: Principles and Applications, 1st ed.; Wiley: Hoboken, NJ, USA, 2014; ISBN 978-1-4051-7668-2.
- Smith, D.; Španěl, P.; Demarais, N.; Langford, V.S.; McEwan, M.J. Recent Developments and Applications of Selected Ion Flow Tube Mass Spectrometry (SIFT-MS). Mass Spectrom. Rev. 2023, e21835.
- Le Quéré, J.; Gierczynski, I.; Sémon, E. An Atmospheric Pressure Chemical Ionization–Ion-trap Mass Spectrometer for the On-line Analysis of Volatile Compounds in Foods: A Tool for Linking Aroma Release to Aroma Perception. J. Mass Spectrom. 2014, 49, 918–928.
- Krechmer, J.; Lopez-Hilfiker, F.; Koss, A.; Hutterli, M.; Stoermer, C.; Deming, B.; Kimmel, J.; Warneke, C.; Holzinger, R.; Jayne, J.; et al. Evaluation of a New Reagent-Ion Source and Focusing Ion–Molecule Reactor for Use in Proton-Transfer-Reaction Mass Spectrometry. Anal. Chem. 2018, 90, 12011–12018.
- Blanco, F.G.; Vidal-de-Miguel, G. Breath Analysis by Secondary Electro-Spray Ionization—Mass Spectrometry to Interrogate Biologically Significant Metabolites Non-Invasively. Crit. Rev. Anal. Chem. 2023, 53, 825–837.
- Aznar, M.; Tsachaki, M.; Linforth, R.S.T.; Ferreira, V.; Taylor, A.J. Headspace Analysis of Volatile Organic Compounds from Ethanolic Systems by Direct APCI-MS. Int. J. Mass Spectrom. 2004, 239, 17–25.
- Dryahina, K.; Pehal, F.; Smith, D.; Španěl, P. Quantification of Methylamine in the Headspace of Ethanol of Agricultural Origin by Selected Ion Flow Tube Mass Spectrometry. Int. J. Mass Spectrom. 2009, 286, 1–6.
- Boscaini, E.; Mikoviny, T.; Wisthaler, A.; Von Hartungen, E.; Märk, T.D. Characterization of Wine with PTR-MS. Int. J. Mass Spectrom. 2004, 239, 215–219.
- Aprea, E.; Biasioli, F.; Märk, T.D.; Gasperi, F. PTR-MS Study of Esters in Water and Water/Ethanol Solutions: Fragmentation Patterns and Partition Coefficients. Int. J. Mass Spectrom. 2007, 262, 114–121.
- Campbell-Sills, H.; Capozzi, V.; Romano, A.; Cappellin, L.; Spano, G.; Breniaux, M.; Lucas, P.; Biasioli, F. Advances in Wine Analysis by PTR-ToF-MS: Optimization of the Method and Discrimination of Wines from Different Geographical Origins and Fermented with Different Malolactic Starters. Int. J. Mass Spectrom. 2016, 397–398, 42–51.
- Spitaler, R.; Araghipour, N.; Mikoviny, T.; Wisthaler, A.; Via, J.D.; Märk, T.D. PTR-MS in Enology: Advances in Analytics and Data Analysis. Int. J. Mass Spectrom. 2007, 266, 1–7.
- Beauchamp, J.; Biberacher, S.; Gao, S. Rapid Quantitation of Phenolic Compounds in Islay Single Malt Scotch Whiskies by Direct Injection Mass Spectrometry. In ACS Symposium Series; Guthrie, B., Beauchamp, J.D., Buettner, A., Toth, S., Qian, M.C., Eds.; American Chemical Society: Washington, DC, USA, 2019; Volume 1321, pp. 117–124. ISBN 978-0-8412-3467-3.
- Durup-Ferguson, M.; Böhringer, H.; Fahey, D.W.; Ferguson, E.E. Enhancement of Charge-transfer Reaction Rate Constants by Vibrational Excitation at Kinetic Energies below 1 eV. J. Chem. Phys. 1983, 79, 265–272.
- Fiches, G.; Déléris, I.; Saint-Eve, A.; Pollet, B.; Brunerie, P.; Souchon, I. Modifying PTR-MS Operating Conditions for Quantitative Headspace Analysis of Hydro-Alcoholic Beverages. 1. Variation of the Mean Collision Energy to Control Ionization Processes Occurring during PTR-MS Analyses of 10–40% (v/v) Ethanol–Water Solutions. Int. J. Mass Spectrom. 2013, 356, 41–45.
- Romano, A.; Fischer, L.; Herbig, J.; Campbell-Sills, H.; Coulon, J.; Lucas, P.; Cappellin, L.; Biasioli, F. Wine Analysis by FastGC Proton-Transfer Reaction-Time-of-Flight-Mass Spectrometry. Int. J. Mass Spectrom. 2014, 369, 81–86.
- Baerenzung Dit Baron, T.; Yobrégat, O.; Jacques, A.; Simon, V.; Geffroy, O. A Novel Approach to Discriminate the Volatilome of Vitis vinifera Berries by Selected Ion Flow Tube Mass Spectrometry Analysis and Chemometrics. Food Res. Int. 2022, 157, 111434.
- Geffroy, O.; Baerenzung Dit Baron, T.; Yobrégat, O.; Denat, M.; Simon, V.; Jacques, A. The SIFT-MS Fingerprint of Vitis vinifera L. Cv. Syrah Berries Is Stable over the Second Part of Maturation under Warm Conditions of Climate. OENO One 2022, 56, 139–146.
- Farrell, R.R.; Fahrentrapp, J.; García-Gómez, D.; Martinez-Lozano Sinues, P.; Zenobi, R. Rapid Fingerprinting of Grape Volatile Composition Using Secondary Electrospray Ionization Orbitrap Mass Spectrometry: A Preliminary Study of Grape Ripening. Food Control 2017, 81, 107–112.
- Morozova, K.; Romano, A.; Lonardi, F.; Ferrarini, R.; Biasioli, F.; Scampicchio, M. Microcalorimetric Monitoring of Grape Withering. Thermochim. Acta 2016, 630, 31–36.
- Specht, G. Improving Yeast and Fermentation Management. In Managing Wine Quality; Elsevier: Amsterdam, The Netherlands, 2022; pp. 43–75. ISBN 978-0-08-102065-4.
- Marullo, P.; Dubourdieu, D. Yeast Selection for Wine Flavor Modulation. In Managing Wine Quality; Elsevier: Amsterdam, The Netherlands, 2022; pp. 371–426. ISBN 978-0-08-102065-4.
- Khomenko, I.; Stefanini, I.; Cappellin, L.; Cappelletti, V.; Franceschi, P.; Cavalieri, D.; Märk, T.D.; Biasioli, F. Non-Invasive Real Time Monitoring of Yeast Volatilome by PTR-ToF-MS. Metabolomics 2017, 13, 118.
- Cuenca, M.; Ciesa, F.; Romano, A.; Robatscher, P.; Scampicchio, M.; Biasioli, F. Mead Fermentation Monitoring by Proton Transfer Reaction Mass Spectrometry and Medium Infrared Probe. Eur. Food Res. Technol. 2016, 242, 1755–1762.
- Richter, T.M.; Silcock, P.; Algarra, A.; Eyres, G.T.; Capozzi, V.; Bremer, P.J.; Biasioli, F. Evaluation of PTR-ToF-MS as a Tool to Track the Behavior of Hop-Derived Compounds during the Fermentation of Beer. Food Res. Int. 2018, 111, 582–589.
- Berbegal, C.; Khomenko, I.; Russo, P.; Spano, G.; Fragasso, M.; Biasioli, F.; Capozzi, V. PTR-ToF-MS for the Online Monitoring of Alcoholic Fermentation in Wine: Assessment of VOCs Variability Associated with Different Combinations of Saccharomyces/Non-Saccharomyces as a Case-Study. Fermentation 2020, 6, 55.
- Tsachaki, M.; Linforth, R.S.T.; Taylor, A.J. Dynamic Headspace Analysis of the Release of Volatile Organic Compounds from Ethanolic Systems by Direct APCI-MS. J. Agric. Food Chem. 2005, 53, 8328–8333.
- Tsachaki, M.; Aznar, M.; Linforth, R.S.T.; Taylor, A.J. Dynamics of Flavour Release from Ethanolic Solutions. In Developments in Food Science; Elsevier: Amsterdam, The Netherlands, 2006; Volume 43, pp. 441–444. ISBN 978-0-444-52742-4.
- Boothroyd, E.L.; Linforth, R.S.T.; Cook, D.J. Effects of Ethanol and Long-Chain Ethyl Ester Concentrations on Volatile Partitioning in a Whisky Model System. J. Agric. Food Chem. 2012, 60, 9959–9966.
- Clark, R.; Linforth, R.; Bealin-Kelly, F.; Hort, J. Effects of Ethanol, Carbonation and Hop Acids on Volatile Delivery in a Model Beer System. J. Inst. Brew. 2011, 117, 74–81.
- Taylor, A.J.; Linforth, R.S.T. Flavour Release in the Mouth. Trends Food Sci. Technol. 1996, 7, 444–448.
- Sémon, E.; Arvisenet, G.; Guichard, E.; Le Quéré, J.-L. Modified Proton Transfer Reaction Mass Spectrometry (PTR-MS) Operating Conditions for in Vitro and in Vivo Analysis of Wine Aroma. J. Mass Spectrom. 2018, 53, 65–77.
- Muñoz-González, C.; Brule, M.; Martin, C.; Feron, G.; Canon, F. Molecular Mechanisms of Aroma Persistence: From Noncovalent Interactions between Aroma Compounds and the Oral Mucosa to Metabolization of Aroma Compounds by Saliva and Oral Cells. Food Chem. 2022, 373, 131467.
- Fiches, G.; Saint Eve, A.; Jourdren, S.; Déléris, I.; Brunerie, P.; Souchon, I. Temporality of Perception during the Consumption of French Grape Brandies with Different Aging Times in Relation with Aroma Compound Release: Perception and Aroma Compound Releases during Brandy Consumption. Flavour Fragr. J. 2016, 31, 31–40.
- Deleris, I.; Saint-Eve, A.; Guo, Y.; Lieben, P.; Cypriani, M.-L.; Jacquet, N.; Brunerie, P.; Souchon, I. Impact of Swallowing on the Dynamics of Aroma Release and Perception during the Consumption of Alcoholic Beverages. Chem. Senses 2011, 36, 701–713.
- Lasekan, O.; Otto, S. In Vivo Analysis of Palm Wine (Elaeis guineensis) Volatile Organic Compounds (VOCs) by Proton Transfer Reaction-Mass Spectrometry. Int. J. Mass Spectrom. 2009, 282, 45–49.
- Saint-Eve, A.; Déléris, I.; Aubin, E.; Semon, E.; Feron, G.; Rabillier, J.-M.; Ibarra, D.; Guichard, E.; Souchon, I. Influence of Composition (CO2 and Sugar) on Aroma Release and Perception of Mint-Flavored Carbonated Beverages. J. Agric. Food Chem. 2009, 57, 5891–5898.
- Pozo-Bayón, M.Á.; Santos, M.; Martín-Álvarez, P.J.; Reineccius, G. Influence of Carbonation on Aroma Release from Liquid Systems Using an Artificial Throat and a Proton Transfer Reaction-Mass Spectrometric Technique (PTR-MS). Flavour Fragr. J. 2009, 24, 226–233.
- Fiches, G.; Déléris, I.; Saint-Eve, A.; Brunerie, P.; Souchon, I. Modifying PTR-MS Operating Conditions for Quantitative Headspace Analysis of Hydro-Alcoholic Beverages. 2. Brandy Characterization and Discrimination by PTR-MS. Int. J. Mass Spectrom. 2014, 360, 15–23.
- Ashraf, N.; Linforth, R.S.T.; Bealin-Kelly, F.; Smart, K.; Taylor, A.J. Rapid Analysis of Selected Beer Volatiles by Atmospheric Pressure Chemical Ionisation-Mass Spectrometry. Int. J. Mass Spectrom. 2010, 294, 47–53.
- Nwaiwu, O.; Ibekwe, V.; Amadi, E.; Udebuani, A.; Nwanebu, F.; Oguoma, O.; Nnokwe, J. Evaluation of Fermentation Products of Palm Wine Yeasts and Role of Sacoglottis Gabonensis Supplement on Products Abundance. Beverages 2016, 2, 9.
- Chambers-Bédard, C.; Ross, B.M. Quantification of Methanol in the Presence of Ethanol by Selected Ion Flow Tube Mass Spectrometry. Eur. J. Mass Spectrom. 2016, 22, 159–164.
- Cappellin, L.; Lopez-Hilfiker, F.D.; Pospisilova, V.; Ciotti, L.; Pastore, P.; Gonin, M.; Hutterli, M.A. Thermal Desorption–Vocus Enables Online Nondestructive Quantification of 2,4,6-Trichloroanisole in Cork Stoppers below the Perception Threshold. Anal. Chem. 2020, 92, 9823–9829.
- ISO 20752:2014; Cork Stoppers—Determination of Releasable 2,4,6-Trichloroanisol (TCA). ISO: Geneva Switzerland, 2014.