Your browser does not fully support modern features. Please upgrade for a smoother experience.
Please note this is a comparison between Version 1 by Gerda Rogl and Version 3 by Jason Zhu.
Half-Heusler alloys are among the most promising thermoelectric materials.
- Half Heusler alloys, physical properties, Figure of merit
1. Introduction
In this chapter, all data from references [1][2][3][4][5][6][7][8][9][10][11][12][13][14][15][16][17][18][19][20][21][22][23][24][25][26][27][28][29][30][31][32][33][34][35][36][37][38][39][40][41][42][43][44][45][46][47][48][49][50][51][52][53][54][55][56][57][58][59][60][61][62][63][64][65][66][67][68][69][70][71][72][73][74][75][76][77][78][79][80][81][82][83][84][85][86][87][88][89][90][91][92][93][94][95][96][97][98][99][100][101][102][103][104][105][106][107][108][109][110][111][112][113][114][115][116][117][118][119][120][121][122][123][124][125][126][127][128][129][130][131][132][133][134][135][136][137][138][139][140][141][142][143][144][145][146][147][148][149][150][151][152][153][154][155][156][157][158][159][160][161][162][163][164][165][166][167][168][169][170][171][172][173][174][175][176][177][178][179][180][181][182][183][184][185][186][187][188][189][190][191][192][193][194][195][196][197][198][199][200][201][202][203][204][205][206][207][208][10,11,12,13,14,15,16,17,18,19,20,21,22,23,24,25,26,27,29,30,31,32,33,34,35,36,37,38,39,40,41,42,43,44,45,46,47,48,49,50,51,52,53,54,55,56,57,58,59,60,61,62,63,64,65,66,67,68,69,70,71,72,73,74,75,76,77,78,79,80,81,82,83,84,85,86,87,88,89,90,91,92,93,94,95,96,97,98,99,100,101,102,103,104,105,106,107,108,109,110,111,112,113,114,115,116,117,118,119,120,121,122,123,124,125,126,127,128,129,130,131,132,133,134,135,136,137,138,139,140,141,142,143,144,145,146,147,148,149,150,151,152,153,154,155,156,157,158,159,160,161,162,163,164,165,166,167,168,169,170,171,172,173,174,175,176,177,178,179,180,181,182,183,184,185,186,187,188,189,190,191,192,193,194,195,196,197,198,199,200,201,202,203,204,205,206,207,208,209,210,211,212,213,214,215,216,217,218] were used for figures and discussions. The references [19][20][21][22][23][24][25][26][27][28][29][30][31][32][33][34][35][36][37][38][39][40][41][42][43][44][45][46][47][48][49][50][51][52][53][54][55][56][57][58][59][60][61][62][63][64][65][66][67][68][69][70][71][72][73][74][75][76][77][78][79][80][81][82][83][84][85][86][87][88][89][90][91][92][93][94][95][96][97][98][99][100][101][102][103][104][105][106][107][108][109][110][111][112][113][114][115][116][117][118][119][120][121][122][123][124][125][126][127][128][129][130][131][132][133][134][135][136][137][138][139][140][141][142][143][144][145][146][147][148][149][150][151][152][153][154][155][156][157][158][159][160][161][162][163][164][165][166][167][168][169][170][171][172][173][174][175][176][177][178][179][180][181][182][183][184][185][186][187][188][189][190][191][192][193][194][195][196][197][198][199][200][201][202][203][204][205][206][207][208][29,30,31,32,33,34,35,36,37,38,39,40,41,42,43,44,45,46,47,48,49,50,51,52,53,54,55,56,57,58,59,60,61,62,63,64,65,66,67,68,69,70,71,72,73,74,75,76,77,78,79,80,81,82,83,84,85,86,87,88,89,90,91,92,93,94,95,96,97,98,99,100,101,102,103,104,105,106,107,108,109,110,111,112,113,114,115,116,117,118,119,120,121,122,123,124,125,126,127,128,129,130,131,132,133,134,135,136,137,138,139,140,141,142,143,144,145,146,147,148,149,150,151,152,153,154,155,156,157,158,159,160,161,162,163,164,165,166,167,168,169,170,171,172,173,174,175,176,177,178,179,180,181,182,183,184,185,186,187,188,189,190,191,192,193,194,195,196,197,198,199,200,201,202,203,204,205,206,207,208,209,210,211,212,213,214,215,216,217,218] are numbered by the publication year, within one year, in alphabetical order.
Looking at the highest ZTs published during the last 25 years, one can see in Figure 1 that, as already mentioned in the introduction, considerably more n-type half-Heusler alloys were investigated than p-type. It is also clearly visible that the trend of high peak ZTs increases almost linearly from 2004 to 2018. There are exceptions for the n-type, such as (i) the work of Sakurada et al. [33][43], who published already in 2005 outstanding high values (ZT = 1.25 to 1.5) for Ti0.5Zr0.25Hf0.25NiSn doped with small amounts of antimony, or (ii) from Shen et al. [8][23][17,33] and Kawasaki et al. [27][37], who reached almost ZTs = 1 at 800 K in 2001 and 2004 for ZrNiSn0.99Sb0.01. It is also worth mentioning that Yu et al. [140][150] reached ZT = 1.6 at 1200 K for his p-type HH series (Nb1−xTax)0.8Ti0.2FeSb. Furthermore, it seems that after a boom during 2015–2020, the number of half-Heusler publications has dropped significantly.
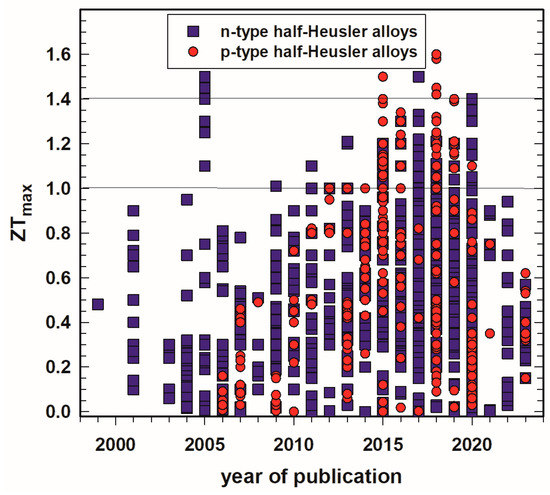
Figure 1. Peak ZT, ZTmax, of p- and n-type half-Heusler alloys vs. year of publication.
Figure 2 displays the highest ZTs as a function of temperature. It is necessary to point out that in some cases ZTmax is not really the peak ZT of the respective sample but the ZT at the highest measured temperature. This is especially the case for publications earlier than 2005. Besides that, in most cases ZTmax is published for temperatures between 700 K and 1000 K; the highest temperatures for ZTmax for p- as well as n-type are around 1200 K.
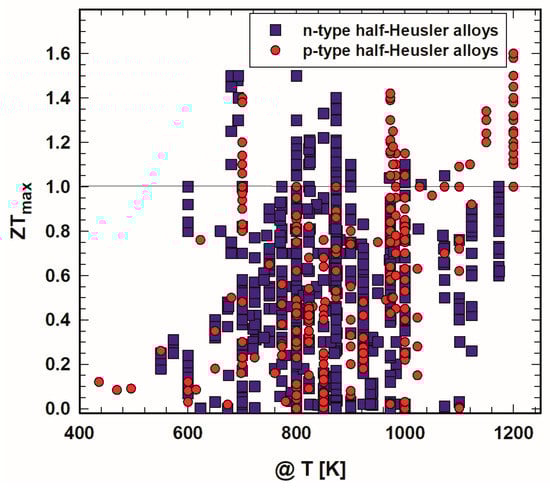
Figure 2. Peak ZT, ZTmax, of p- and n-type half-Heusler alloys vs. temperature, T.
Figure 3 and Figure 4 depict the dependence of the power factor on the thermal conductivity at 300 K and 800 K, respectively. Figure 3 shows that at 300 K, almost all power factor values for the n-type are within the range of 4 mW/mK2 for thermal conductivities up to 250 mW/cmK, whereas the p-type displays much higher power factors, reaching values higher than 10 mW/mK2 for thermal conductivities up to about 150 mW/cmK, e.g., for the Nb1−xTixFeSb-series of He et al. [121][131] or for Nb0.95Hf0.05FeSb and Nb0.95Zr0.05FeSb of Ren and colleagues [150][160].
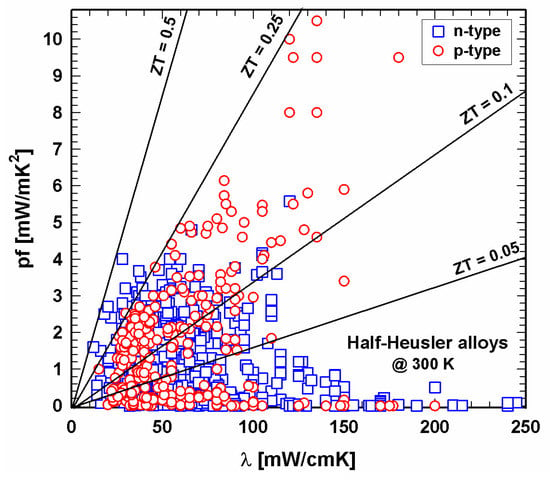
Figure 3. P- and n-type half-Heusler alloys: power factor, pf, vs. thermal conductivity, λ, at 300 K.
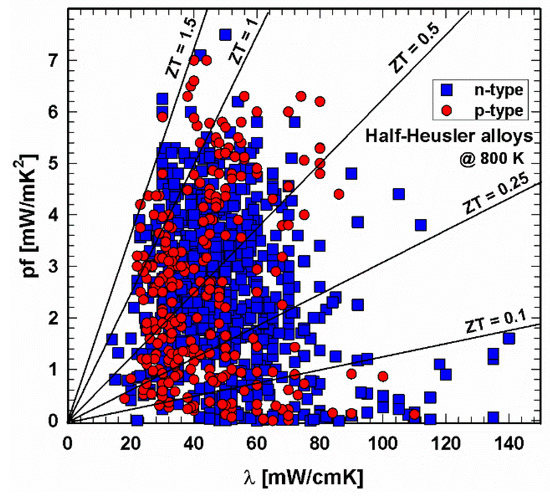
Figure 4. P- and n-type half-Heusler alloys: power factor, pf, vs. thermal conductivity, λ, at 800 K.
The situation has changed comparing this figure now with the one for 800 K (Figure 4), and as for p- and n-type, all data are mainly evenly distributed within a power factor–thermal conductivity window of almost 0–5.5 mW/mK2 by 20–80 mW/cmK.
Lines for the resulting ZT values are drawn in both Figure 3 and Figure 4, revealing that at 300 K, no compound exceeds ZT = 0.5. Whilst many of the p-type compounds range between ZT = 0.1 and 0.25 or have values as low as almost 0, one can find the values for the n-type all over, the very low values due to high thermal conductivities. At 800 K, both p- and n-type exceed the ZT = 1.5 line. The majority of data can be found for thermal conductivities between 20 and 80 mW/cmK, representing ZTs from almost 0 to ZT = 1.5. This figure also illustrates that p-type HH materials generally exhibit lower thermal conductivities than the n-type.
Figure 5 and Figure 6 depict the relation between electrical resistivity and ZT at 300 K and 800 K, respectively. It shows that, especially in the 300 K temperature region, individual specimens have very high resistivities, resulting, as a consequence, in very low ZTs. Generally, the electrical resistivity decreases with increasing temperature. Figure 6 displays lower resistivity values. Still, here one can find ZTs in the range of 10−3 or even lower. The insert, a cutout, in each ZT-resistivity figure, gives a better overview, indicating that, especially for 800 K, most data can be found between 500 and 2500 µΩcm. In this region are also the highest ZTs.
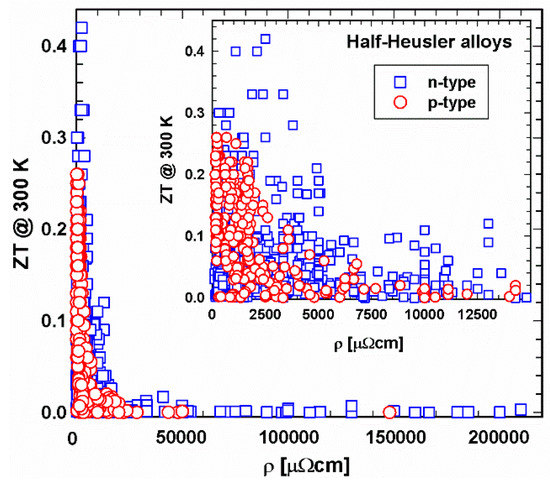
Figure 5. ZT at 300 K vs. electrical resistivity, ρ, for p- and n-type half-Heusler alloys. Insert: cutout for ρ < 15000 µΩcm.
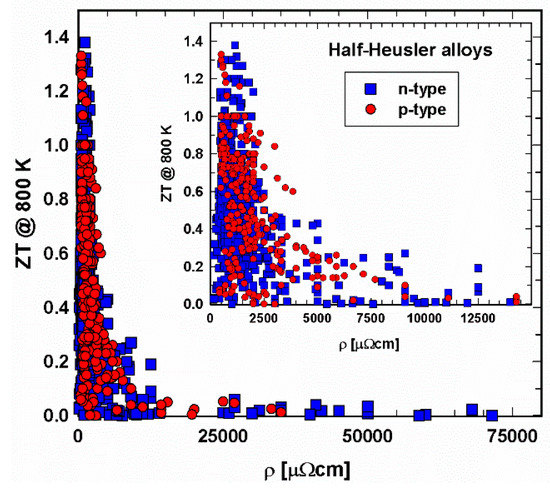
Figure 6. ZT at 800 K vs. electrical resistivity, ρ, for p- and n-type half-Heusler alloys. Insert: cutout for ρ < 12000 µΩcm.
Figure 7 and Figure 8 present the dependence of ZT on the Seebeck coefficient. Especially at 300 K, the area of Seebeck values is much wider for the n- than for the p-type. Generally, it seems that an absolute Seebeck value of 200 ± 20 µV/cm leads to high ZTs, a great finding for the production of new half-Heuslers.
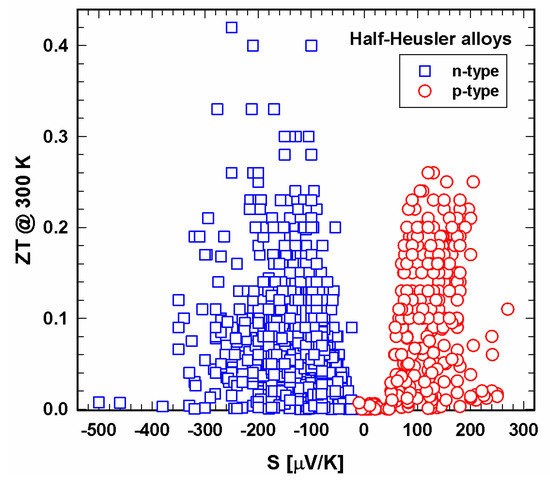
Figure 7. ZT at 300 K vs. Seebeck coefficient, S, for p- and n-type half-Heusler alloys.
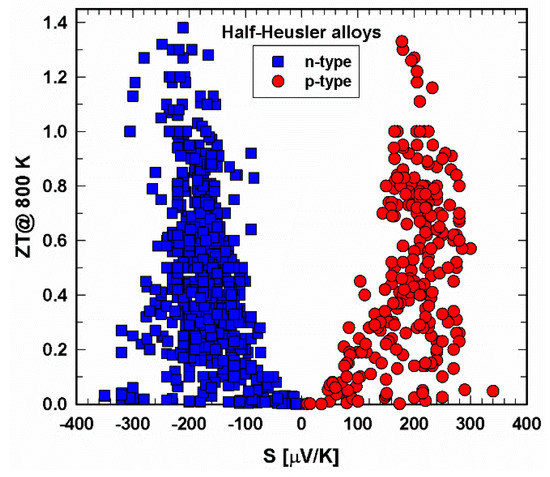
Figure 8. ZT at 800 K vs. Seebeck coefficient, S, for p- and n-type half-Heusler alloys.
Whereas for the high-temperature regime (Figure 9), the data ZT vs. λ are more or less evenly mixed at 300 K (insert in Figure 9), most p-type half-Heuslers have thermal conductivities between 20 and 70 mW/cmK. Of course, in both regions, ZTs are high for low thermal conductivities. Comparing the total and the lattice thermal conductivities in Figure 9 and Figure 10, the distribution of the data looks very similar, indicating that the electron part of the thermal conductivity is rather low, and, as a consequence, the phonon part is in the range of the total thermal conductivity.
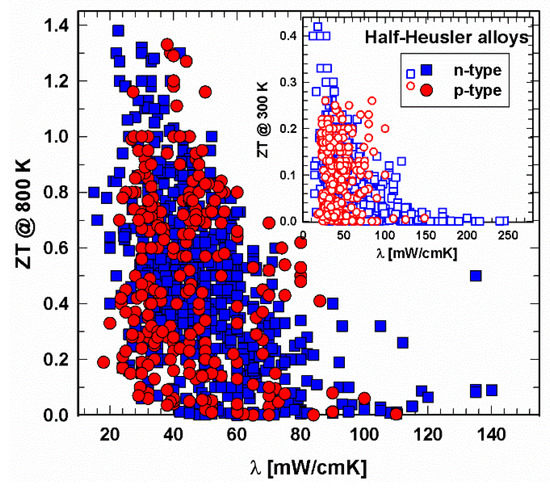
Figure 9. ZT at 800 K vs. thermal conductivity, λ, for p- and n-type half-Heusler alloys. Insert: ZT at 300 K vs. thermal conductivity, λ.
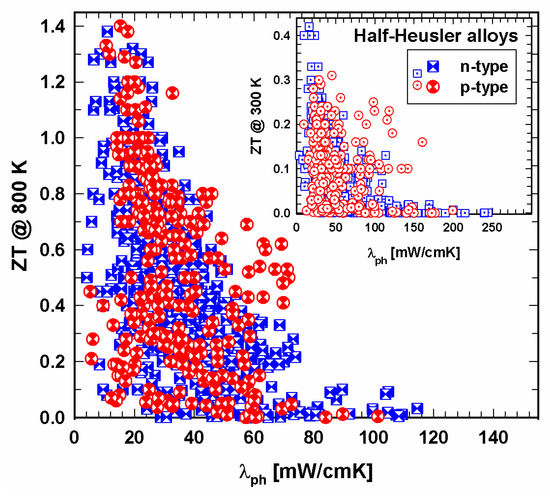
Figure 10. ZT at 800 K vs. lattice thermal conductivity, λph, for p- and n-type half-Heusler alloys. Insert: ZT at 300 K vs. lattice thermal conductivity, λph.
2. N-Type Half-Heusler Alloys
2.1. (Ti,Zr,Hf)NiSn-System
Comparing the ZT values of TiNiSn, ZrNiSn and HfNiSn, as shown in Figure 11 and Figure 12, one can immediately see that ZrNiSn is the most investigated alloy of these three, whereas HfNiSn is not so popular. It is evident from Figure 11 and Figure 12 that the highest ZTs at 300 K as well as at 800 K in this system are for (Zr,Hf)NiSn and (Ti,Zr,Hf)NiSn and even more so when Sb-doped at the Sn site.
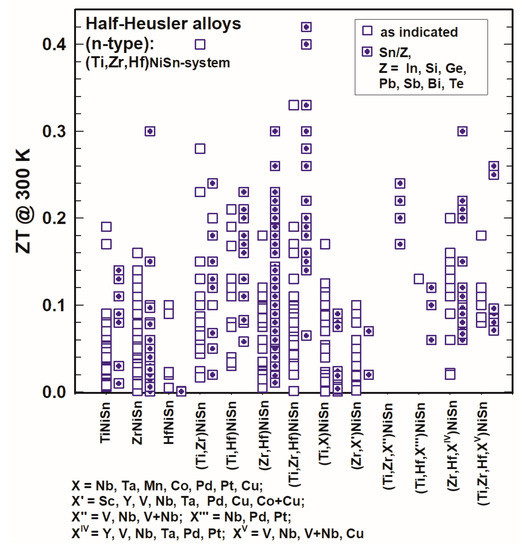
Figure 11. ZT at 300 K for the HH n-type (Ti,Zr,Hf)NiSn-system.
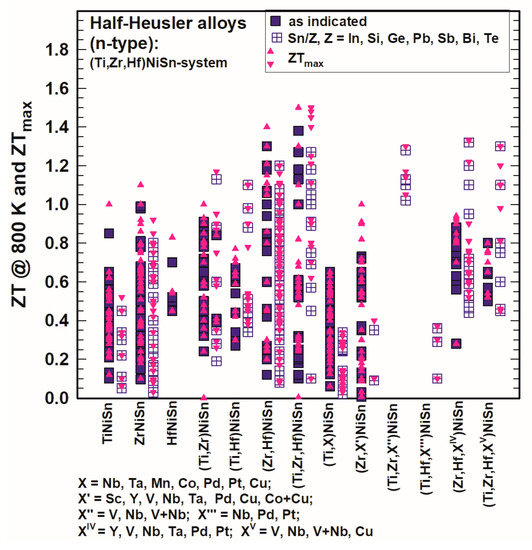
Figure 12. ZT at 800 K and ZTmax for the HH n-type (Ti,Zr,Hf)NiSn-system.
Gürth et al. [119][129] published ZT = 1 at 823 K for TiNiSn and for ZrNiSn, Misra et al. [96][106] ZT = 0.9 at 773 K for ZrNiSn and Liu et al. [109][119] ZT = 0.8 at 1000 K for HfNiSn. In comparison to these values, those for compounds with Ti and Zr, Ti and Hf, Zr and Hf or with Ti and Zr and Hf reach much higher values, such as for Zr0.7Hf0.3NiSn ZT = 1.2 at 873 K (Chauhan et al. [144][154]), for Ti0.5Zr0.25Hf0.25NiSn ZT = 1.3 at 693 K (Sakurada and Shutoh [33][43]; Shutoh and Sakurada [37][47]) or even ZT = 1.5 at 800 K (Rogl et al. [136][146]).
Doping in the (Ti,Zr,Hf)NiSn-system with X (X = Sc, Y, V, Nb, V + Nb, Ta, Mn, Co, Cu, Co + Cu, Pd, Pt, Pb) (see also Table 1) was not really successful as generally, all these alloys did not have higher ZTs; however, from Figure 11 as well as from Figure 12 it is obvious that with an additional substitution of Sn in many cases ZT is enhanced. Usually, Sn is substituted by a very small amount of Sb or Ge, but also, in rarer cases, In, Si, Pb, Bi or Te was used. The highest ZT values were reached for Ti0.5Zr0.25Hf0.25NiSn0.998Sb0.002 at 700 K (ZT = 1.5, Shutoh and Sakurada [37][47]) and Ti0.5Zr0.25Hf0.25NiSn0.99Sb0.01 at 825 K (ZT = 1.45, Rogl et al. [136][146]). Besides that, there are several compounds with ZT ∼ 1.3, such as (Hf0.6Zr0.4)0.99V0.01NiSn0.995Sb0.005 at 900 K (Chen et al. [130][140]) or Ti0.49Zr0.49V0.02NiSn0.98Sb0.02 at 823 K (Rogl et al. [136][146]) (see also Figure 12).
Various groups used additions (not shown in any figure but presented in Table 1), mainly nanoparticles, to reduce the thermal conductivity and to enhance ZT. Schwall and Balke [70][80] incorporated Nb into Zr0.5Hf0.5NiSn but presented data only below room temperature. Akram et al. [98][108] admixed La with ZrNiSn: the enhancement in ZT was within the error bar of ZT (from 0.52 to 0.54), which also applies to Visconti et al. [139][149], who used HfO2 for Ti0.5Zr0.5NiSn0.994Sb0.006 (ZT rises from 0.9 to 1). A better result was achieved by Chauhan et al. [143][153] by mixing ZnO with ZrNiSn (highest ZT = 1). Nanoparticles of ZrO2 were added to ZrNiSn (Huang et al. [25][35]) as well as to Zr0.5Hf0.5Ni0.8Pd0.2Sn0.99Sb0.01 and Zr0.25Hf0.6Ti0.15NiSn0.995Sb0.005 (Chen et al. [39][49] and [117][127], respectively). For ZrNiSn, the “enhancement” of ZT was within the error bar; however, it was much better for the other two compounds with ZTmax = 0.74 and even ZTmax = 1.3 for the Ti-doped half-Heusler alloy.
2.2. (Ti,Zr,Hf)CoSb-System, (V,Nb,Ta)FeSb-System, 19-Electron System and Other N-Type Half-Heusler Alloys
In Figure 13 and Figure 14, the ZTs are shown for the (Ti,Zr,Hf)CoSb-system, the (V,Nb,Ta)FeSb-system, the 19-electron system and of all those half-Heuslers, which do not fit into any of the so-far mentioned categories. For all these systems, only a few half-Heuslers with Sb/Sn substitutions were published; generally, ZTs are much lower in comparison with the (Ti,Zr,Hf)NiSn-system for 300 K as well as for 800 K.
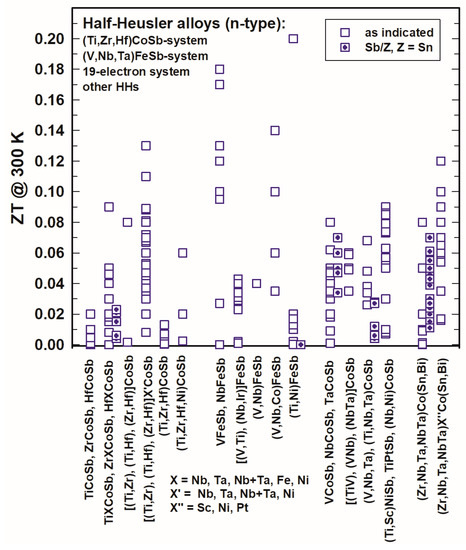
Figure 13. ZT at 300 K for the HH n-type (Ti,Zr,Hf)CoSb-system, (V,NbTa)FeSb-system, 19-electron system and other half-Heuslers.
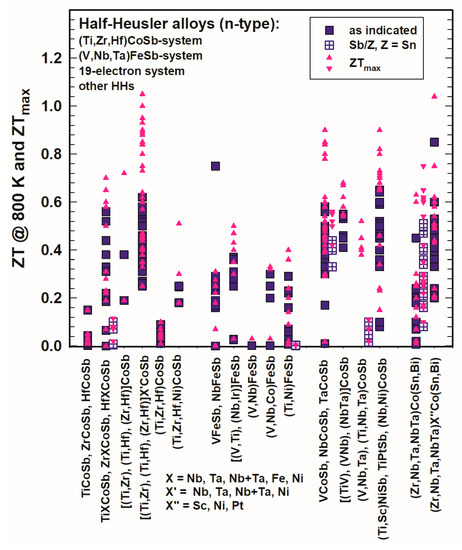
Figure 14. ZT at 800 K for the HH n-type (Ti,Zr,Hf)CoSb-system, (V,NbTa)FeSb-system, 19-electron system and other half-Heuslers.
At 800 K (Figure 14), almost all ZTs are lower than 0.7 and also ZTmax rarely exceeds 1. He et al. [131][141] reached ZT > 1 for Zr0.5Hf0.5Co0.9Ni0.1Sb at 1073 K, Liu et al. [148][158] acquired ZTs of almost 1 and around 1 for the series (Zr1−xHfx)0.88Nb0.12CoSb. Xia et al. [106][155][116,165] investigated Nb1−xCoSb and Nb0.8Co1−xNixSb with ZT = 0.8–0.9. Zhu et al. [177][187] obtained ZT = 0.85 at 800 K with a peak ZT = 1.04 at 972 K for ZrCo0.9Ni0.1Bi0.85Sb0.15.
3. P-Type Half-Heusler Alloys
In some cases, measurements were only performed below room temperature. Figure 15 and Figure 16 represent the ZTs for p-type half-Heusler alloys at 300 K and 800 K as well as the peak ZTs, respectively.
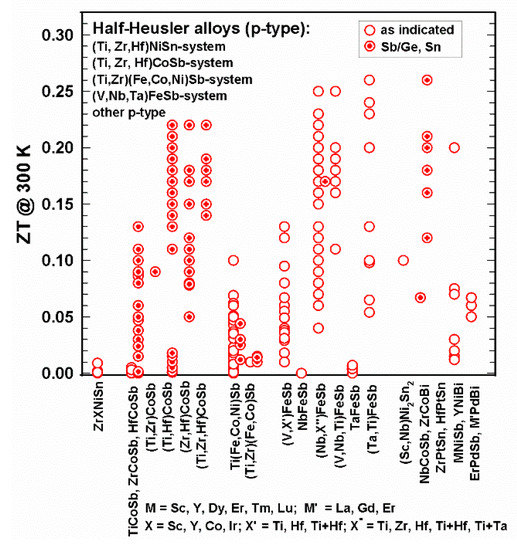
Figure 15. ZT at 300 K for the p-type HH alloys.
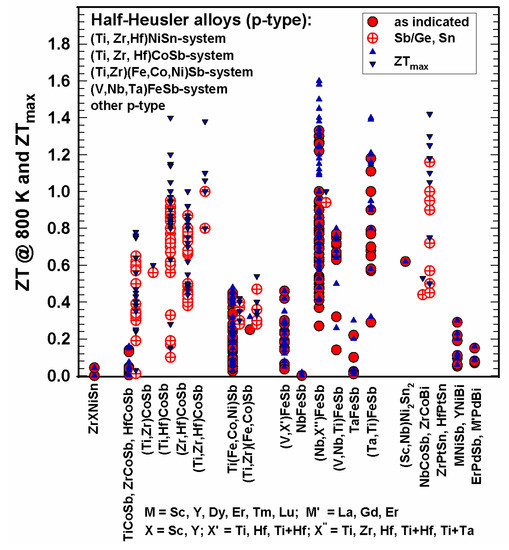
Figure 16. ZT at 800 K and ZTmax for the p-type HH alloys.
It is obvious that many more n-type than p-type alloys were investigated. As depicted in Figure 15, at 300 K, all ZTs are below 0.3; at 800 K (Figure 16), most ZTs are lower than 1; however, several half-Heuslers in the (NbX’’)FeSb series with X’’ = Ti, Zr, Hf, Zr and Hf, as well as Ti + Ta, reach ZT = 1.4 at 800 K; the values for ZTmax in some cases reach or even exceed 1.4 and go up to 1.6.
It can be seen in Figure 15 and Figure 16 that only data of two p-type compounds are available for the (Ti,Zr,Hf)NiSn-system, namely (Zr,Sc)NiSn [112][122] and (Zr,Y)NiSn [104][114] with rather low ZTs.
In the CoSb-based system, almost all compounds are substituted at the Sb-site by Sn, except for TiCoSb, which was also substituted by Ge [58][68]. Rausch et al. published in two separate works [110][111][120,121] rather high ZTs of the (Ti,Zr,Hf)CoSb1−xSnx, series: the highest ZTmax = 1.4 for Ti0.12Zr0.44Hf0.44CoSb0.8Sn0.2 at 963 K [111][121].
In the FeSb-based system, Yu et al. [140][150] achieved outstanding high peak ZT values (ZT = 1.2–1.6) for the series Ti0.2(Nb1−xTax)0.8FeSb; Zhu et al. gained ZT~1.4 at 1200 K for Hf0.12Nb0.88FeSb [158][168] and for Ti0.16Ta0.84FeSb [178][188].
Whereas many p-type half-Heuslers have ZTs < 1, the ZrCoBi-based half-Heuslers showed excellent thermoelectric performance, even more so for substituting at the Bi-site with ZT = 1.42 for ZrCoBi0.65Sb0.15Sn0.20 at 973 K as reported by Zhu et al. [159][169].
Also, for p-type half-Heusler alloys, some research groups tried to enhance ZT via additions. Kimura et al. [61][71] added Co and Ir to ZrNiSn and converted this way the n-type to a p-type half-Heusler alloy; however, ZTs were rather low, i.e., below 0.3. Mallick et al. [149][159] investigated (Hf0.7Ti0.3CoSb0.8Sn0.2)1−x(Cu1.98Ni0.04Te0.97Se0.03)x: for x = 0.25 they could enhance ZT = 0.15 (without the chalcogenide) to ZT = 0.63 at 1023 K, which corresponds an enhancement of 320%. Hsu et al. [93][103] were successful in producing nanostructured HfO2 during the ball-milling and spark–plasma–sintering process of Zr0.5Hf0.5CoSb0.8Sn0.2 and reached as highest ZT = 0.75. Xie et al. [183][193] enhanced ZT of Ti(Co,Fe)Sb with the addition of 1 atom percent nano inclusions of InSb by 450%; however, ZT = 0.33 is still very low.
4. Miscellaneous
On 8-electron half-Heusler alloys: Several authors have screened 8-electron half-Heusler alloys in DFT throughput calculations, identifying a series of compounds of interest in thermoelectrics. Vikram et al., in one publication [209][219], presented the TE properties of 21 half-Heusler alloys with a sum of 8 valence electrons (8-electron half-Heuslers); 6 of them showed ZTs between 0.8 and 1, such as LiSnAl, NaAlSn or LiAlGe. In another paper [210][220], he calculated the thermoelectric properties of a large number of ternary compounds of the type: group IA or IB element—group IIA or IIB element—group V element. From these results, he highlighted even ZTs such as ZT = 1.37 for RbPBa and ZT = 1.56 for AgPMg. Hoat et al. [211][221] also made theoretical investigations of the 8-electron half-Heusler alloy RbYSn, but they published only the power factors for the p- and n-types. So far, however, no experimental confirmation exists for the ZTs estimated from these DFT calculations.
On “double half-Heusler alloys”, etc.: Some authors have coined the term “double half-Heusler alloys”, “triple half-Heusler alloys”, etc. These terms are not without problems. Firstly, double a half is full, but the authors certainly did not want to discuss full-Heusler alloys. Secondly, a formula such as Ti2FeCoSnSb from a structural chemical point of view indicates a fully ordered compound, where Fe,Co and Sn,Sb atoms fully occupy separate two-fold sites in a crystallographic subgroup of the space group of the half-Heusler phase. As such a subgroup cannot be found among the HH face-centered cubic space group type, the structure, therefore, needs to be transferred into a suitable body-centered tetragonal space group (cubic setting a,a,a needs to be transferred to a tetragonal cell: a/2−−√,a/2−−√,𝑎) in order to find sites of two-fold multiplicity. Only if authors can prove the full atom order will the formula Ti2FeCoSnSb be proper. Similar arguments hold for “triple half-Heusler alloys“, etc.