Your browser does not fully support modern features. Please upgrade for a smoother experience.
Please note this is a comparison between Version 2 by Rita Xu and Version 1 by Anatoly Shekhter.
The analysis of the microvasculature and the assessment of angiogenesis have significant prognostic value in various diseases, including cancer. The search for invasion into the blood and lymphatic vessels and the assessment of angiogenesis are important aspects of oncological diagnosis. These features determine the prognosis and aggressiveness of the tumor. Traditional manual evaluation methods are time consuming and subject to inter-observer variability. Blood vessel detection is a perfect task for artificial intelligence, which is capable of rapid analyzing thousands of tissue structures in whole slide images.
- artificial intelligence
- cancer
- blood vessel detection
- digital pathology
- computational pathology
1. Introduction
Histopathological examination of tissue samples, particularly histological slides, is a critical component of diagnosing and understanding the biological behavior of various malignancies. One of the most significant aspects of histopathological analysis is the evaluation of blood vessels, which play a crucial role in tumor growth, metastasis and response to treatment [1]. Blood vessels within and surrounding the tumor microenvironment contribute to the delivery of essential nutrients and oxygen, facilitating tumor growth and progression. Furthermore, they serve as a route for cancer cells to disseminate from the primary tumor to other sites in the body, leading to metastasis [1,2][1][2].
Vascular invasion is indicated as an important prognostic factor in the TNM 8 classification and is present in the College of American Pathologists (CAP) cancer protocol templates [3,4][3][4]. The accurate detection and characterization of blood vessels in histological slides is essential for determining tumor stage, predicting prognosis and guiding treatment decisions. One of the commonly used scoring methods is microvessel density (MVD), which measures the number of blood vessels in each area of the tumor. This can be achieved by staining the tissue sample for markers that are specific to blood vessels, such as CD31 or CD34, and then counting the number of stained areas under a microscope [1,2][1][2]. High MVD generally indicates a high level of angiogenesis and is often associated with more aggressive tumors and poorer prognosis. Methods include counting vessels in ‘hotspots’ under the microscope or quantifying the expression of angiogenic factors such as VEGF (Vascular Endothelial Growth Factor) by immunohistochemistry (IHC). Some anticancer therapies target angiogenesis, aiming to cut off the tumor’s blood supply and starve it of nutrients [4]. The use of IHC markers of the vascular wall makes the process of searching for blood vessels more visual and faster in high-workflow conditions, reducing the number of errors, while also having disadvantages in the form of the high cost of consumables, a long wait time for staining results, and additional skill requirements for laboratory assistants. Blood vessels possess significant prognostic and predictive value, defined by their role in tumor growth and metastasis.
The presence of lymphovascular invasion (LVI), which refers to the infiltration of tumor cells into the lymphatic or blood vessels, is considered an adverse prognostic factor in many malignancies, including breast, lung and gastrointestinal cancers [5]. LVI has been associated with higher rates of lymph node metastasis, increased risk of distant metastasis and poorer overall survival. The search for lymphatic vessels on a stained hematoxylin and eosin (H&E) preparation is more difficult than the search for blood vessels due to their extremely thin walls and the absence of specific IHC markers, but it is extremely important, for example, in breast cancer to assess the risk of lymphatic metastases.
Despite the importance of blood vessel detection and characterization in histological slides, the manual evaluation of these features by pathologists is a time-consuming and labor-intensive process, often prone to inter-observer variability and subjectivity. Moreover, the assessment of blood vessels in histological slides can be challenging due to their complex and heterogeneous morphology, as well as the presence of artifacts and other confounding factors [4]. Automated search for blood vessels and regions of vascular invasion of tumors can provide a fast and reliable solution for optimization of the routine work (Figure 1).
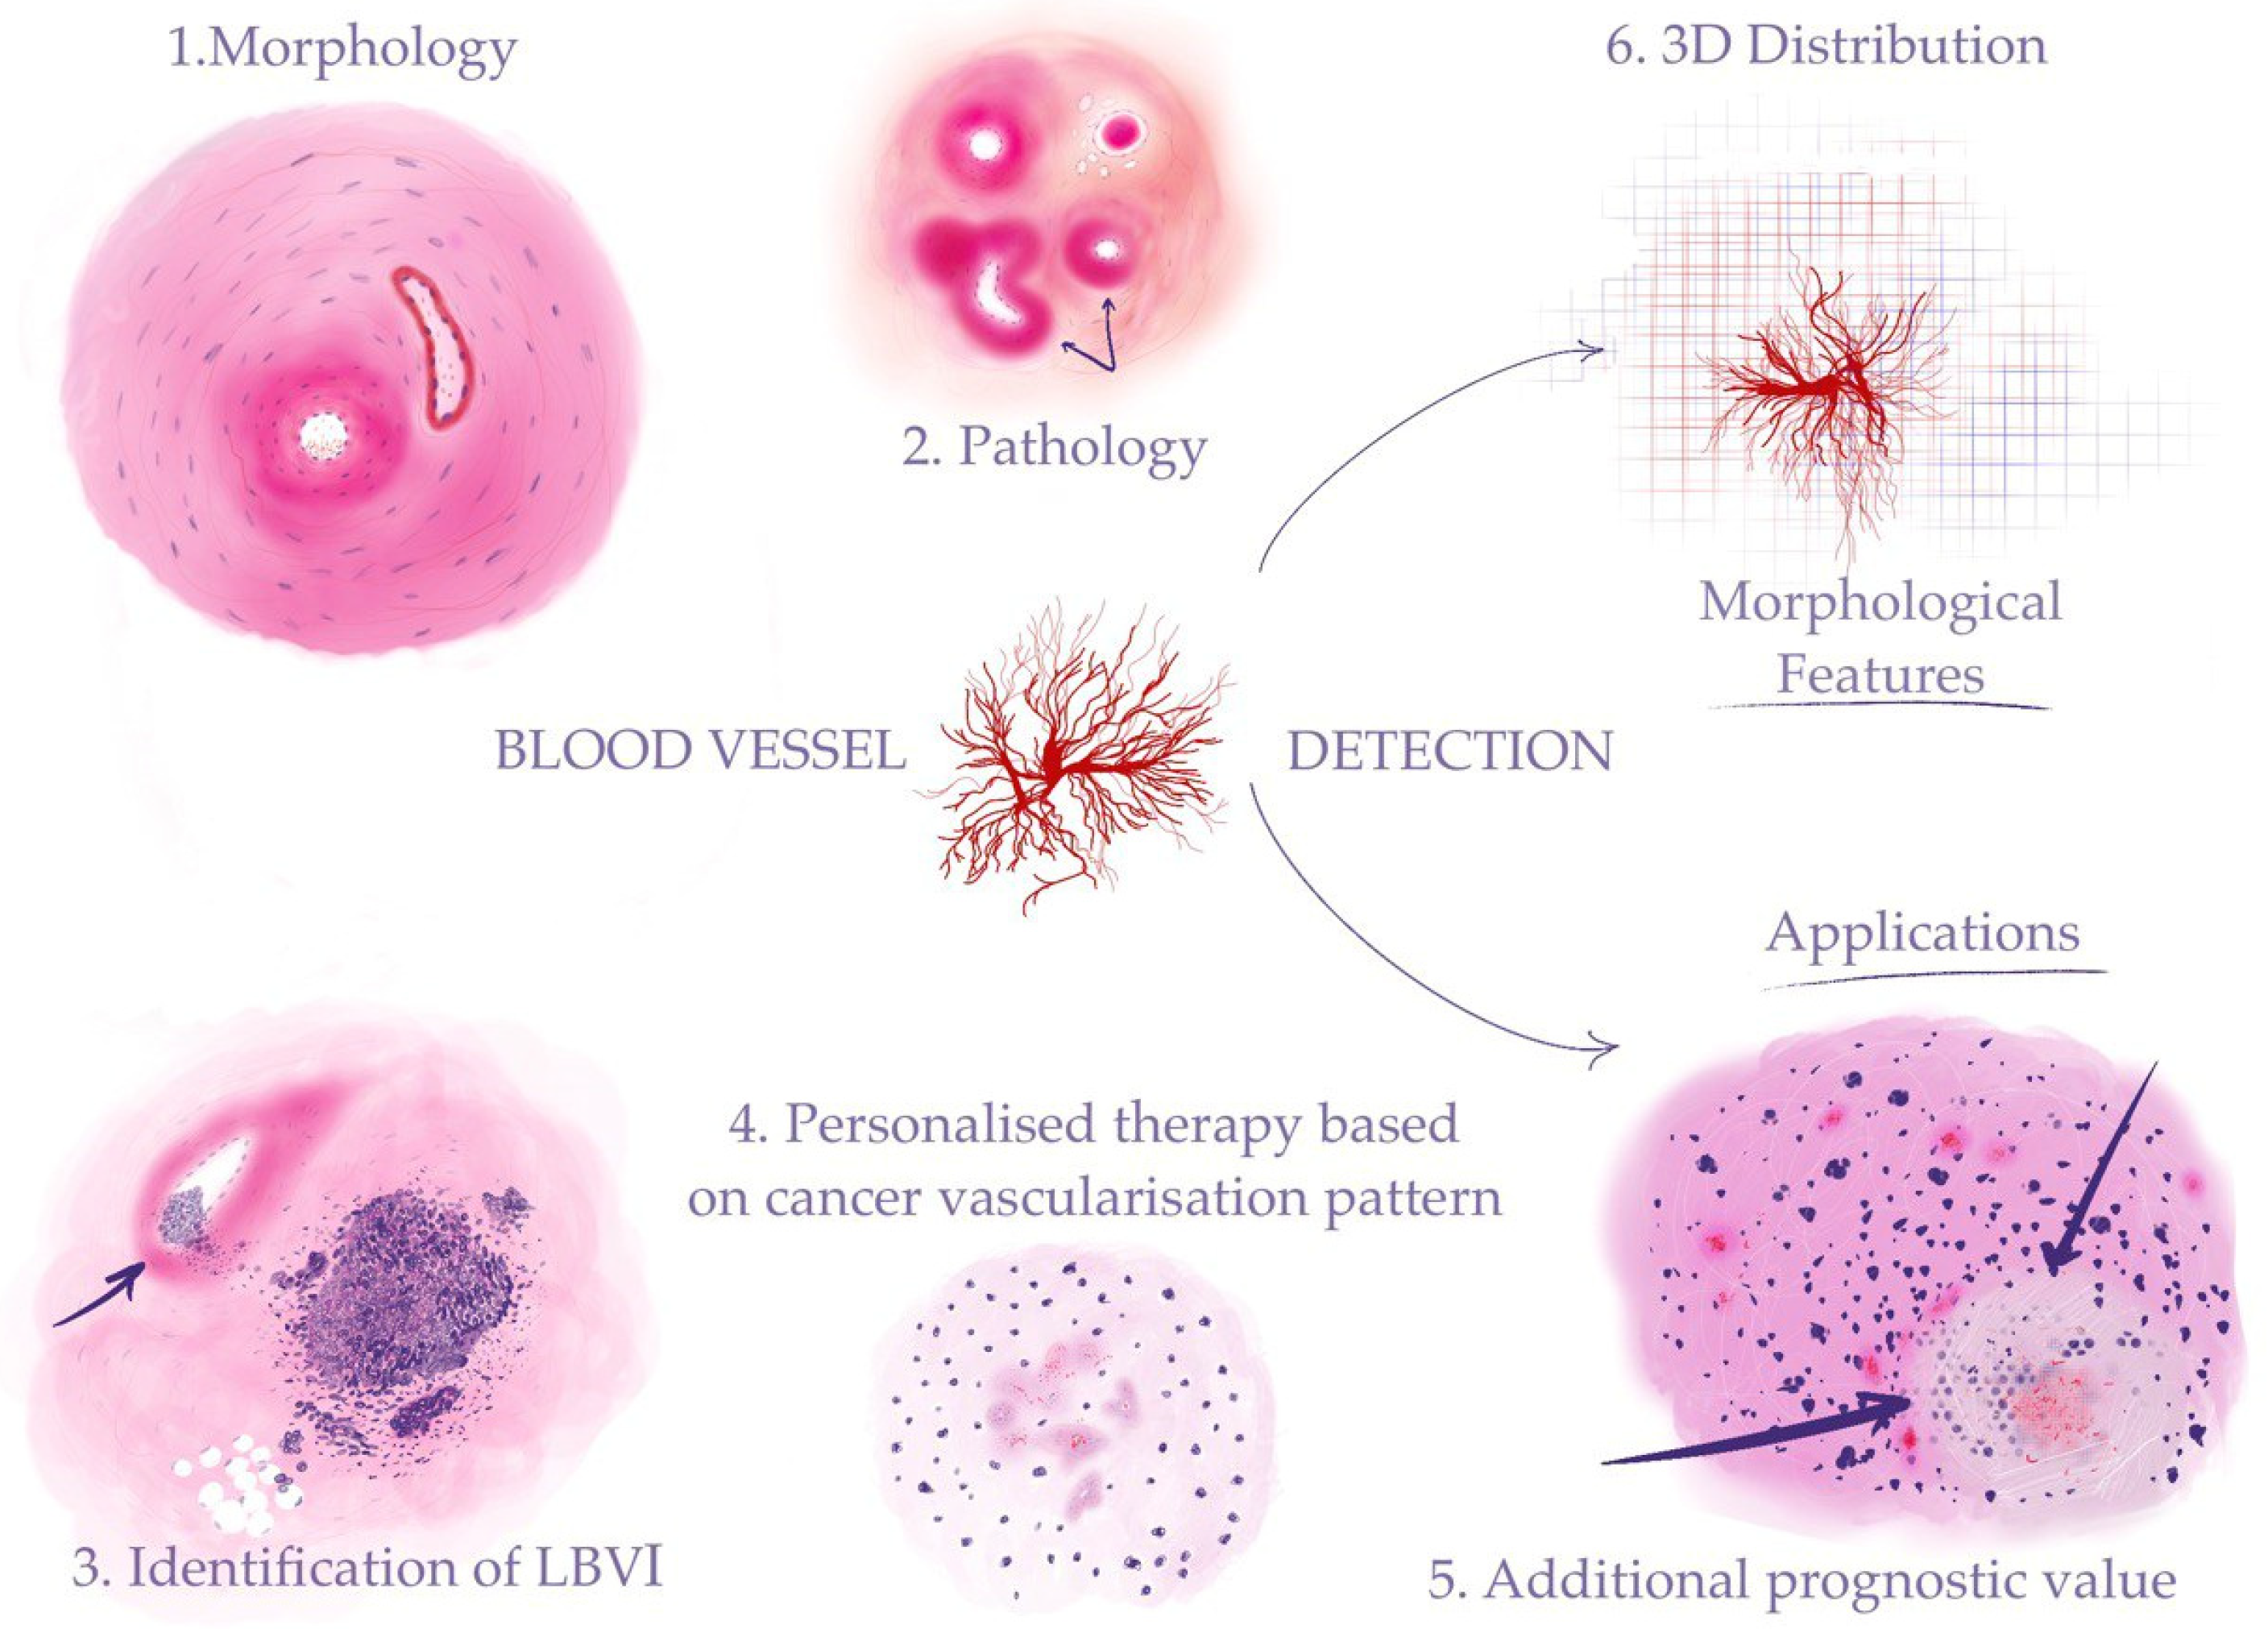
Figure 1. Automated detection of blood vessels makes it possible to investigate a range of morphological features to address clinical problems: (1) recognizing morphological structures and patterns (“Morphology” in the figure stands for blood vessels—arteries and veins); (2) identifying pathological changes in blood vessels (“Pathology” in the figure stands for sclerosis (indicated by arrows)); (3) detection of cancer vascular invasion (the arrow shows tumor cells in the vessel lumen); (4) assessment of the tumor vascularization pattern for the purpose of personalized therapy (“Personalized therapy based on cancer vascularization pattern” stands for microvessel proliferation in the glioblastoma); (5) AI-assisted calculation of prognostic histological biomarkers (“Additional prognostic value” stands for glioblastoma tumor cells palisading (indicated by arrows) around a central necrosis); (6) 3D reconstruction on the cellular level for investigation of tumor growth and its connection to the blood vessel system.
2. Automated Blood Vessel Detection in Cancer
2.1. Breast Cancer
Breast cancer is considered the leading cause of death worldwide among women. The incidence of commonly diagnosed cancers worldwide is 2.26 million cases, or 11.7% [35][6]. The accurate detection and analysis of morphometric features in lymphatic and blood vessel invasion (LBVI) are essential for understanding the progression of breast cancer and predicting lymph node metastases (LNM) [3,4][3][4]. A reliable sign of the vascular invasion of cancer is the presence of tumor cells in the lumen of the vessel. Currently, pathologists, when assessing the presence of vascular invasion of breast cancer cells, adhere to a clear distinction between lymphatic and blood vessels, since invasion in the former represents an increased risk of LNM, and in the latter a worse prognosis for survival and the risk of distant metastases [9,36,37][7][8][9]. Invasion is assessed both on the basis of biopsy specimens and in the surgical material, where the presence of invasion is conditionally designated as LBVI1, and the absence of its reliable signs as LBVI0 [3,4,9][3][4][7]. The morphometric features of LVI can provide important prognostic information that may not be readily apparent through manual assessment [6,38,39][10][11][12]. The expert experience embedded knowledge transfer learning (EEKT) model enables the extraction of these features by segmenting LBVIs in breast cancer histopathological images. The predictive value of morphometric features in LNM also extends to the location of LBVI within the tumor [9][7]. Peritumoral and intratumoral LBVIs have been found to exhibit distinct morphological characteristics, with peritumoral LBVIs being more commonly associated with cancer cell dissemination [9][7]. The EEKT model can quantify the location of LBVIs by calculating the distance between the LBVI center and the tissue center and margin. This information can provide further insight into the biological behavior of breast cancer and the probability of LNM. In a different approach, the problem was solved as a direct detection of pathological LVI regions in whole slide images. The model segmented blood vessels with the presence of tumor cells in lumens lined with endothelial cells. The described model demonstrated the ability to predict the occurrence of LNM in a group of LBVI-positive patients. Currently, the presence of LBVI has been demonstrated to possess high prognostic value in LNM prediction, and is routinely evaluated in combination with category T in TNM8, Ki-67 index, histologic grade (G) and immunophenotype. The model made it possible to obtain additional prognostic value from the shape features of LBVI areas: solidity, short-to-long-side ratio of the minimum rectangle, and LBVI-to- minimum-rectangle-area ratio [9][7]. Another finding of the study was that the count of the LBVI areas did not have the same predictive value as their morphology [9][7]. The use of this model means for the pathologist a quick and accurate search for LVI, helps to increase the efficiency of the work, and reduces the number of errors in the search for an important factor for predicting the disease [39][12]. For the patient, this means the selection of more personalized effective tactics for further observation and treatment [20][13].2.2. Lung Adenocarcinoma
The combined mortality caused by lung cancer is higher than for any other tumor (worldwide statistics: 1.79 million deaths; 18% incidence of death) [35][6]. In the case of lung cancer, including adenocarcinoma, there is no methodological separation of tumor invasion into lymphatic and blood vessels [40][14]. The assessment of vascular invasion (LV1 in the presence of invasion or LV0 in the absence of it) and microvascular density (MVD) in the tumor is important for the prediction of tumor metastasis and survival in histologic specimens [3,4][3][4]. To speed up the workflow and improve the accuracy of diagnosis, it is necessary to automate the search for vessels with the presence of tumor invasion, as well as the calculation of MVD. The application of AI and deep learning techniques has shown great potential in the analysis of histopathological images for various malignancies, including lung adenocarcinoma [10,11][15][16]. One such approach is the use of CNNs for microvessel detection in hematoxylin and eosin (H&E)-stained images of lung adenocarcinoma tissue [11][16]. This automated method can provide valuable insights into tumor angiogenesis, which plays a critical role in tumor growth, progression and metastasis (Figure 2).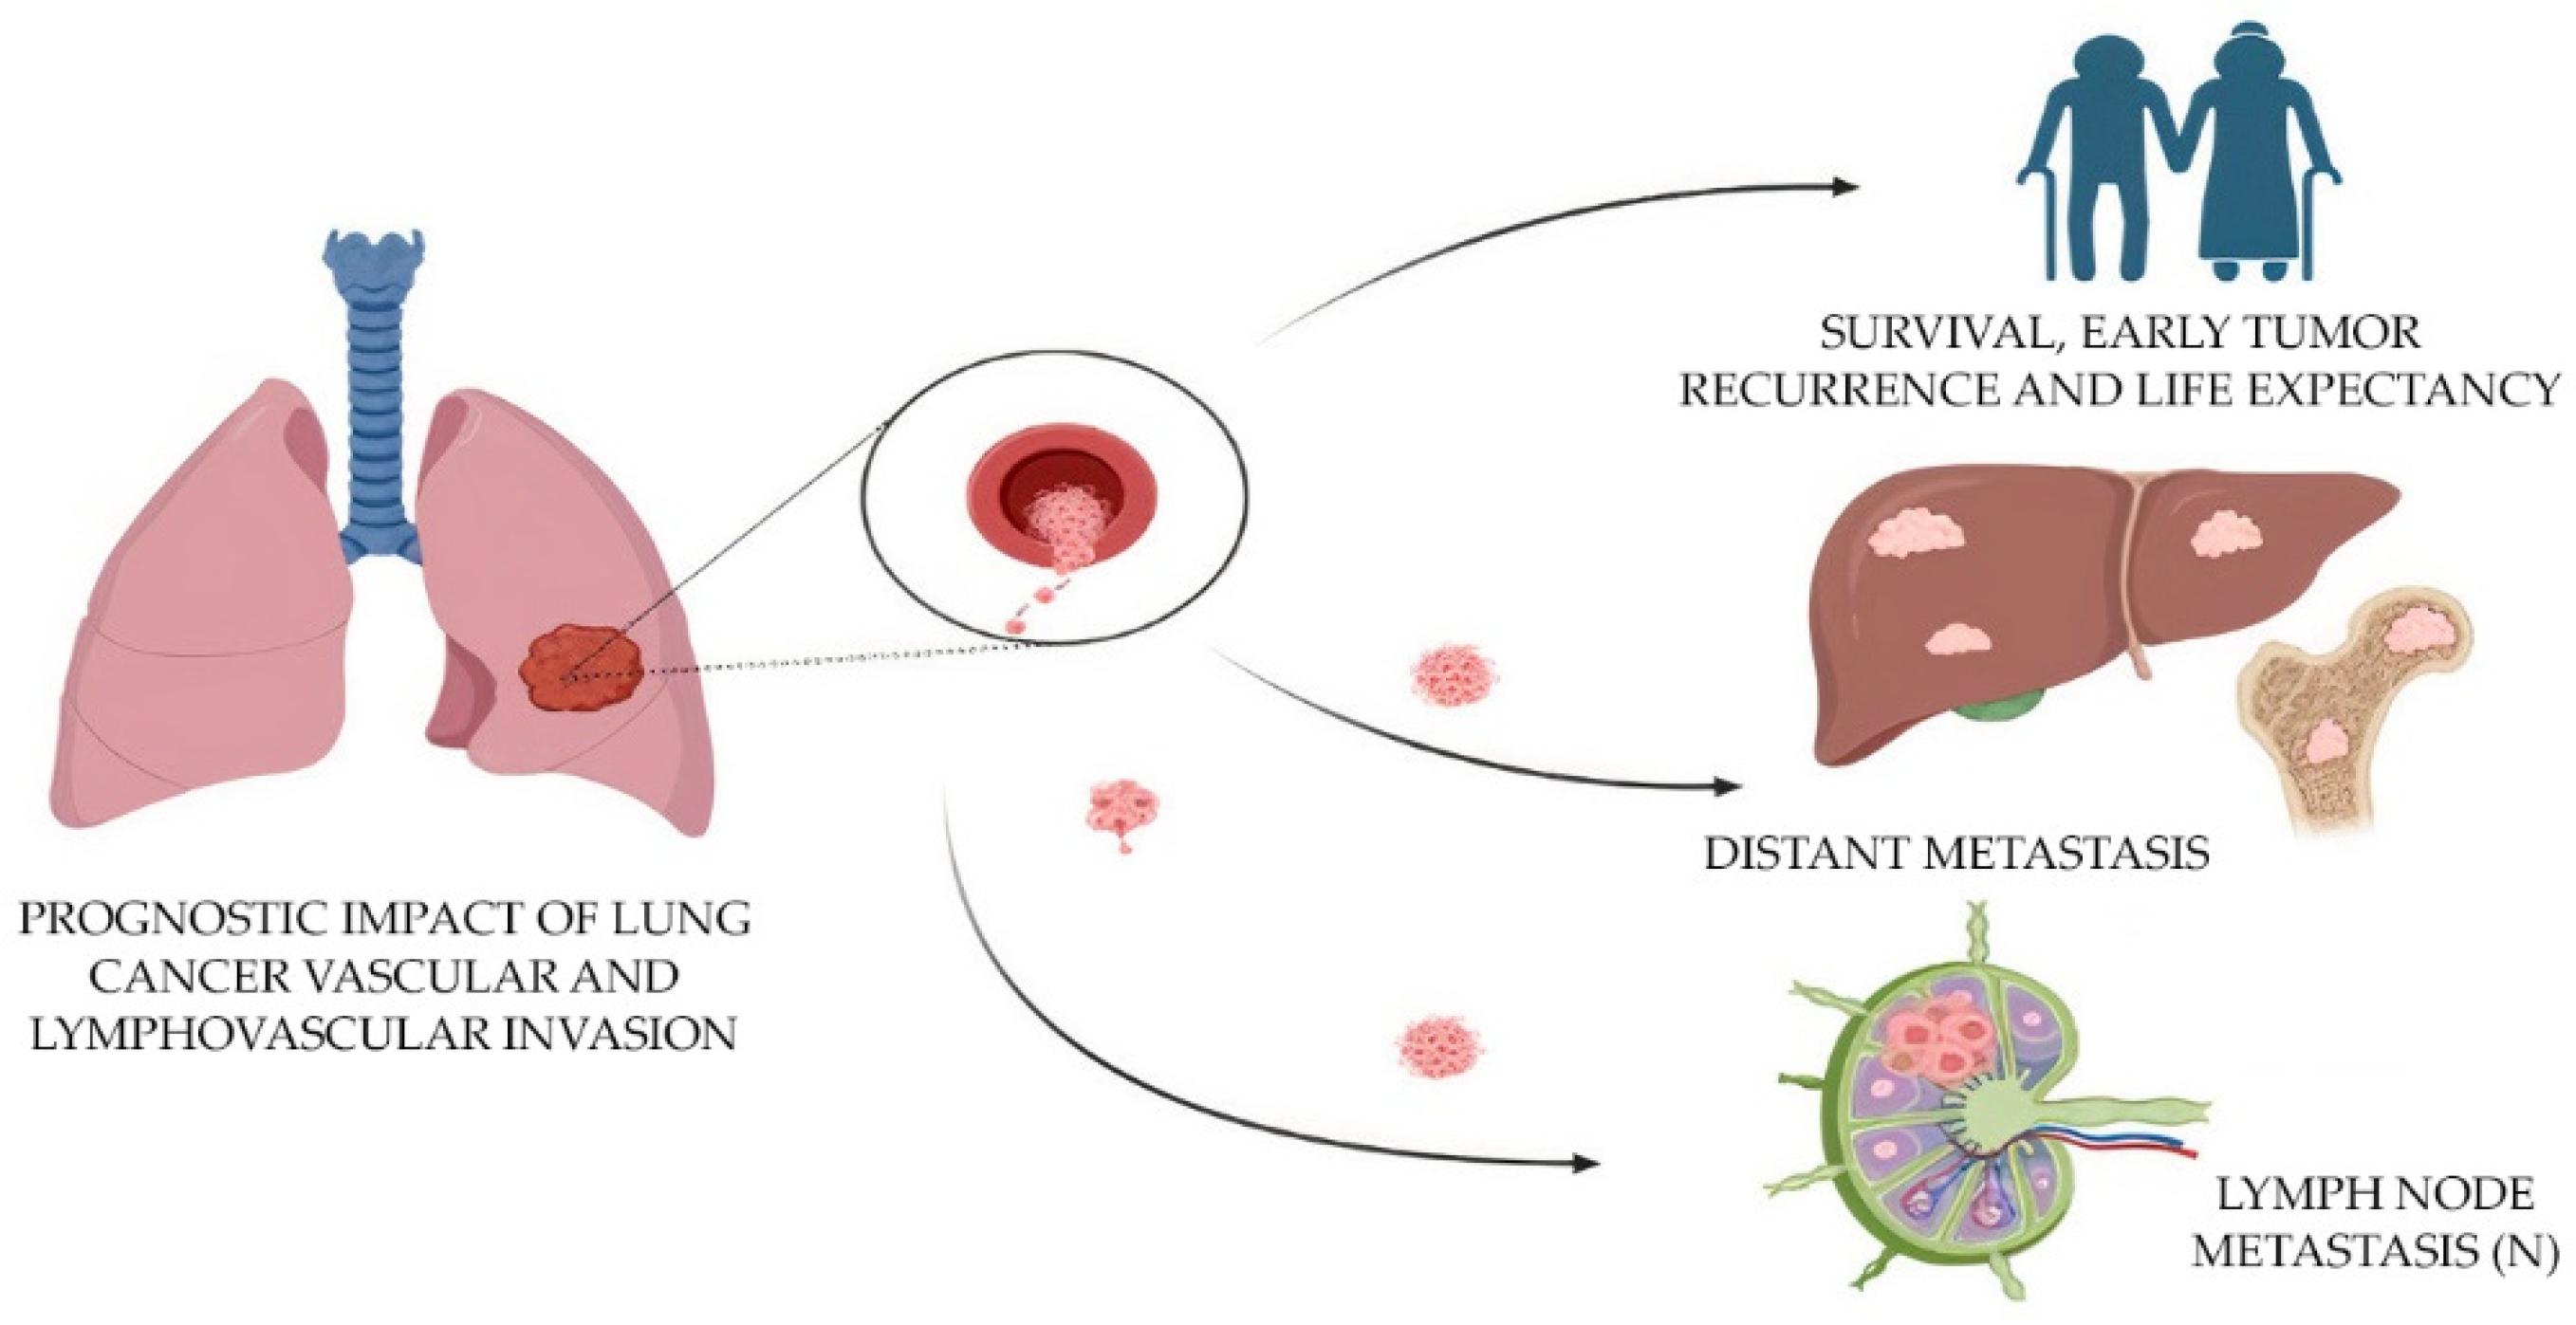
Figure 2. Prognostic impact of the evaluation of lymphovascular invasion in lung cancer.
2.3. Oral Squamous Cell Carcinoma
Oral squamous cell carcinoma (OSCC) is a prevalent and aggressive malignancy with a complex microvascular network [6][10]. The total incidence is 2%, and the total percentage of deaths is 1.8% [35][6]. Hypoxia is commonly seen in many solid tumors, including OSCC, due to rapid tumor growth that outstrips the supply of oxygen from existing blood vessels. Hypoxia can influence the behavior of tumor cells and contribute to angiogenesis and metastasis. Tumors often induce angiogenesis in order to supply themselves with the nutrients they need to grow. An increased number of blood vessels in and around the tumor might therefore be indicative of a more aggressive tumor. According to TNM 8 and CAP cancer protocols, lymphovascular invasion (LVI) and tumor angiogenesis have a strong correlation with cancer recurrence, metastasis and poor patient survival [3,4][3][4]. The accurate segmentation of microvessels in histological specimens can be considered a preliminary step in the objective identification of LVI and tumor angiogenic analysis [6][10]. The uncertainty-driven pooling deep learning architecture was applied for the segmentation of microvessels in H&E-stained images of OSCC tissue [6][10]. This novel approach incorporates uncertainty estimation into the learning process, allowing the model to better adapt to the inherent variability and noise present in histopathological images. This is particularly relevant for microvessel segmentation in OSCC, as the tumor-associated microvessels can exhibit a wide range of morphologies, sizes and staining characteristics, making them challenging to accurately detect and delineate [6][10]. The trained model was designed to incorporate spatial and morphological information from different pooling scales, enabling it to capture both fine-grained details and larger contextual information. By combining this multi-scale information with an uncertainty estimation mechanism, the model was able to adaptively adjust its predictions based on the local context and the degree of uncertainty in the image. The model achieved high accuracy and consistency, outperforming other state-of-the-art methods in terms of segmentation performance. By providing automated and objective measurements of microvessel density and distribution, the model has the potential to improve prognostic and predictive assessments in OSCC patients [6][10]. The same research group later reported the FABnet model, which was compared with the most popular neural networks in pathology tasks [12][17]. The FABnet segmentation model predicted uncertainty maps of nerves and microvessels. The prediction heatmaps obtained by FCN-8, U-Net, Segnet, DeepLabv3+ and the FABnet were shown as overlays on the original images. FABnet demonstrated a precision of 89.35%. The FABnet segmentation mask included only the vessel lumen with blood cell elements, which could limit its efficacy in cases where cancer cells invade the blood vessel wall [12][17]. The same group of researchers created a more advanced ResNeXt model for the detection of blood vessels and nerves, which showed 99.26% specificity. ResNeXt segmented both vessel lumens and walls, giving it a practical advantage over FABnet [12,13][17][18].2.4. Colorectal Cancer
Colorectal cancer (CRC) accounts for more than 1.85 million cases (9.8% of total cancer cases) and causes 850,000 deaths (9.2% of total cancer-related deaths) annually. CRC is the third-most common cause of cancer mortality worldwide [35][6]. During the colorectal cancer histological specimen examination for predicting tumor metastasis and determining the degree of its aggressiveness, parameters such as vascular density, angiogenesis and LVI are evaluated [3]. In addition, there is an instruction to separate parameters such as budding (tumor buds that are separated from the primary tumor), tumor satellites (these are tumor nests or nodes (macro- or microscopic) that are localized within 2 cm of the primary tumor) and deposits (isolated tumor foci not associated with the primary tumor and lymph node tissue) [3,4][3][4]. AI-based methods have been utilized to detect and quantify tumor blood vessels in CRC, and can provide valuable information regarding tumor aggressiveness, metastatic potential and survival prognosis [14][19]. Both vascular and lymphatic invasion are assessed, denoted by the single abbreviation LV1 [3,14][3][19]. A continuous hot spot probability map has been proposed to evaluate whole slide images. First, the preparations are additionally stained for the endothelial marker CD34, and the vessels in the tumor are extracted from the slides by segmentation (“hot spots”). Each such point is taken as a probability. This value gives the probability that an angiogenic hot spot is present at the corresponding location in the original image. The method gives three main results: first, it indicates whether the blood vessels in each tissue sample are randomly distributed or form statistically significant hot spots. Secondly, these hotspots can be accurately located in the image. Thirdly, each point is assigned an exact probability value [14][19]. Adipose tissue served as a strict control in the study, and no significant angiogenic points could be found in it. This method has prospective application in vessel segmentation and the statistical comparison of distributions in two- and three-dimensional space, making it possible to obtain a 3D heatmap of microvasculature [14][19]. Moving from microscopic structures, such as individual small vessels, to angiogenic hot spots of a certain size and distribution, it seems possible to change the measurement scale from micrometers to millimeters. Therefore, histological vascular patterns can be correlated with radiological findings (e.g., tumor perfusion) [14][19].2.5. Gastric Cancer
The total incidence of gastric cancer is 5.6%, and the total percentage of deaths is 7.7% [35][6]. In gastric cancer, the depth of invasion is an important prognostic factor that guides the course of treatment. Tumors that have invaded blood vessels may suggest a deeper and more advanced stage of disease. By assessing the involvement of blood vessels in the tumor tissue, pathologists can help determine the depth of invasion of the cancer. Lymphovascular invasion (LVI) is one of the most important prognostic factors in gastric cancer, as it indicates a higher probability of lymph node metastasis and a poorer overall outcome for the patient [15][20]. Both vascular and lymphatic invasion are assessed, denoted by the single abbreviation LV1 [4,10][4][15]. The blood vessels were segmented using an AI model for the purpose of LVI detection. The study used 88 whole slide images of histological specimens of gastric adenocarcinoma, which were additionally stained for CD34 and D2-40 vessel markers in a group of LVI+ patients. The ResNet 50, EfficeientNet B3, ConViT (Small) models were fine-tuned on the LVI datasets (Figure 3). For simultaneous localization of LVI regions, a single-stage YOLO object detection model was used, which significantly increased the accuracy of diagnosis. As a result, all LVI(+) patients were identified by the program [15][20]. This ensemble deep learning model was demonstrated to be robust and accurate, and it can be used as a valuable tool for pathologists in diagnosing gastric cancer and may help improve the accuracy of diagnosis and prognosis of the disease. This approach can be considered an alternative to traditional methods, and as a step toward computer-aided diagnosis systems in histopathology [10,15][15][20].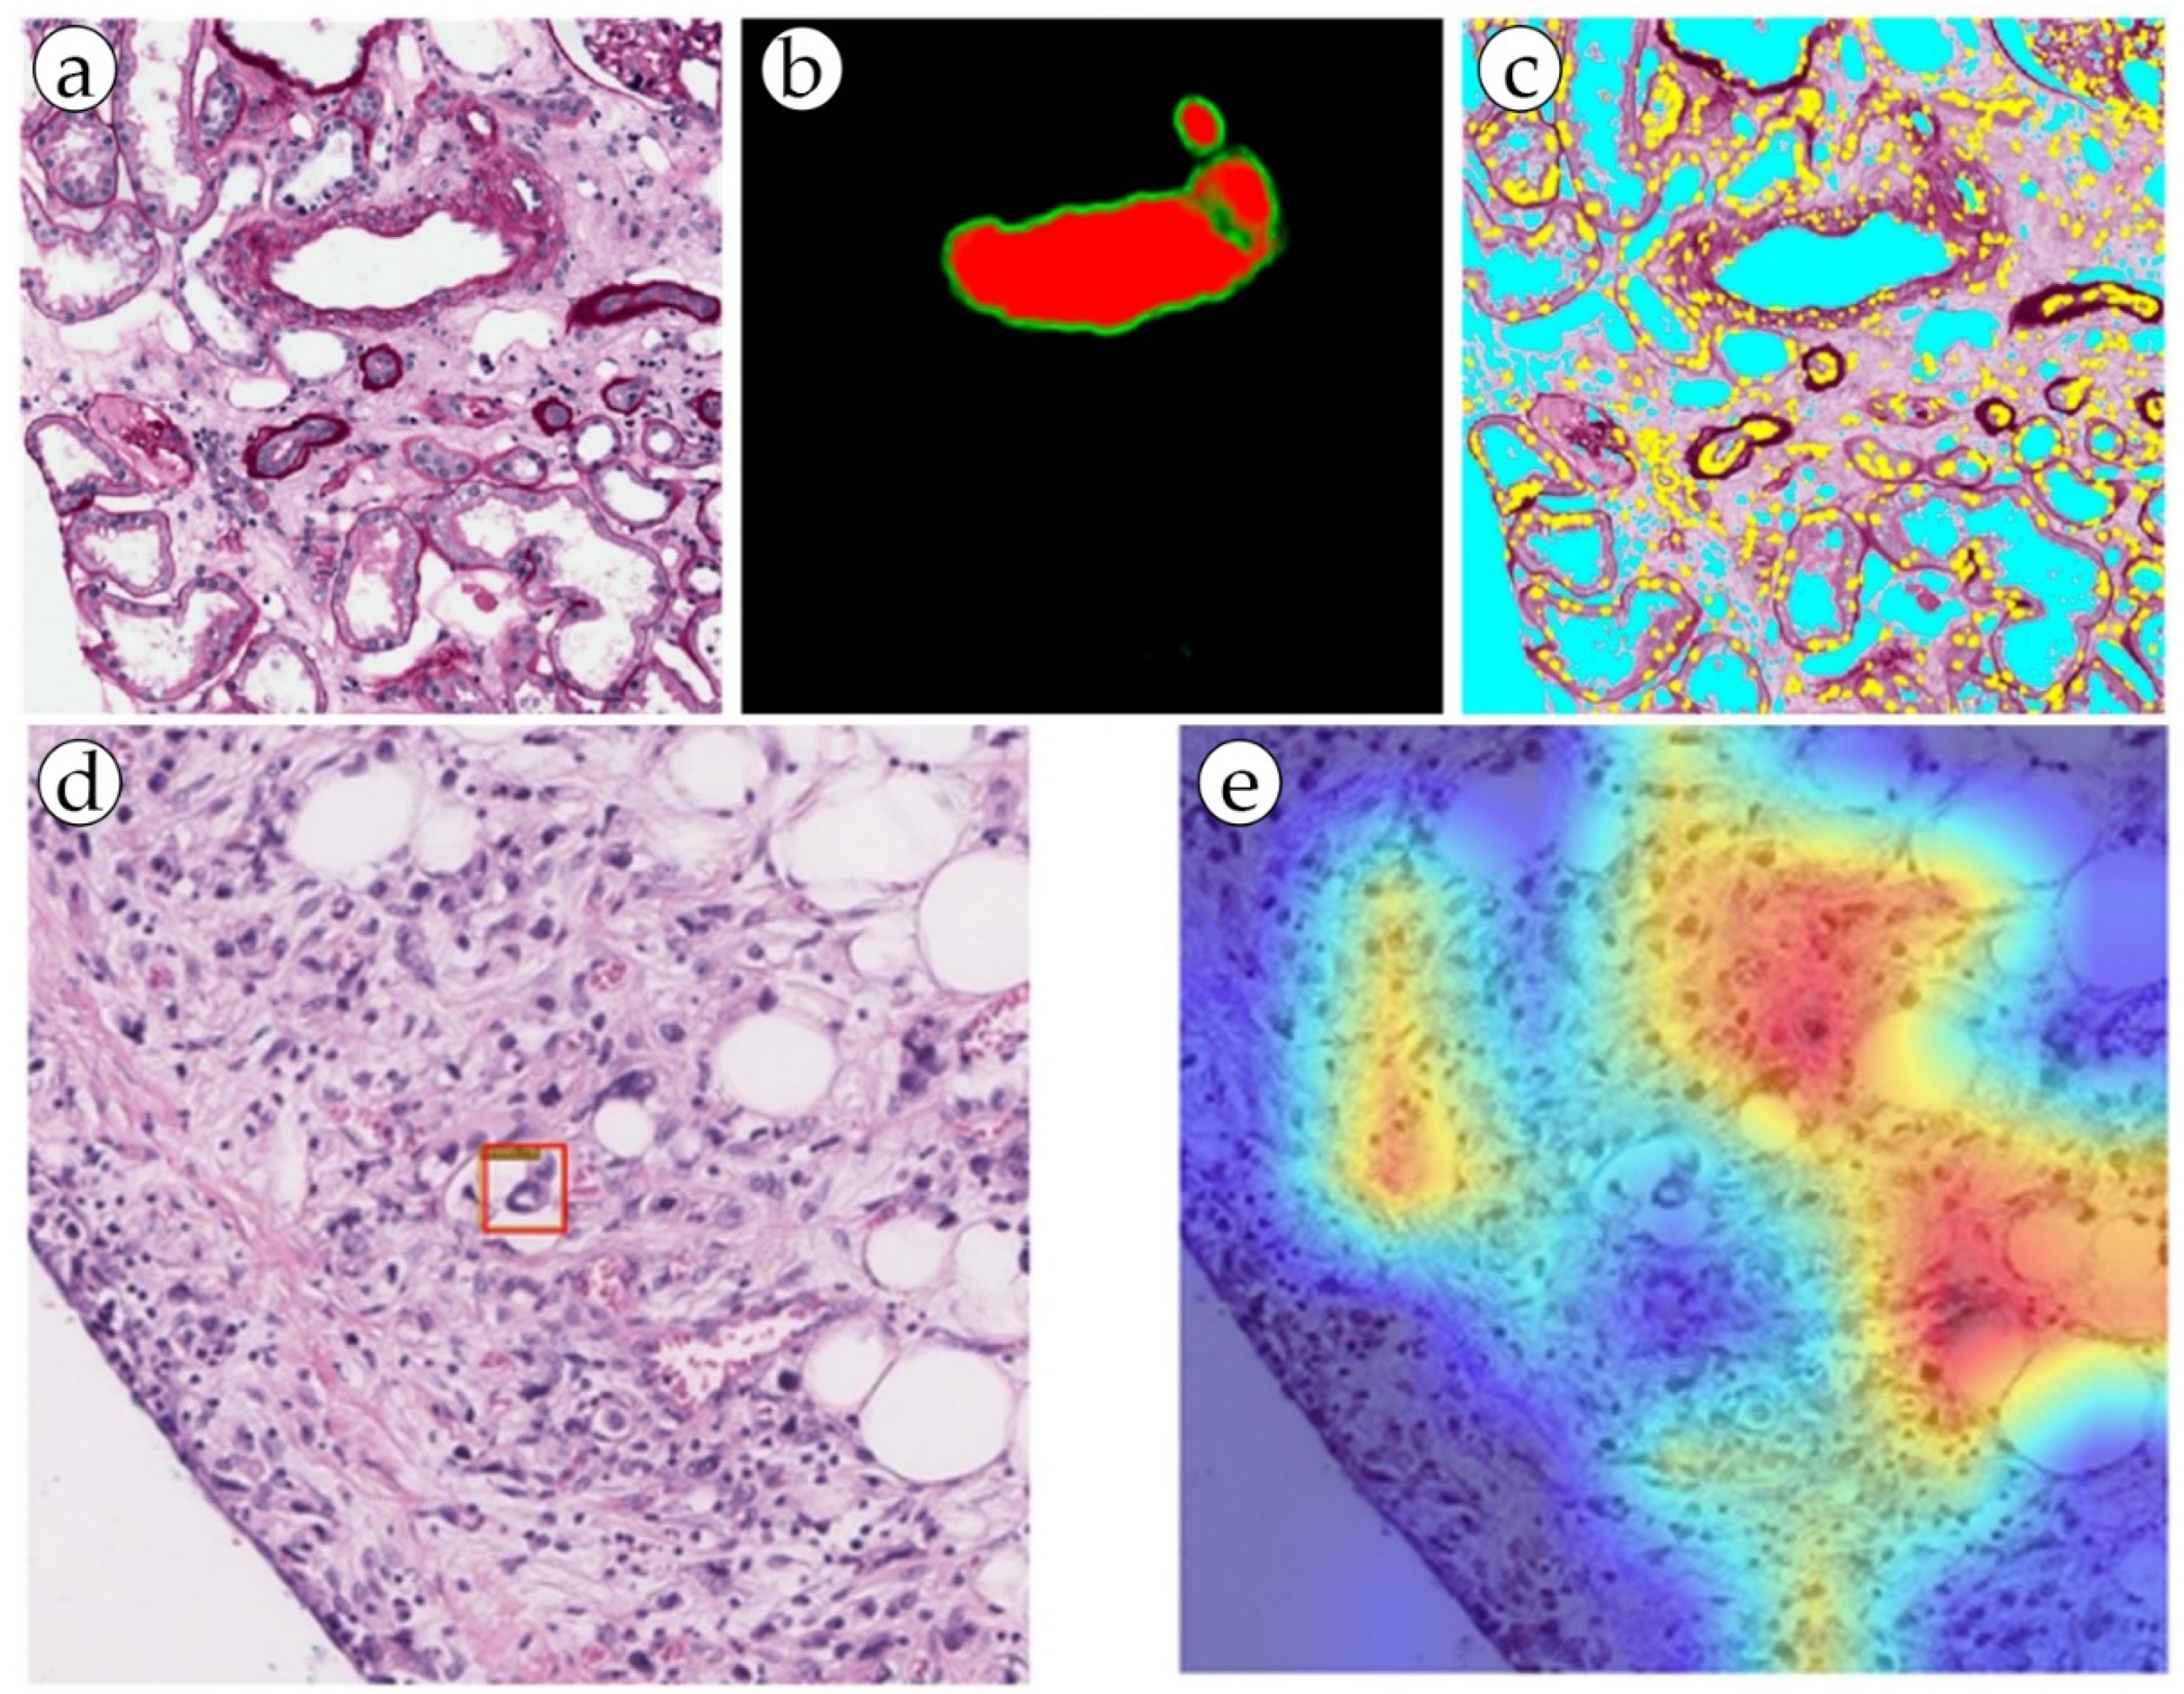
Figure 3. (a,b) Blood vessel detection by the RENFAST algorithm and (c) CNN cellular structure detection (yellow: nuclei; cyan: lumen). (d,e) Predictive LVI foci (marked with a red box) detection by dual filter (the ConVit and YOLOX models).
2.6. Glioblastoma
Glioblastoma is a highly aggressive brain tumor with poor prognosis. The total incidence of glioblastoma is 1.6%, the total percentage of deaths is 2.5% [35][6]. A characteristic feature of glioblastoma is pseudopalisading necrosis, which consists of zones of dead cells that appear to line up around areas of vascular necrosis. This pattern is related to the unique way these tumors grow by co-opting the brain’s blood vessels and then causing them to die. Glioblastoma is known for its ability to stimulate angiogenesis. A highly vascularized tumor is characterized by rapid growth and an aggressive course and requires the use of anti-angiogenetic drugs, such as bevacizumab [36][8]. Glioblastomas often exhibit microvascular proliferation with multiple layers of endothelial cells forming haphazardly arranged, thickened, and distorted vessels. The evaluation of blood vessels, along with other features, helps in grading the tumor, which is important for determining treatment plans and prognostication. In whole slide images with stains for CD31 and CD34 of glioblastoma histological preparations, microvasculature vessels were detected by creating segmentation masks. Remarkably, the model correctly detected vessels with and without slit-like lumen [16][21]. AI-based methods have shown the ability to accurately detect microvessels and assess their morphological features in glioblastoma, which can be associated with patient survival and response to therapy [17,18][22][23]. In both studies, CNNs were applied to classify glioma and glioblastoma biopsy images according to their grade of malignancy. The trained algorithm reached 96% accuracy, providing reliable support in decision making for pathologists when diagnosing tumor type [17,18][22][23]. A more difficult task for artificial intelligence was to determine the cellular subtypes of gliomas: oligodendrocytoma, anaplastic oligodendroma, astrocytoma, anaplastic astrocytoma and glioblastoma. The accuracy achieved was 87%, and the algorithm itself did not contain a mechanism for interpreting the obtained results [17,18][22][23]. One of the key benefits of using machine learning in oncological pathology is the integration of different types of data. A neural network was developed for predicting patient survival based on an analysis of the histological and genetic profiles of the tumor.2.7. Renal Cell Carcinoma
Renal cell carcinoma (RCC) is the most common type of kidney cancer, and it typically manifests as a highly vascular tumor. The total incidence of RCC is 2.2%, and the total percentage of deaths is 1.8% [35][6]. The presence, shape and size of blood vessels can help in distinguishing between different subtypes of RCC. For example, clear-cell RCC often has a rich network of tiny, thin-walled blood vessels, while papillary RCC might exhibit less vascularization [19][24]. AI-based methods have been employed to segment and quantify blood vessels in RCC tissue samples, demonstrating their ability to accurately detect microvessels and assess their morphological features. These findings can be associated with tumor stage, grade and patient survival, and can potentially inform treatment decisions and patient management strategies [19][24]. Leveraging the power of artificial intelligence, the proposed multi-task semi-supervised learning model achieved significant advancements in the area of blood vessel detection. By incorporating both labeled and unlabeled data, this model was able to minimize the dependency on the manual annotation of vascular networks, thereby streamlining the process of automatic segmentation. The model showcased an impressive performance, surpassing that of fully supervised learning models, and exhibited flexibility in its application across various types of tumor, including RCC. The model’s application accuracy for RCC stood at 0.78. The minor loss experienced was likely attributable to the intricate detection of smaller branches of blood vessels and slight variations in blood vessel thickness. The bulk of research in the digital pathology of kidneys that involves the segmentation of blood vessels addresses the problem of non-tumor diseases. It is important to detect blood vessels, distinguish elements such as the endothelium, measure wall thickness and hyalinosis level, and determine the presence or absence of inflammatory cells in a range of kidney pathologies [26,41,42][25][26][27]. These features are strictly necessary in order to perform a diagnosis of acute or chronic transplant rejection, some glomerulo- and vasculopathies, and level of kidney failure in patients with long-term primary of symptomatic hypertension (Figure 3 and Figure 4). In addition, a possible promising task may be the definition of arteritis and the degree of its severity [27,29,30][28][29][30].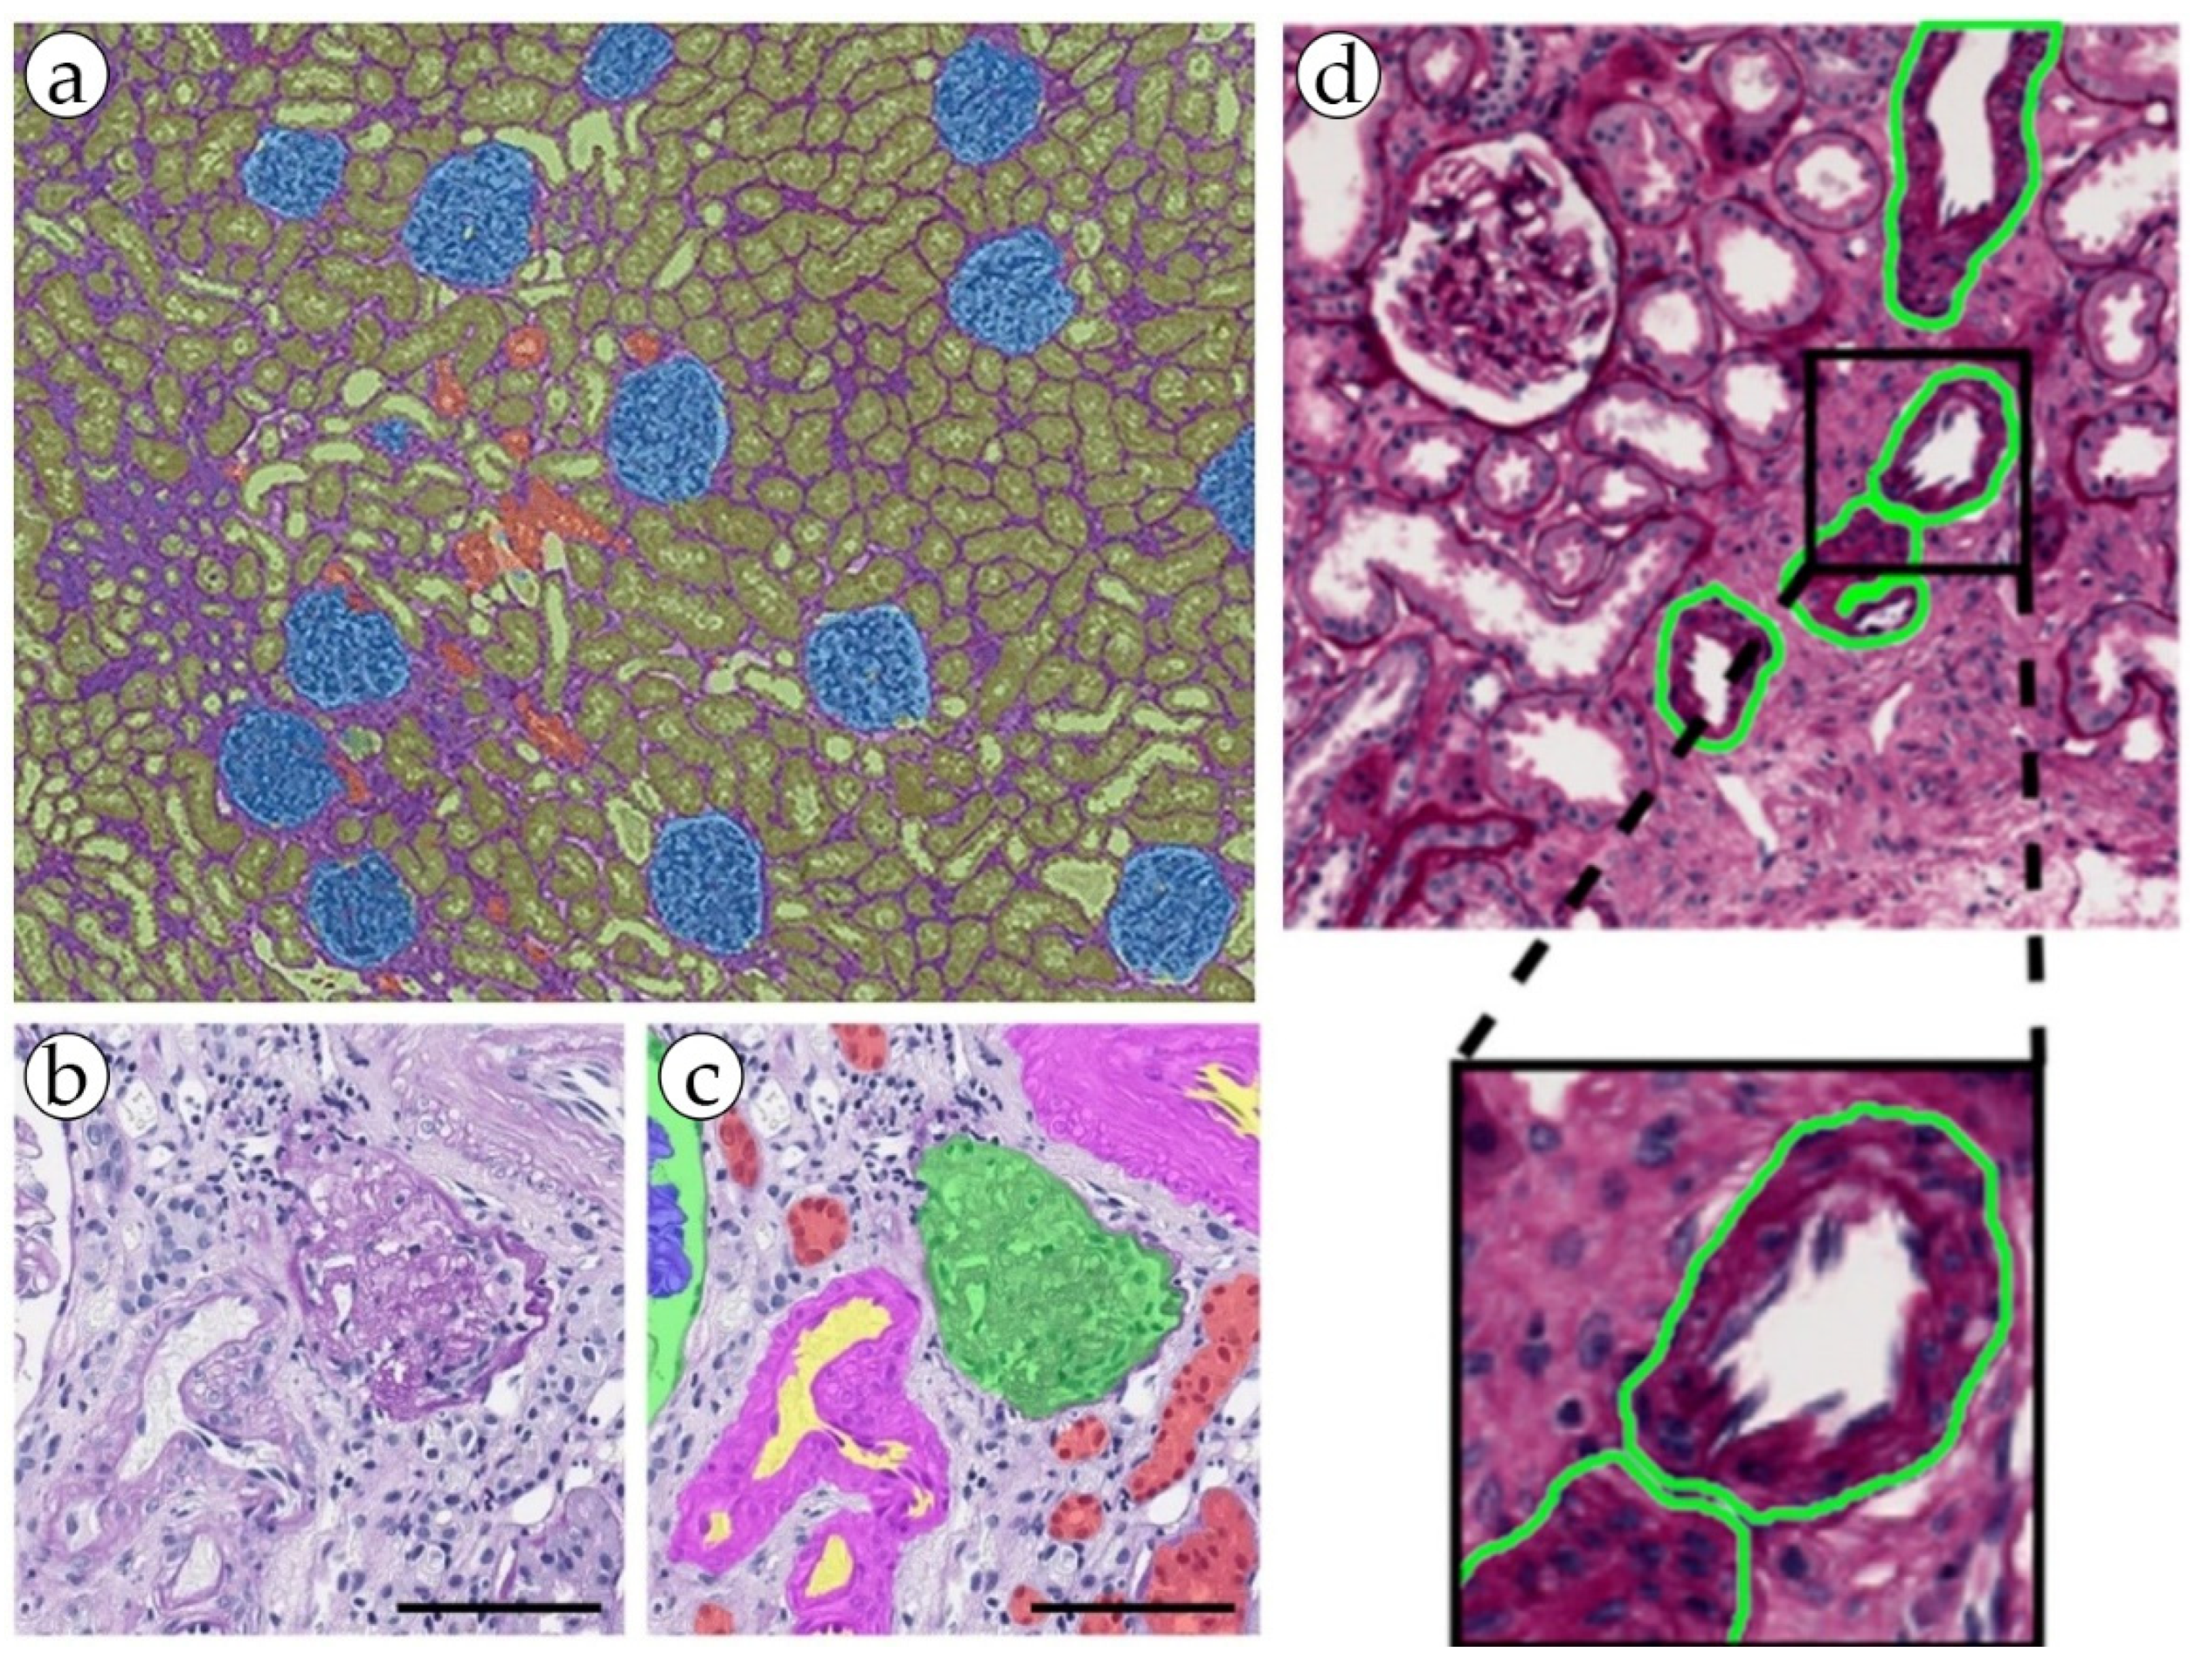
Figure 4. (a) An example of kidney structure segmentation by the DeepLab V3+ model. (b,c) nnU-Net kidney structure segmentation. (d) kidney blood vessel detection by the RENFAST algorithm.
2.8. Pancreatic Cancer
The total incidence of pancreatic cancer is 2.6%, and the total percentage of deaths is 4.7% [35][6]. In pancreatic cancer, the invasion of major blood vessels (e.g., the superior mesenteric artery or vein) can be a factor that makes the disease unresectable, meaning it cannot be completely removed by surgery [3,4][3][4]. This would typically be associated with a worse prognosis. Specific histologic subtypes of pancreatic cancer may have characteristic patterns of vascular invasion or angiogenesis. Identifying these can help in confirming the diagnosis. An important prognostic marker is the presence or absence of lymphovascular invasion: the tumor spreads along the collagen fibers of the stroma to the membranes of the vessels, and then into their lumen through the bloodstream. There are frequent cases of the detection of tumor cells in the tunica media and tunica adventitia in the absence of tumor emboli. For a reliable and accurate assessment of vascular invasion of carcinoma in such cases, the CODA model was proposed, which can restore large gaps in ductal and vascular structures in 3D format [31]. The principle of operation of the model is universal and can be applied in the diagnosis of other malignant tumors, such as breast cancer [31,32][31][32]. CODA stands for “Cellular Object Detection, Segmentation, and Classification”. It is a framework or methodology used to analyze and interpret digital pathology images with the goal of automating or assisting in the detection, segmentation, and classification of cellular objects within the images. CODA makes it possible to assess the extent of vascular or perineural invasion and precancerous lesions of the pancreas [31]. CODA gives the pathologist a spatial perspective of the course of blood vessels and their branching, and also allows the prediction of the direction of tumor growth into the walls of the blood vessels. Visualization of the bloodstream allows more objective measurements compared to the values of microvessel density. In addition, CODA makes complicated pathological features significantly more understandable, such as leaking vessels [31,32][31][32].References
- Lugano, R.; Ramachandran, M.; Dimberg, A. Tumor angiogenesis: Causes, consequences, challenges and opportunities. Cell Mol. Life Sci. 2020, 77, 1745–1770.
- Teleanu, R.I.; Chircov, C.; Grumezescu, A.M.; Teleanu, D.M. Tumor Angiogenesis and Anti-Angiogenic Strategies for Cancer Treatment. J. Clin. Med. 2019, 9, 84.
- Brierley, J.D.; Gospodarowicz, M.K.; Wittekind, C. TNM Classification of Malignant Tumours; John Wiley & Sons: Hoboken, NJ, USA, 2017.
- Cancer Protocol Templates|College of American Pathologists. Available online: https://www.cap.org/protocols-and-guidelines/cancer-reporting-tools/cancer-protocol-templates (accessed on 1 July 2023).
- Esteves, M.; Monteiro, M.P.; Duarte, J.A. The effects of vascularization on tumor development: A systematic review and meta-analysis of pre-clinical studies. Crit. Rev. Oncol. Hematol. 2021, 159, 103245.
- Chhikara, B.S.; Parang, K. Global Cancer Statistics 2022: The trends projection analysis. Chem. Biol. Lett. 2023, 10, 451.
- Chen, J.; Yang, Y.; Luo, B.; Wen, Y.; Chen, Q.; Ma, R.; Huang, Z.; Zhu, H.; Li, Y.; Chen, Y.; et al. Further predictive value of lymphovascular invasion explored via supervised deep learning for lymph node metastases in breast cancer. Hum. Pathol. 2023, 131, 26–37.
- Szklener, K.; Mazurek, M.; Wieteska, M.; Waclawska, M.; Bilski, M.; Mandziuk, S. New Directions in the Therapy of Glioblastoma. Cancers 2022, 14, 5377.
- Chen, J.M.; Luo, B.; Ma, R.; Luo, X.X.; Chen, Y.S.; Li, Y. Lymphatic Endothelial Markers and Tumor Lymphangiogenesis Assessment in Human Breast Cancer. Diagnostics 2021, 12, 4.
- Fraz, M.; Shaban, M.; Graham, S.; Khurram, S.A.; Rajpoot, N.M. Uncertainty driven pooling network for microvessel segmentation in routine histology images. In Proceedings of the Computational Pathology and Ophthalmic Medical Image Analysis: First International Workshop, COMPAY 2018, and 5th International Workshop, OMIA 2018, Held in Conjunction with MICCAI 2018, Granada, Spain, 16–20 September 2018; pp. 156–164.
- AbdulJabbar, K.; Raza, S.E.A.; Rosenthal, R.; Jamal-Hanjani, M.; Veeriah, S.; Akarca, A.; Lund, T.; Moore, D.A.; Salgado, R.; Al Bakir, M.; et al. Geospatial immune variability illuminates differential evolution of lung adenocarcinoma. Nat. Med. 2020, 26, 1054–1062.
- Zhang, S.; Zhang, D.; Yi, S.; Gong, M.; Lu, C.; Cai, Y.; Tang, X.; Zou, L. The relationship of lymphatic vessel density, lymphovascular invasion, and lymph node metastasis in breast cancer: A systematic review and meta-analysis. Oncotarget 2017, 8, 2863–2873.
- Jayapandian, C.P.; Chen, Y.; Janowczyk, A.R.; Palmer, M.B.; Cassol, C.A.; Sekulic, M.; Hodgin, J.B.; Zee, J.; Hewitt, S.M.; O’Toole, J.; et al. Development and evaluation of deep learning-based segmentation of histologic structures in the kidney cortex with multiple histologic stains. Kidney Int. 2021, 99, 86–101.
- Mollberg, N.M.; Bennette, C.; Howell, E.; Backhus, L.; Devine, B.; Ferguson, M.K. Lymphovascular invasion as a prognostic indicator in stage I non-small cell lung cancer: A systematic review and meta-analysis. Ann. Thorac. Surg. 2014, 97, 965–971.
- Yi, F.; Yang, L.; Wang, S.; Guo, L.; Huang, C.; Xie, Y.; Xiao, G. Microvessel prediction in H&E Stained Pathology Images using fully convolutional neural networks. BMC Bioinform. 2018, 19, 64.
- Vu, Q.D.; Graham, S.; Kurc, T.; To, M.N.N.; Shaban, M.; Qaiser, T.; Koohbanani, N.A.; Khurram, S.A.; Kalpathy-Cramer, J.; Zhao, T.; et al. Methods for Segmentation and Classification of Digital Microscopy Tissue Images. Front. Bioeng. Biotechnol. 2019, 7, 53.
- Fraz, M.M.; Khurram, S.A.; Graham, S.; Shaban, M.; Hassan, M.; Loya, A.; Rajpoot, N.M. FABnet: Feature attention-based network for simultaneous segmentation of microvessels and nerves in routine histology images of oral cancer. Neural Comput. Appl. 2019, 32, 9915–9928.
- Rasool, A.; Fraz, M.M.; Javed, S. Multiscale unified network for simultaneous segmentation of nerves and micro-vessels in histology images. In Proceedings of the 2021 International Conference on Digital Futures and Transformative Technologies (ICoDT2), Islamabad, Pakistan, 20–21 May 2021; pp. 1–6.
- Kather, J.N.; Marx, A.; Reyes-Aldasoro, C.C.; Schad, L.R.; Zollner, F.G.; Weis, C.A. Continuous representation of tumor microvessel density and detection of angiogenic hotspots in histological whole-slide images. Oncotarget 2015, 6, 19163–19176.
- Noh, M.-g.; Lee, J.; Cha, S.; Kim, J.; Kim, J.J.; Kim, N.; Gal, S.G.J.; Choi, Y.-D.; Kang, S.-R.; Song, G.-Y.; et al. Ensemble Deep Learning Model to Predict Lymphovascular Invasion in Gastric Cancer. 2023; preprint.
- de Castelbajac, M. Automated Segmentation of Blood Vessels in Immuno-Stained Whole Slide Images; PRAT: Paris, France, 2023.
- Zadeh Shirazi, A.; McDonnell, M.D.; Fornaciari, E.; Bagherian, N.S.; Scheer, K.G.; Samuel, M.S.; Yaghoobi, M.; Ormsby, R.J.; Poonnoose, S.; Tumes, D.J.J.B.J.o.C. A deep convolutional neural network for segmentation of whole-slide pathology images identifies novel tumour cell-perivascular niche interactions that are associated with poor survival in glioblastoma. Br. J. Cancer 2021, 125, 337–350.
- Li, X.; Tang, Q.; Yu, J.; Wang, Y.; Shi, Z. Microvascularity detection and quantification in glioma: A novel deep-learning-based framework. Lab. Investig. 2019, 99, 1515–1526.
- Xiao, R.; Ambrosetti, D.; Descombes, X. Multi-task Semi-supervised Learning for Vascular Network Segmentation and Renal Cell Carcinoma Classification. In Proceedings of the Resource-Efficient Medical Image Analysis: First MICCAI Workshop, REMIA 2022, Singapore, 22 September 2022; pp. 1–11.
- Salvi, M.; Mogetta, A.; Meiburger, K.M.; Gambella, A.; Molinaro, L.; Barreca, A.; Papotti, M.; Molinari, F. Karpinski Score under Digital Investigation: A Fully Automated Segmentation Algorithm to Identify Vascular and Stromal Injury of Donors’ Kidneys. Electronics 2020, 9, 1644.
- Barisoni, L.; Lafata, K.J.; Hewitt, S.M.; Madabhushi, A.; Balis, U.G.J. Digital pathology and computational image analysis in nephropathology. Nat. Rev. Nephrol. 2020, 16, 669–685.
- Asadzadeh, S.; Khosroshahi, H.T.; Abedi, B.; Ghasemi, Y.; Meshgini, S. Renal structural image processing techniques: A systematic review. Ren. Fail. 2019, 41, 57–68.
- van der Laak, J.; Litjens, G.; Ciompi, F. Deep learning in histopathology: The path to the clinic. Nat. Med. 2021, 27, 775–784.
- Lee, J.; Warner, E.; Shaikhouni, S.; Bitzer, M.; Kretzler, M.; Gipson, D.; Pennathur, S.; Bellovich, K.; Bhat, Z.; Gadegbeku, C.; et al. Unsupervised machine learning for identifying important visual features through bag-of-words using histopathology data from chronic kidney disease. Sci. Rep. 2022, 12, 4832.
- Farris, A.B.; Vizcarra, J.; Amgad, M.; Cooper, L.A.D.; Gutman, D.; Hogan, J. Artificial intelligence and algorithmic computational pathology: An introduction with renal allograft examples. Histopathology 2021, 78, 791–804.
- Kiemen, A.L.; Braxton, A.M.; Grahn, M.P.; Han, K.S.; Babu, J.M.; Reichel, R.; Jiang, A.C.; Kim, B.; Hsu, J.; Amoa, F.; et al. CODA: Quantitative 3D reconstruction of large tissues at cellular resolution. Nat. Methods 2022, 19, 1490–1499.
- Kiemen, A.L.; Damanakis, A.I.; Braxton, A.M.; He, J.; Laheru, D.; Fishman, E.K.; Chames, P.; Perez, C.A.; Wu, P.H.; Wirtz, D.; et al. Tissue clearing and 3D reconstruction of digitized, serially sectioned slides provide novel insights into pancreatic cancer. Med 2023, 4, 75–91.
More