Your browser does not fully support modern features. Please upgrade for a smoother experience.
Please note this is a comparison between Version 2 by Camila Xu and Version 1 by Buket Barkana.
Breast cancer is the second most common cancer in women who are mainly middle-aged and older. Due to these reasons, computer-aided detection (CADe) and computer-aided diagnosis (CADx) systems help assist physicians and experts in increasing the success rate of the analysis/diagnosis. The role of a CADe system focuses on the localization of a specific object or region of interest (ROI), as the particular area of interest is specific to the task.
- breast cancer
- computer-aided diagnosis (CAD)
- machine learning
1. Introduction
Breast cancer is projected to account for 1 in 3 new female cancers yearly in the United States (US) [1]. The survival rate for breast cancer is measured in 5-year intervals, considered relative survival rates, and does not consider the cause of death. The ACS study reported that the 5-year survival rate is 90%, the 10-year survival rate is 84%, and the 15-year survival rate is 80% [2]. According to the American Cancer Society (ACS) in the US, an estimated 287,850 new cases of invasive breast cancer will be diagnosed in women in 2022. In addition, 51,400 new cases of ductal carcinoma in situ (DCIS) are expected to be diagnosed, and approximately 43,250 deaths would occur in US women [1]. The World Health Organization (WHO) reported that breast cancer accounted for 12% of all new annual cancer cases worldwide and had become the most common form of cancer diagnosed globally as of 2021 [3]. The latest statistics state that an estimated 684,996 women died of breast cancer worldwide in 2020, and 2,261,419 new breast cancer cases were diagnosed worldwide in 2020 [4].
With technological advancements and healthcare systems, breast cancer survival rates have increased. Many variables can affect the survival rate of someone diagnosed with breast cancer. Most importantly, an early diagnosis can immensely increase the chances of survival. Recent technological advances have allowed for computer-aided detection methods to assist in diagnosing this form of cancer. The systems and tools commonly incorporated into cancer diagnosis are mammograms, ultrasounds, magnetic resonance imaging (MRI), and histopathology images.
2. Basics and Background
Mammography techniques have been a diagnostic tool since the 1960s, and the ACS has officially recommended them since 1976 [17][5]. A mammogram uses low-dose amplitude X-rays to examine the breast [18][6]. The X-rays are part of a screening process and typically involve several breast X-rays. Mammograms show tumors and microcalcifications that may indicate cancer [18][6]. Mammography has aided in decreasing the mortality rate in women with breast cancer by 25–30% compared to a control group spanning 5 to 7 years [19][7]. It is reported that the doses of radiation required to produce mammograms are considerably low [18][6]. The use of ultrasounds in breast imaging dates back to 1951, when Wild and Neal described the characteristics of two breast tumors, one benign and one malignant, in an intact human breast [20][8]. In breast ultrasounds, sound waves are used, and their echoes can construct computer representations of the inside of a breast. A transducer device moves over the skin and sends sound waves that bounce off breast tissue. The transducer then picks up the reflected sound waves and uses them to construct 2D images. They can detect changes in the breast, such as fluid-filled cysts [21,22][9][10]. The efficacy of ultrasound screening alone in asymptomatic women will likely cause false positive and negative results. Therefore, a mammogram with an automated whole breast ultrasound (AWBU) is better in cases of dense-breasted women. According to a study by Kelly et al., 87% of cancer detections aided by AWBU were found in 68% of studies of women with dense breasts [19,23][7][11]. Ultrasounds can also be used in breast cancer detection, specifically when guiding a biopsy needle into a region of interest in the breast for cells to be taken out and tested for cancer. Unlike mammograms, an ultrasound introduces minimal risk to a patient because it does not expose a person to radiation [22][10]. The breast MRI was first brought into use in the late 1980s. According to a study in 1986 by Heywang et al., preliminary results indicated that an MRI of breasts using gadolinium administration showed increased enhancement relative to normal breast tissue [24][12]. In an MRI, the hydrogen nucleus, abundant in water and fat, is used for imaging. The magnetic property of the nucleus is used in conjunction with radio waves and strong magnets, creating a detailed picture of the inside of a breast [19,25][7][13]. Breast MRI is typically used for women at high risk for breast cancer. It is usually paired with a mammogram because an MRI alone can miss specific cancers that can be found with a mammogram. Once cancer has been diagnosed, a breast MRI can be done to help localize the cancer, determine its exact size, and look for other tumors in the breast. Unlike mammograms, an MRI uses strong magnets instead of radiation to make detailed cross-sectional pictures of the body by taking pictures from different angles. Therefore, there is no exposure to radiation during this procedure [25][13]. The first breast biopsies were performed in the 1850s and 1860s by Skey, Sir James Paget, and John Eric Erichsen [26][14]. A biopsy involves a physician removing small pieces of breast tissue from areas of interest that can be further analyzed in a laboratory to determine if cancer cells are present [27][15]. A breast biopsy is usually ordered to check a palpable lump or mass, examine a problem seen on a mammogram, and determine whether a breast lump or mass is either malignant or benign [28][16]. The diagnoses are carried out by pathologists looking at histopathology images and examining them for signs indicating benign or malignant cancer. Biopsy extraction techniques are ultrasound-guided, mammographic-stereotactic-guided, magnetic resonance-guided, fine-needle aspiration, core needle, vacuum-assisted core, and surgical biopsy [28,29][16][17]. See Figure 31.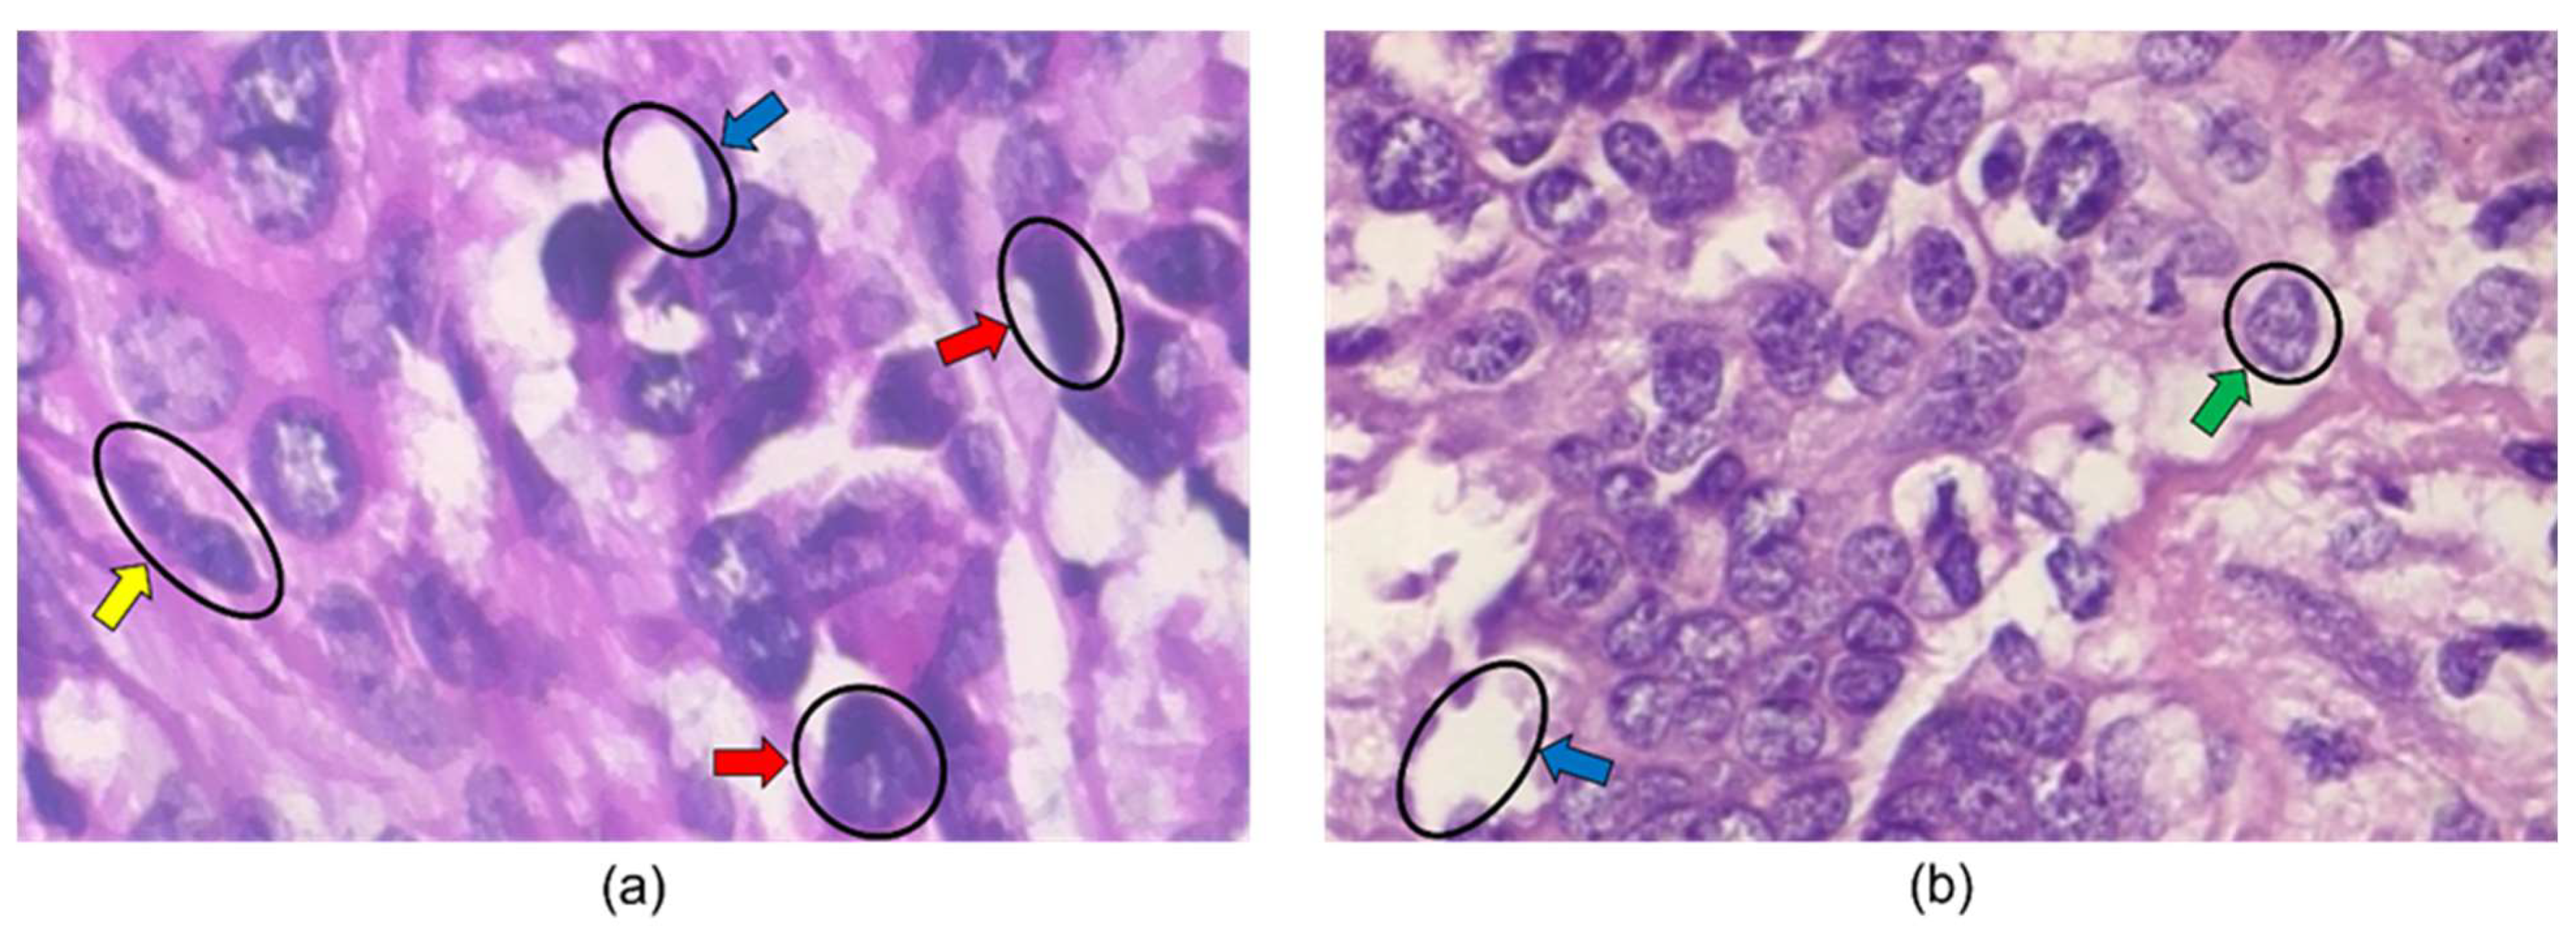
Figure 31. Histopathology images from BreakHis 400× dataset. The blue, green, yellow, and red arrows indicate adipose tissue, a cell nucleus, a mitotic figure, and large nuclei in the images. The image in (a) is labeled malignant, while the image in (b) is labeled benign.
3. Classification/Detection/Diagnosis Algorithms
The classifier is a determining step in CADe and CADx systems’ algorithmic processes. After utilizing all the information acquired in the feature engineering process, classification algorithms can be trained for diagnosis and detection. Figure 52 illustrates the classifier approaches between 2010 and 2022.
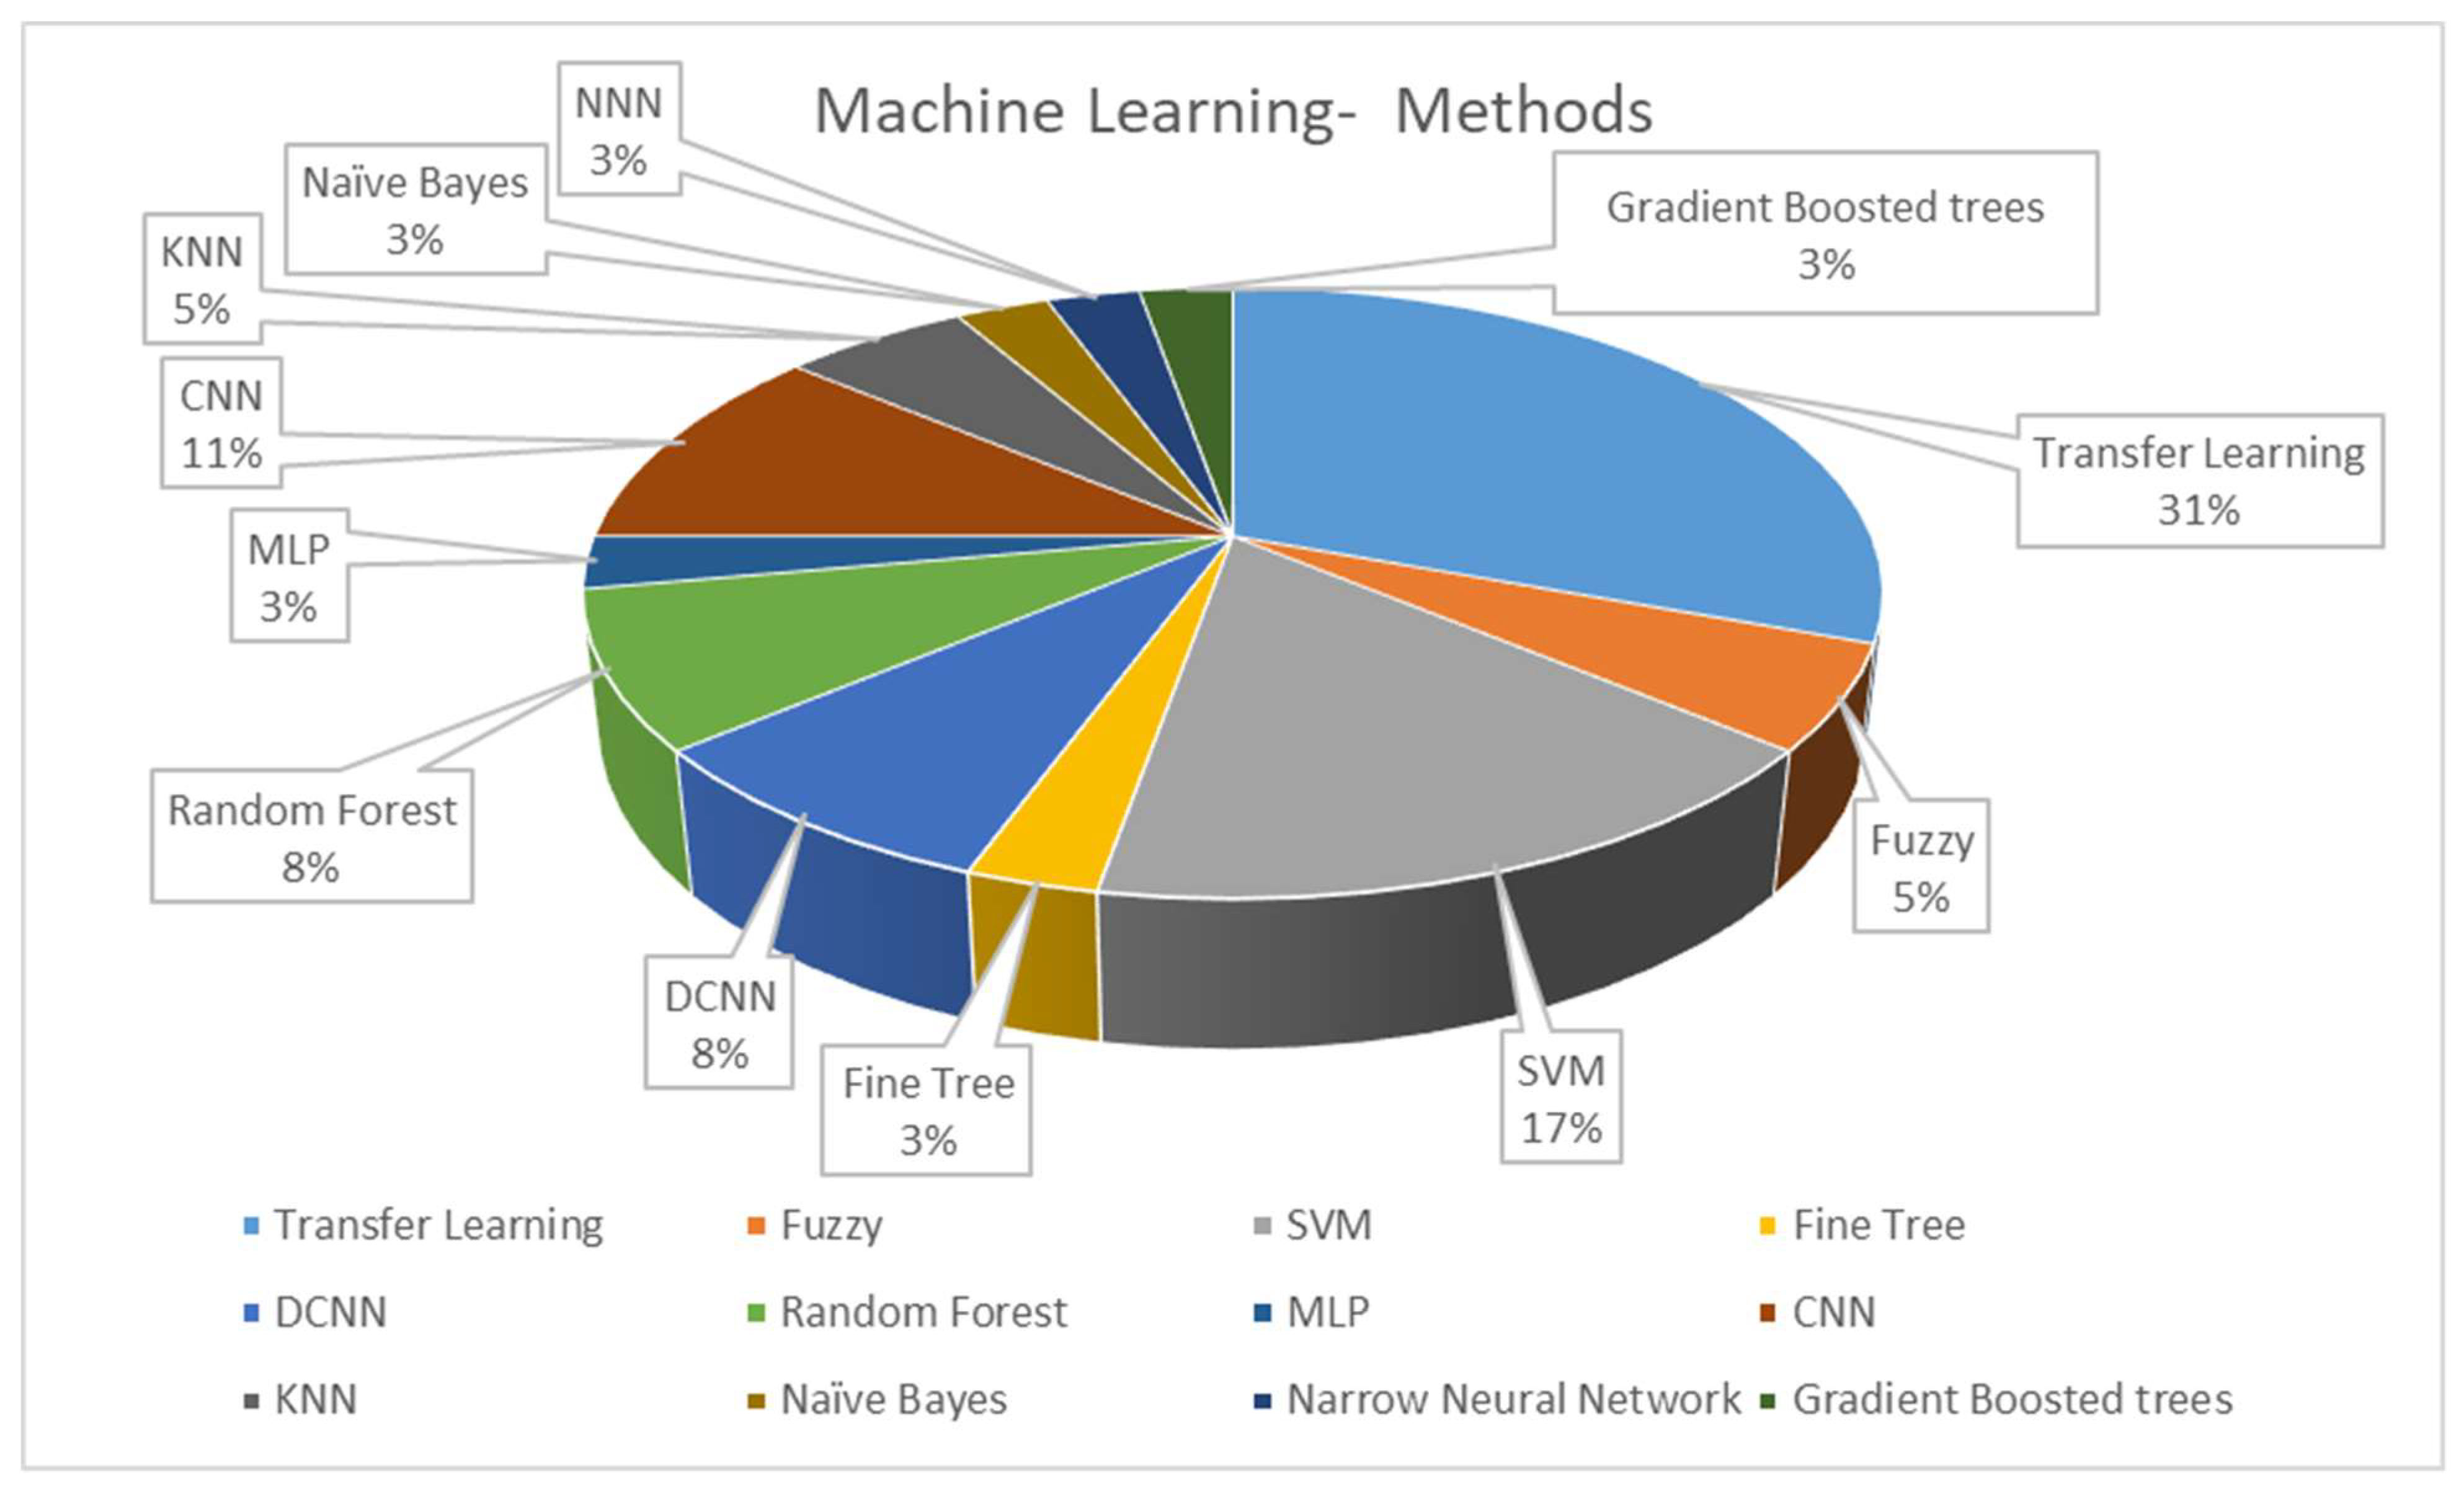
Figure 52.
Distribution of the machine learning methods in CADe and CADx systems using breast histopathology images.
The work in [70][19] implemented support vector machines, random forests, and Naïve Bayes classifiers as part of their classification architecture. Majority voting was applied to all three classification outputs after getting individual classifications from the classifiers to get the most accurate output. Their system performed well and adequately identified mitosis’s occurrence throughout the four different stages of mitosis. It had an accuracy of 86.38% for detecting mitotic cells in the MITO-ATYPIA 14 dataset.
Noumah et al. used colored stained images to develop an architecture that consisted of three pre-trained deep convolutional neural networks (DCNN) that worked in parallel. The output of each branch was passed onto a global average pooling layer, and the output of the three layers was then concatenated into one layer with 4640 neurons. Finally, dense layers were used to convert the 4640 neurons into two classes, either benign or malignant. Overall, their suggested model performed at an accuracy of 98% in determining the nature of a tumor [41][20].
Lin et al. proposed a framework comprising three stages: adversarial learning for domain adaptation, target domain data selection based on entropy, and model refinement with selected data and pseudo-labels. The atrous spatial pyramid pooling (ASPP) module was used to encode multiscale information into feature maps; this is directly followed by an upsampling layer with softmax output, which then upsamples the output dimensions to the input dimensions [60][21].
Jiang et al. used a specific classification task. They implemented it using an input-collaborative PSV-ConvNet that performs an end-to-end with no image color normalization and domain knowledge [71][22]. Yari et al. focused on a binary and multi-classification approach that could discern malignant and benign cases and different breast cancer types in the images. Their proposed model worked on magnification-dependent and magnification-independent classification methods and used ResNet50 transfer learning to supplement the low volume of the BreakHis dataset, which was not large enough for proper training. Using ResNet50 decreased the training error when implementing a standard optimization algorithm to train the network [75][23].
Karthiga et al. used the fine-tuned pre-trained models Alexnet and VGG-16 to achieve better performance classification. DCNN and transfer learning methods were also implemented for binary and multiclass classification. For the CNN, an architecture of 15 deep layers was used with learning parameters to implement the design [72][24]. Li et al. used various classifiers for their classification architecture, including a random forest model, a 3-degree polynomial SVM, an SVM with a radial basis function kernel, and a multilayer perception with four hidden layers. In binary classification, if the number of features was greater than the number of ROIs in a given task, principal component analysis (PCA) was performed to reduce the number of features to 20 dimensions. When classifying multiclass scenarios, a U-net extension with a separate branch for diagnostic classification was used [61][25].
Hirra et al. used fine-tuning as the second stage of deep belief network learning. During this portion of the learning, the model is assigned class labels. Then, they developed a model formed by the feature matrix of images from their design’s training portion to classify cancerous and non-cancerous regions. Logistic regression was used to classify the patches identified in the histopathology images [54][26].
Enhanced routing was used in [74][27] to assist in classification by optimizing routing coefficients indirectly and adaptively by modifying the loss function and embedding the routing process into the training process to learn routing coefficients.
Vaka et al. used SVM, random forest, multilayer perceptron (MLP), a type of deep artificial neural network, and eXtreme Gradient Boost (Xgboost), which is a library based on the gradient increase framework and can be used for regression and sorting [55][28].
Labrada and Barkana used four machine-learning algorithms to classify histopathology images from the BreakHis dataset, including decision trees, SVM, K-nearest neighbors, and narrow neural networks, in conjunction with PCA, to reduce the dimensionality of the dataset. The different feature sets were tested with each classifier, and their performance was recorded. Also, the feature sets were tested with each classifier as an entire group to gauge the performance of all feature sets working together. The most favorable result was obtained using all 33 features of the combined feature sets and a narrow neural network (NNN) that achieved an accuracy of 96.9% [73][29].
Yang et al. used a guided soft attention network to classify breast cancer histopathology images. A multi-task learning framework was implemented to design a CNN that could learn the ROI mask from the global image and guide the focus of the classification network [76][30].
Vo et al. used multiscale breast cell-extracted features and used them to train gradient-boosting tree classifiers. Combining the boosting tree classifiers with a DCNN achieved favorable classification results. A model combining majority voting and gradient-boosting trees achieved higher accuracy and sensitivity scores [45][31].
References
- Cancer Facts & Figures 2022. American Cancer Society. Available online: https://www.cancer.org/research/cancer-facts-statistics/all-cancer-facts-figures/cancer-facts-figures-2022.html (accessed on 16 August 2022).
- Stump-Sutliff, K.A. Breast Cancer: What Are the Survival Rates? WebMD. Available online: https://www.webmd.com/breast-cancer/guide/breast-cancer-survival-rates (accessed on 16 August 2022).
- U.S. Breast Cancer Statistics. Breastcancer.org. 13 January 2022. Available online: https://www.breastcancer.org/symptoms/understand_bc/statistics (accessed on 16 August 2022).
- Breast Cancer—Metastatic: Statistics|cancer.net. Available online: https://www.cancer.net/cancer-types/breast-cancer-metastatic/statistics (accessed on 17 August 2022).
- Accardi, T. Mammography Matters: Screening for Breast Cancer—Then and Now. Available online: https://www.radiologytoday.net/archive/rt0517p7.shtml#:~:text=Although%20the%20concept%20of%20mammography,Society%20to%20officially%20recommend%20it (accessed on 24 August 2022).
- Mammograms. National Cancer Institute. Available online: https://www.cancer.gov/types/breast/mammograms-fact-sheet (accessed on 24 August 2022).
- Sree, S.V. Breast Imaging: A survey. World J. Clin. Oncol. 2011, 2, 171.
- Dempsey, P.J. The history of breast ultrasound. J. Ultrasound Med. 2004, 23, 887–894.
- Breast Ultrasound. Johns Hopkins Medicine. 8 August 2021. Available online: https://www.hopkinsmedicine.org/health/treatment-tests-and-therapies/breast-ultrasound#:~:text=A%20breast%20ultrasound%20is%20most,some%20early%20signs%20of%20cancer (accessed on 24 August 2022).
- What Is a Breast Ultrasound?: Breast Cancer Screening. American Cancer Society. Available online: https://www.cancer.org/cancer/breast-cancer/screening-tests-and-early-detection/breast-ultrasound.html (accessed on 24 August 2022).
- Kelly, K.M.; Dean, J.; Comulada, W.S.; Lee, S.-J. Breast cancer detection using automated whole breast ultrasound and mammography in radiographically dense breasts. Eur. Radiol. 2009, 20, 734–742.
- Heywang, S.H.; Hahn, D.; Schmidt, H.; Krischke, I.; Eiermann, W.; Bassermann, R.; Lissner, J. MR imaging of the breast using gadolinium-DTPA. J. Comput. Assist. Tomogr. 1986, 10, 199–204.
- What Is a Breast MRI: Breast Cancer Screening. American Cancer Society. Available online: https://www.cancer.org/cancer/breast-cancer/screening-tests-and-early-detection/breast-mri-scans.html (accessed on 24 August 2022).
- History of Breast Biopsy. Siemens Healthineers. Available online: https://www.siemens-healthineers.com/mammography/news/history-of-breast-biopsy.html (accessed on 24 August 2022).
- Breast Biopsy: Biopsy Procedure for Breast Cancer. American Cancer Society. Available online: https://www.cancer.org/cancer/breast-cancer/screening-tests-and-early-detection/breast-biopsy.html (accessed on 24 August 2022).
- Breast Biopsy. Johns Hopkins Medicine. 8 August 2021. Available online: https://www.hopkinsmedicine.org/health/treatment-tests-and-therapies/breast-biopsy (accessed on 24 August 2022).
- Versaggi, S.L.; De Leucio, A. Breast Biopsy. Available online: https://www.ncbi.nlm.nih.gov/books/NBK559192/ (accessed on 24 August 2022).
- Barkana, B.D.; Saricicek, I. Classification of Breast Masses in Mammograms using 2D Homomorphic Transform Features and Supervised Classifiers. J. Med. Imaging Health Inform. 2017, 7, 1566–1571.
- Rehman, M.U.; Akhtar, S.; Zakwan, M.; Mahmood, M.H. Novel architecture with selected feature vector for effective classification of mitotic and non-mitotic cells in breast cancer histology images. Biomed. Signal Process. Control 2022, 71, 103212.
- Al Noumah, W.; Jafar, A.; Al Joumaa, K. Using parallel pre-trained types of DCNN model to predict breast cancer with color normalization. BMC Res. Notes 2022, 15, 14.
- Lin, Z.; Li, J.; Yao, Q.; Shen, H.; Wan, L. Adversarial learning with data selection for cross-domain histopathological breast cancer segmentation. Multimed. Tools Appl. 2022, 81, 5989–6008.
- Jiang, H.; Li, S.; Li, H. Parallel ‘same’ and ‘valid’ convolutional block and input-collaboration strategy for Histopathological Image Classification. Appl. Soft Comput. 2022, 117, 108417.
- Yari, Y.; Nguyen, H.; Nguyen, T.V. Accuracy improvement in binary and multiclass classification of breast histopathology images. In Proceedings of the 2020 IEEE Eighth International Conference on Communications and Electronics (ICCE), Phu Quoc Island, Vietnam, 13–15 January 2021.
- Karthiga, R.; Narashimhan, K. Deep Convolutional Neural Network for computer-aided detection of breast cancer using histopathology images. J. Phys. Conf. Ser. 2021, 1767, 012042.
- Li, B.; Mercan, E.; Mehta, S.; Knezevich, S.; Arnold, C.W.; Weaver, D.L.; Elmore, J.G.; Shapiro, L.G. Classifying breast histopathology images with a ductal instance-oriented pipeline. In Proceedings of the 2020 25th International Conference on Pattern Recognition (ICPR), Milan, Italy, 10–15 January 2021.
- Hirra, I.; Ahmad, M.; Hussain, A.; Ashraf, M.U.; Saeed, I.A.; Qadri, S.F.; Alghamdi, A.M.; Alfakeeh, A.S. Breast cancer classification from histopathological images using patch-based Deep Learning Modeling. IEEE Access 2021, 9, 24273–24287.
- Wang, P.; Wang, J.; Li, Y.; Li, P.; Li, L.; Jiang, M. Automatic classification of breast cancer histopathological images based on deep feature fusion and enhanced routing. Biomed. Signal Process. Control 2021, 65, 102341.
- Vaka, A.R.; Soni, B.; Reddy, S. Breast cancer detection by leveraging machine learning. ICT Express 2020, 6, 320–324.
- Labrada, A.; Barkana, B.D. Breast cancer diagnosis from histopathology images using supervised algorithms. In Proceedings of the 2022 IEEE 35th International Symposium on Computer-Based Medical Systems (CBMS), Shenzen, China, 21–23 July 2022.
- Yang, H.; Kim, J.-Y.; Kim, H.; Adhikari, S.P. Guided Soft Attention Network for classification of breast cancer histopathology images. IEEE Trans. Med. Imaging 2020, 39, 1306–1315.
- Vo, D.M.; Nguyen, N.-Q.; Lee, S.-W. Classification of breast cancer histology images using incremental boosting convolution networks. Inf. Sci. 2019, 482, 123–138.
More