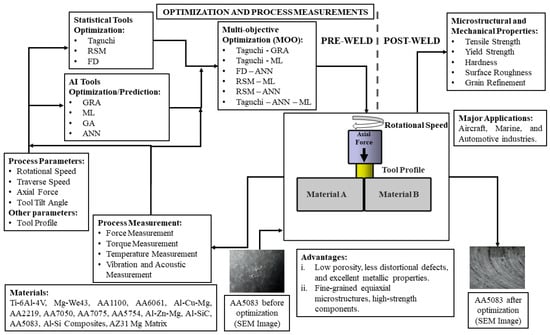
The important friction stir welding process (FSW) parameters affecting the joint quality are the rotational speed, tilt angle, traverse speed, axial force, and tool profile geometry.
- friction stir welding
- process parameters
- optimization
1. Introduction
2. Friction Stir Welding (FSW)
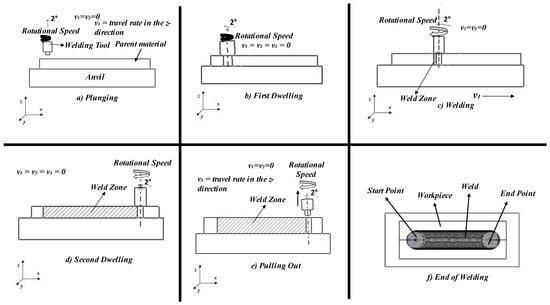
2.1. Process Description
2. Friction Stir Welding (FSW)
2.1. Process Description
-
Plunge: the non-consumable tool thrusts into the workpiece at a specific RS up to a certain depth.
-
Dwell: the tool stays in that position for some time.
-
Traverse: The tool advances along the path at a specific speed.
-
Tool Retract: the tool comes back from the BM to a certain height.
2.1.1. Process Parameters
The RS, TS, depth of insertion into the material surface, and tilt angle are the major parameters affecting joint quality. High RS implies high heat generation [1,19,21][1][19][28]. The tool RS creates a frictional localized heat between the tool and the workpiece [48][29]. High TS or traverse speed leads to a fast procedure and the formation of defects [49][30]. Tool RS is related to the quantity of the weld, while traverse speed relates to the quality of the weld. As friction between the tool and the workpiece governs heating, a higher rotational speed is desired to mix the materials better. A high RS generates a large amount of heat that is transferred from the tool to the tool–material interface. When traversed at a slow speed along the weld line, the high amount of heat results in better quantity and quality of weld. This refers to the rate of cooling taking place during welding. Apart from the parameters mentioned above, tool design variables like tool shape, material, size, and surface features also play a pivotal role. Threaded, tapered, conical, square, pedal, and cylinder with threaded pin profiles are commonly used for friction stir welding [50,51][31][32].Effect of Process Parameters
Various studies have been carried out to determine the effect of process parameters on mechanical and microstructural properties. As mentioned above, proper mixing of materials is essential for a sound joint. A high RS results in adequate heat generation and proper mixing of materials. Based on studies in the literature, it was observed that high RS leads to softer plasticization of the material, turbulent material flow, and coarse grains in the NZ. It was also observed that with an increase in RS, the UTS of the joint increases to a certain value, and a further increase in RS decreases the UTS. At high TS, insufficient stirring occurs, and the material does not flow enough from advancing to the retreating side. The UTS, percentage elongation, and hardness decrease with increased TS. This is attributed to insufficient cooling of plasticized material, reducing the softened area. Though limited data are available regarding axial force, the material flow pattern depends on the axial force. A lower axial force results in tunnel defects at the bottom of the weld zone, and a higher axial force results in flash on either side of the weld. Axial force is also responsible for the plunge depth of the pin and plays an important role in propelling plasticized material to complete the extrusion process in the weld zone.2.1.2. FSW Modelling
Noreña et al. [57][33] proposed a model consisting of a set of algebraic equations showing how mass and energy in terms of power consumption are transformed along the process to predict the soundness of the joint. This model was developed for conducting the welding process on non-dedicated FSW machines. To solve the problem of varying axial forces due to improper clamping and deformation of back support, Zhao et al. [58][34] developed an axial force controller with time delay compensation. The controller was developed based on the linear–quadratic regulator (LQR) technique.2.1.3. Microstructure
An analytical model was proposed considering several assumptions (based on sliding, sticking, and partial sliding/sticking contact conditions between the rotating tool surface and welding specimen) on heat generation corresponding to material characteristics [65][35]. A cylindrical probe and conical shoulder made up the tool configuration. The plunge force and experimental torque results were identified to establish the contact condition. The observations revealed a relationship between plunge force and heat generation in a sliding state. The interface between the tool and matrix had sticking contacts. Song et al. [66][36] proposed a 3-dimensional heat transfer model corresponding to the dynamic coordinate system. The heat produced by the tool pin and shoulder was considered in the control equation to define the heat transfer control equation for the welding stage of the process, which occurs while the tool is moving at a constant speed along the weld joint line. Initial and boundary conditions were defined, and the heat flux was adjusted to zero to maintain the measured temperature below the material melting temperature. Longer preheat times increased the specimen’s initial temperature in front of the tool pin, reducing material yield stress, making welding easier, and protecting the tool from being worn out. Tool–material contact produces heat and deformation of the material. Heat increases the dislocation density by raising the possibility of dislocation rearrangement and deformation, resulting in refined equiaxed grains at the NZ [1,2,19,21,65][1][2][19][28][35]. A post-weld heat treatment (PWHT) factor analysis (temperature range of 200–400 °C for 1 and 4 hrs, speed of 950 rpm, axial force of 2.3 kN, and tilt angle of 1°) was conducted for a threaded conic tool on the microstructure and corrosion behavior at the NZ of AZ31 Mg alloy sheets [67][37]. The grain sizes of 470 µm and 776 µm after 1 hr and 4 hr holding time corresponded to the temperature range of 300–350 °C. Corrosion resistance increased with a decrease in grain size. The agglomeration of Al11Mn4 intermetallic compounds around Al8Mn5 particles increased the PWHT temperature and holding time. At 300 °C for 1 hr, PWHT showed maximum corrosion resistance.2.1.4. Materials (Alloys and Composites)
FSW can be applied to nickel–titanium shape memory alloys (SMAs) without causing any impact to the transformation temperature [71][38]. The method of joining steel to aluminum have limitations such as limited weldability, formation of pores, intermetallic oxide inclusions, and hot cracks [72][39]. FSW has been proven to overcome these limitations [2]. Experiments were conducted using a tungsten–rhenium tool with a different set of factors (with varying rotational speed (350, 400, 450 rpm) and maintaining a TS, dwell period, and tilt angle of 75 mm/min, 30 s, and 2.5°, respectively), which evaluated the mechanical, microstructure, corrosion behavior of parts. A grain size of 20.4 ± 1.8 µm was observed at the stir zone at 400 rpm. The joint efficiency was kept at a room temperature of 93% and an elevated temperature of 84%. At room temperature (martensite phase), tensile loading showed that the material had more strain hardening than the BM. At 125 °C (austenite phase), the alloy showed an elastoplastic tensile response, and no super elasticity was observed. At elevated ambient temperatures, microcracks perpendicular to tensile loading were observed in the stir zone.
2.1.5. FSW Machines
Three types of machines are utilized for FSW, as stated in the literature:-
Conventional milling machines.
-
Custom-made FSW machines.
-
Specialized robots designed for FSW.
2.2. Summary
The following observations are made by highlighting the major points.-
Tool RS is related to heat generation, while TS relates to heat supply to the weld region.
3.1. Statistical Tools
3.1.1. Taguchi Optimization
Taguchi is a statistical method used to improve the quality of manufactured products. Dr. Genichi Taguchi developed it in 1978. He framed plans using experimentation called design of experiments (DoE) to make robust systems [109][42]. There are eight steps involved in Taguchi optimization:-
Determine the primary function of any process.
-
To find various noise factors, test conditions, and quality characteristics.
-
Define the objective function.
-
Categorize different elements and provide value to them.
-
Select the correct orthogonal matrix for multiple experiments.
-
Experimentation.
-
Investigation of data and prediction of optimum level of performance.
-
Verification of experiments conducted and plan of future action.
-
The Taguchi matrix design for experimentation resulted in a cost-effective technique for parametric analysis and optimization.
-
Taguchi’s method focused on the performance value rather than the individual performance limit or range value.
-
Taguchi designed different experimental matrices; therefore, individual matrix selection relies mainly on the investigator’s choice. The factors (individual, curvature, and interaction) and levels affecting the responses are to be considered by the investigator during the matrix or orthogonal array selection process.
-
The Taguchi method optimizes only one response at once.
-
The Taguchi method is applied to narrow down the main process parameter (i.e., focused on reducing the process parameters by conducting limited experiments and analyzing the output performance).The optimal setting for one response might not be true for the other.
-
Taguchi’s OA does not test various combinations of process parameters, and the method does not consider the dynamic changes in the values.
-
The Taguchi method can only optimize the process in offline mode.
-
The model does not explain the process mechanics.
-
The models fit data corresponding to first- or second-order polynomials and do not explain all curvature information.
-
An increase in independent variables increases the practical experiments, resulting in low prediction.
-
The models are best suited to analyze and optimize a few independent variables.
3.1.4. Factorial Design (FD)
In experiments that require the study of more than two factors, FD is an effective technique. The FD method tests all sets of factors and levels. For example, if the x and y levels for each factor are X and Y, then xy combinations are possible. In general, there are n replicates [148][53]. It is the most preferred DoE technique when there are few parameters [149][54]. FSW of AA7475-T7 lap joint properties (mechanical and microstructure) were evaluated [150][55]. Full factorial designed (FFD) experiments (say, 27) were conducted corresponding to three factors (RS: 1000–1400 rpm, traverse speed: 20–36 mm/min, and plunge speed rate: 0.04–0.08 mm/s) operating at three levels, and the joint strength and hardness were analyzed. RS contributed more towards UTS and hardness. The optimal conditions (RS: 1400 rpm, traverse speed: 30 mm/min, and plunge speed rate: 0.06 mm/s) resulted in 172.88 MPa and a hardness of 200 HV, compared with the initial condition of 130 MPa and 125 HV. FSW of AA1100 aluminum rolled plates was examined for mechanical and microstructural characterizations [151][56]. Two-level FFD of experiments (say, eight) with different sets of RS: 1100–1500 rpm, traverse speed: 20–60 mm/min, and PD: 0.1–0.5 mm were conducted, and the joint strength was analyzed. The regression model developed from the experimental data examined the factor’s effect on strength. Tool RS contributed more toward axial thrust and torque forces. A significant decrease in the two forces was observed. Microstructural studies revealed grain size refinement with increased factors (0.48 to 0.36 microns for RS, 0.45 to 0.40 microns for traverse speed, and an increase in grain size from 0.40 to 0.46 microns for PD). A microscopic examination of the joint revealed unrefined and irregular strip-like grains in the BM that were elongated in the rolling direction. No significant change in grain size was observed at the HAZ and BM zones. The TMAZ showed a deformed pattern and grain movement in the shoulder direction surrounding the NZ. The NZ displayed a fine equiaxed grain structure. At an RS of 1100 rpm, microhardness decreased around the periphery of the NZ, and 38 HV was measured in the NZ.Advantages and Limitations of RSM
The major advantage of RSM is as follows:-
The possibility of obtaining huge amounts of information in a limited number of experiments.
-
It also provides build models and graphical data to correlate the relationship between the process parameters.
3.2.2. Machine Learning (ML)
Developments in mathematics and computer science lead to the creation of new software tools that can enhance manufacturing capability beyond restricted boundaries. Machine learning is a data-driven approach that uses algorithms to design models and draw inferences based on some patterns [172][61]. Using three different techniques—supervised, unsupervised, and reinforcement—ML draws inferences and suggests an ideal solution [173][62]. The authors of [174][63] surveyed various machine learning techniques used in FSW of different aluminum alloys and outlined the unresolved issues. These issues are highlighted in their paper’s conclusion and future scope section. The algorithms (image pyramid and image reconstruction) were applied to determine the FSW-processed AA 6060 T5 plates [175][64]. Four welded specimens were prepared with different sets of RS: 1500–2000 rpm, TS: 200–400 mm/min, and AF: 1.5–2.5 kN. The image was divided by 1.2 in width and height for every iteration. The threshold value for noise removal was kept at 0.8. A grayscale image was the mask, and an eroded image was the marker. Sobel approximation was used to identify the image’s edges. The authors were able to study the cracks and defects using an image processing technique and suggested the use of a convolutional neural network for better and optimized results. The tensile behavior of FSW processed AA7039 joints (inputs: RS: 1325–1812 rpm, WS: 26–43 mm/min, tilt angle: 1.3–2°) was predicted viz. ML algorithms (GPR, SVM, ANN, LR) [170][65]. The 70% training data reduced the RMSE, offered a better correlation coefficient, and resulted in better prediction with unknown test datasets.Advantages and Limitations
The significant advantages of ANNs are as follows [176][66]:-
The storage of information in the whole network is the ability to work with missing data and parallel processing capability.
-
ANNs can be applied to develop a process model relating linear or nonlinear relationships between responses.
-
An ANN uses weight between the network layers without knowing their physical inference while modeling.
- The optimal condition is different for different materials due to differences in material properties.
- The factors (RS, TS, axial load, pin profile, shoulder diameter, tool tilt angle, pin material, probe penetration, feed rate, tool vibration, etc.) critically affect the welded joint properties.
-
Most of the literature neglected the interaction factor effects, probably due to reduced experimental trials or matrices selected.
-
Taguchi determines the levels of factors that are the optimal conditions resulting in a local solution.
3.1.2. Advantages and Limitations
The significant advantage of Taguchi’s design of experiment is as follows:- The Taguchi method enables conducting experimental trials to determine whether individual factors and interaction between process factors are less significant.
-
In many applications, the method is applied at the initial process development step.
-
The Taguchi method ensures studying both continuous and discontinuous responses.
- The matrices are limited in number and thus fail to test all factor interactions within the proposed experimental design.
- The Taguchi method limits the experimental trials and is treated as a one-time improvement technique, resulting in local or sub-optimal solutions.
-
The Taguchi method only derives empirical equations with a mechanistic model, resulting in a local solution.
-
Taguchi’s method refers to optimization without developing intrinsic empirical or mechanistic modeling, resulting in improper process insight.
-
The Taguchi method requires the support of alternating optimization methods (say, GRA, TOPSIS, MOORA, AI and ML algorithms, etc.) to optimize multiple outputs simultaneously.
-
The Taguchi method applied for multiple objective optimizations is based on judgmental and subjective methods, resulting in a less efficient model.
- For friction stir welding involving a tool pin, a threaded pin profile is preferred because threads allow the proper flow of material from the shoulder down to the bottom of the pin.
3.1.3. Response Surface Methodology (RSM)
In 1951, the RSM technique was developed by Box and Wilson to collect data and correlate input–output variables [141][50]. In other words, it develops a relationship between dependent and independent variables. The relationship is developed using many regression models [142][51]. It is based on the best-fit empirical model extrapolated from the experimental data [142,143][51][52]. The standard form of a regression model is:-
Collecting huge information with limited experiments.
-
Collected data helps to build models and correlate input–outputs.
-
Graphical representation of data that correlates input–outputs of any process.
-
It provides optimum response and optimal conditions from multiple responses.Help to analyze all individual, quadratic (nonlinear or linear), and interaction factor effects on responses.
-
The RSM model provides detailed insight into full quadratic factor effects on response functions.Optimize multiple responses by determining a set of input variables.
- The RSM model derives empirical equations that can be applied for prediction and optimization.
-
The RSM method does not explain process mechanisms.
-
It can fit data to first- or second-order order polynomials, so it cannot explain all systems containing curvature.
-
If the number of independent variables increases, the number of experiments also increases, thus lowering the prediction capability. So, it is feasible with few parameters.
-
The RSM method is not an efficient technique for solving multiple objective functions that are nonlinear and multi-modal.
-
RSM presents an unlimited saddle function in a quadratic model (response surface) possessing more than three responses and, therefore, is limited for responses ≤ 3.
-
RSM may not be a cost-effective technique for many manufacturing sectors.
-
RSM-derived response equations require continuous differentiable to locate optimal conditions.
-
RSM-derived empirical equations predict only one output at a time.
3.2. Artificial Intelligence (AI)
3.2.1. Artificial Neural Networks (ANNs)
Recently, many researchers have used ANNs, GAs, and ML algorithms in addition to Taguchi optimization techniques. ANNs predicts the FSW parameter’s effects on the final part quality characteristics. Inspired by biological–architectural nodes, it uses existing data to train a network with specific input parameters (called neurons) and predicts outputs [153][57]. ANNs learn from input–output data and establish nonlinear and complex relationships using algorithms. The major disadvantages include computational burden, overfitting of the data, and a “black-box” nature (no information about its internal working). The main feature of ANNs resembles that of a human brain. The neuro-physical structure of the human brain inspires researchers/scientists to develop a mathematical model. Various artificial cells and network models were developed [31][58]. In general, ANN architecture comprises input (neurons of the input layer are process variables), hidden, and output (neurons of the output layer are output quality characteristics) layers. There are multiple hidden layers, and the neuron numbers are decided based on training data [154][59]. In addition, bias (helps in producing constant output during training), weights (acts as connection strength between layers), and transfer functions (tangent sigmoid ϕ(x), logarithmic sigmoid ψ(x), and pure linear χ(x) compute the outputs from inputs of the preceding layer) are the network parameters. During the learning process, the weights are updated in the network architecture. The network performance is affected by the configuration of single and multiple layers-
ANN models require tuning network architecture parameters (number of hidden layers and neurons, learning rate, momentum constants, transfer functions, bias) for accurate predictions.
-
An ANN is an efficient tool to overcome the shortcomings of low-order polynomial equations and data containing noise or missing data for better predictions.
-
The major limitation is determining the neural net’s proper size and optimal structure.The ANN model aims to predict multiple outputs simultaneously.
-
An ANN is a “black-box” model; determining the weight relationships between input-output parameters is not known, and hardware implementation of neural networks is costly [166][67].ANNs can be applied for both online and offline process monitoring.
- Preheating the tool pin is advisable to reduce yield stress to prevent wear out of the tool. This makes welding easier.
-
Conventional milling machines with structural enhancements to withstand heavy loads can be used for FSW.
-
NZ has a higher strength due to fine, equiaxed grain structure formation.
-
It was also observed that with an increase in RS, tensile strength increased to a specific value and then decreased with a further rise in RS.
-
A decrease in heat input led to a reduction in workpiece temperature and increased vertical force due to welding speed.
-
Higher values of RS, TS, and penetration depth and a lower tilt angle are required to enhance joint efficiency and increase microhardness.
3. Optimization
Optimization algorithms, an embedded part of an optimization process, are numerical simulators where a realistic representation of physical models that need to be optimized is performed. One way of classifying algorithms is as being deterministic or stochastic. Deterministic algorithms respond in a set of defined rules without any randomness in their nature (i.e., actual output for some definite input), while in the case of stochastic, there is randomness in the output. For some definite input, the algorithm can give multiple outputs. Including randomness at every stage of the algorithm is called heuristics or, in some cases, metaheuristics [108][41]. Figure 103 showcases different combinations that can be made possible for performing optimization.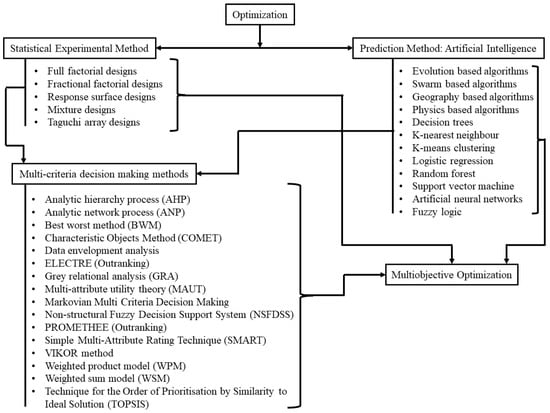
3.3. Multi-Objective Optimization Techniques
Multi-objective optimization is performed with nature-inspired algorithms like GA, PSO, ABC, HS, and ACO. These are developed based on different natural phenomena. The main reason behind developing these algorithms is to improve the optimization process by parallelly solving two or more functions. In [183][71], the hybrid fuzzy–grey Taguchi method was used to optimize FSW of dissimilar Al/Cu joints. Taguchi L16 experiments (RS, WS, PD, and tool pin offset) were conducted, wherein the fuzzy–grey method ensured transforming multiple outputs into a single output. The average grain size of Al at the HAZ was 70.7 µm and Cu was 71.50 µm. At the TMAZ, the grain size of Al was 51.98 µm and for Cu, was equal to 60.6 µm. At the NZ, the grain size of Al and Cu were equal to 46.61 µm. The hybrid optimization method was effective with increased fuzzy sets and improved accuracy. Note that the average grain size of Al and Cu base metal is 73.64 µm and 228.64 µm. In another study, the dragon fly algorithm was applied to optimize inputs (RS: 700–910 rpm, tool tilt angle: 25–50 mm/s, and WS: 1–3°) for higher impact and tensile strength in FSW AA6082–T6 joints [184][72]. Taguchi L9 experiments were conducted with different input variable sets (RS: 900–1400 rpm, TS: 16–32 mm/min, tool tilt angle: 0–2°) on the dissimilar welding of AA6061-AA2024 joint properties (UTS and microhardness) in [185][73]. GRA and DFA were applied to optimize multiple outputs with sets of inputs. Factors contributing to individual output were estimated. Microstructure studies showed refined grains at the NZ compared to the TMAZ and HAZ. In [186][74], Taguchi L16 experiments were carried out with different input sets (RS: 480–1600 rpm, TS: 48–112 mm/min, penetration depth: 0.6–1.2 mm, and tool tilt angle: 0–4°) on the outputs (joint efficiency and microhardness) of AA6061 joints. A cylindrical, tapered tool made of H13 tool steel was applied to perform the welding process. ANFIS was used for prediction, and the neighborhood cultivation genetic algorithm (NCGA) was used for optimization with improved joint efficiency and microhardness. Joint efficiency improved with increased microhardness, corresponding to higher values of RS, TS, and depth of penetration and low values of tilt angle. Taguchi experiments with different sets of RS: 670–1180 rpm, TS: 17–48 mm/min, and D/d ratio: 3–3.5 were used to fabricate AA2024-T4 joints in [188][75]. Weighted principal component analysis (WPCA) was applied to transform multiple outputs into a single output. BP and LM algorithms were used to train the NN with 70% of training data, followed by validation with 15% and testing with 15%. The WPCA-ANN-PSO method was applied to optimize the inputs (D/d ratio: 3, RS: 1180 rpm, TS: 17 mm/min), which achieved the highest UTS and hardness equal to 108.105 MPa (improvement of 20%) and 76 (improvement in 25%), respectively.3.4. Summary
The following observations were made:-
The main objective of RSM is to understand the topography of the response surface and find the region where optimal response occurs.
-
The linear regression model gives a minimum percentage error between experimental and predicted values. It is based on supervised learning and assumes a linear relationship between variables. This is one of the disadvantages of a linear regression model. ANFIS can be used for nonlinear relationships.
-
The backpropagation algorithm (BP) is the most extensively used ANN algorithm implemented online or in batch mode. Its accuracy is less than metaheuristic algorithms. Problems like determining the optimal number of neurons, the best learning rate in each hidden layer of an ANN, and the global optimum solution cannot be determined using the BP algorithm.
-
Underfitting and overfitting in an ANN generate errors during the network training. Underfitting occurs when an ANN cannot accurately capture the relationship between input and output variables, resulting in high error. Overfitting refers to extra data generated along with noise from the training stage.
-
The image processing technique has been predominantly used for detecting cracks and defects. Convolutional neural networks would yield better and optimized results.
-
Taguchi and RSM have been widely used with ML techniques for determining/predicting more optimal values. These include Taguchi-GRA, RSM-ANN, Taguchi-PSO, and RSM-PSO-Firefly, to name a few.
64. Conclusions
FSW is a suitable alternative to fusion-based welding techniques for producing parts with minimal defects. RS, TS, PD, and tilt angle are the vital process parameters for FSW. Amongst them, RS is the most significant parameter. Optimization determines the best possible combination of various process parameters to fabricate parts with better mechanical properties. Taguchi, RSM and FD, AI and ML, and ANN techniques have been used for FSW. Taguchi, response surface methodology, and factorial design are categorized under the statistical optimization approach, while machine learning algorithms are categorized under AI-based optimization. Researchers have also implemented hybrid and multi-objective and hybrid optimization techniques for optimization. In the case of FSW, temperature plays an important role. Researchers predominantly used thermocouples to monitor temperature evolution. Force and torque measurements have been performed using load cells to determine the effect of vertical load on the mechanical properties and vibration, and acoustic sensors for frequencies measured during the FSW process. Data acquired from the sensors have been analyzed with AI and ML algorithms to determine the optimum parameters. Future research should concentrate on developing real-time feedback systems with multiple sensors and multi-objective optimization techniques for determining the best-suited parameters for FSW.
References
- Mohan, D.G.; Wu, C.S. A Review on Friction Stir Welding of Steels. Chin. J. Mech. Eng. 2021, 34, 137.
- Chularis, A.A.; Rzaev, R.A.; Valisheva, A.G.; Kogan, V.V. Joining of Steels to Aluminum and its Alloys by Friction Stir Welding. Met. Sci. Heat Treat. 2021, 62, 738–747.
- Ahmed, M.M.Z.; El-Sayed Seleman, M.M.; Fydrych, D.; Cam, G. Friction stir welding in the aerospace industry: The current progress and state-of-the-art review. Materials 2023, 16, 2971.
- Kashaev, N.; Ventzke, V.; Cam, G. Prospects of laser beam welding and friction stir welding processes for aluminum airframe structural applications. J. Manuf. Process. 2018, 36, 571–600.
- Cam, G.; Ipekoglu, G. Recent developments in joining of aluminium alloys. Int. J. Adv. Manuf. Technol. 2017, 91, 1851–1866.
- Kavathia, K.; Badheka, V. Application of Friction Stir Welding (FSW) in Automotive and Electric Vehicle. In Recent Advances in Mechanical Infrastructure; Parwani, A.K., Ramkumar, P., Abhishek, K., Yadav, S.K., Eds.; Lecture Notes in Intelligent Transportation and Infrastructure Book Series; Springer: Singapore, 2022.
- Martin, J.; Wei, S. Friction Stir Welding Technology for Marine Applications. In Friction Stir Welding and Processing VIII; Mishra, R.S., Mahoney, M.W., Sato, Y., Hovanski, Y., Eds.; Springer: Cham, Switzerland, 2015.
- İpekoğlu, G.; Erim, S.; Kıral, B.G.; Çam, G. Investigation into the effect of temper condition on friction stir weldability of AA6061 Al-alloy plates. Kov. Mater. 2013, 51, 155–163.
- Çam, G.; Javaheri, V.; Heidarzadeh, A. Advances in FSW and FSSW of dissimilar Al-alloy plates. J. Adhes. Sci. Technol. 2023, 37, 162–194.
- El-Sayed, M.M.; Shash, A.Y.; Abd-Rabou, M.; ElSherbiny, M.G. Welding and processing of metallic materials by using friction stir technique: A review. J. Adv. Join. Process. 2011, 3, 100059.
- Singh, K.; Singh, G.; Singh, H. Review on friction stir welding of magnesium alloys. J. Magnes. Alloys 2018, 6, 399–416.
- Cui, L.; Peng, Z.; Chang, Y.; He, D.; Cao, Q.; Guo, X.; Zeng, Y. Porosity, microstructure and mechanical property of welded joints produced by different laser welding processes in selective laser melting AlSi10Mg alloys. Opt. Laser Technol. 2022, 150, 107952.
- Ipekoglu, G.; Cam, G. Formation of weld defects in cold metal transfer arc welded 7075-T6 plates and its effect on joint performance. IOP Conf. Ser. Mater. Sci. Eng. 2019, 629, 012007.
- Cam, G. Prospects of producing aluminum parts by wire arc additive manufacturing (WAAM). Mater. Today Proc. 2022, 62, 77–85.
- Liu, F.; Dong, Y.; Tan, Z.; Wang, H.; Tan, C.; Chen, B.; Song, X. Mechanism analysis on suppressing porosity in laser-MIG hybrid welding of aluminum alloy via external magnetic field. J. Manuf. Process. 2023, 101, 1124–1135.
- Deng, A.; Chen, H.; Zhang, Y.; Liu, Y.; Yang, X.; Zhang, B. Effect of filler materials on the porosity formation of aluminum alloy by laser welding with filler wire. Opt. Laser Technol. 2023, 159, 109000.
- Wang, L.; Liu, Y.; Yang, C.; Gao, M. Study of porosity suppression in oscillating laser-MIG hybrid welding of AA6082 aluminum alloy. J. Mater. Process. Technol. 2021, 292, 117053.
- Chen, L.; Wang, C.; Xiong, L.; Zhang, X.; Mi, G. Microstructural, porosity and mechanical properties of lap joint laser welding for 5182 and 6061 dissimilar aluminum alloys under different place configurations. Mater. Des. 2020, 191, 108625.
- Zhang, Y.N.; Cao, X.; Larose, S.; Wanjara, P. Review of tools for friction stir welding and processing. Can. Met. Q. 2012, 51, 250–261.
- Smith, I.J.; Lord, D.D. FSW Patents-A Stirring Story; SAE Transactions; SAE International: Warrendale, PA, USA, 2007; pp. 772–780.
- Birdi, A.; Procha, A.; Brar, A.S.; Kumar, R.; Kumar, S. Effect of tool pin profile on mechanical characteristics of friction stir welded al alloys: A critical review. Int. Res. J. Nat. Sci. 2019, 1, 15–21. Available online: https://www.scienceresearchjournals.org/IRJNST/volume-1%20issue-5.html (accessed on 2 February 2023).
- Kumar, A.; Raju, L.S. Influence of tool pin profiles on friction stir welding of copper. Mater. Manuf. 2012, 27, 1414–1418.
- Mishra, R.S.; Ma, Z.Y. Friction stir welding and processing. Mater. Sci. Eng. R Rep. 2005, 50, 1–78.
- Kamal, S.; Parthiban, V.; Puthilibai, G.; Thirumal Azhagan, M.; Kamal, N.; Senthil, T.S.; Yishak, S. Investigation on tensile behaviour of different weld joints through Taguchi approach. Adv. Mater. Sci. Eng. 2022, 2022, 5258014.
- Babalola, S.A.; Dutta, S.; Murmu, N.C.; Akinnuli, B.O. In-situ process reliability monitoring strategy for friction stir welding machine. Mater. Today Proc. 2022, 66, 3883–3889.
- Ehiasarian, A.; Purandare, Y.; Sugumaran, A.; Hovsepian, P.; Hatto, P.; de Backer, J. Improving the Quality of Friction Stir Welds in Aluminium Alloys. Coatings 2021, 11, 539.
- MohammadiSefat, M.; Ghazanfari, H.; Blais, C. Friction Stir Welding of 5052-H18 aluminum alloy: Modeling and process parameter optimization. J. Mater. Eng. Perform. 2021, 30, 1838–1850.
- Mijajlović, M.; Milčić, D. Analytical model for estimating the amount of heat generated during friction stir welding: Application on plates made of aluminium alloy 2024 T351. In Welding Processes; IntechOpen: London, UK, 2012; pp. 247–274.
- Prabhakar, D.A.P.; Shettigar, A.K.; Herbert, M.A.; Gowdru, C.M.P.; Pimenov, D.Y.; Giasin, K.; Prakash, C. A comprehensive review of friction stir techniques in structural materials and alloys: Challenges and trends. J. Mater. Res. Technol. 2022, 20, 3025–3060.
- Chen, S.; Zhang, H.; Jiang, X.; Yuan, T.; Han, Y.; Li, X. Mechanical properties of electric assisted friction stir welded 2219 aluminum alloy. J. Manuf. Process. 2019, 44, 197–206.
- Zamani, S.M.M.; Behdinan, K.; Razfar, M.R.; Fatmehsari, D.H.; Mohandesi, J.A. Studying the effects of process parameters on the mechanical properties in friction stir welding of Al-SiC composite sheets. Int. J. Adv. Manuf. Technol. 2021, 113, 3629–3641.
- Elangovan, K.; Balasubramanian, V. Influences of pin profile and rotational speed of the tool on the formation of friction stir processing zone in AA2219 aluminium alloy. Mater. Sci. Eng. 2007, 459, 7–18.
- Sahali, M.A.; Aini, A.; Bouzit, L.; Himed, L.; Benaissa, B. Experimental modeling and multi-objective optimization of friction stir welding parameters of AA 3004 aluminum alloy. Int. J. Adv. Manuf. Technol. 2023, 124, 1229–1244.
- Noreña, E.; Zuluaga, M.; Hoyos, E.; Montoya, Y. Model-based proposal of a control strategy for friction stir welding. In Proceedings of the 2019 IEEE 4th Colombian Conference on Automatic Control (CCAC), Medellin, Colombia, 15–16 October 2019; pp. 1–6.
- Zhao, S.; Bi, Q.; Wang, Y. An axial force controller with delay compensation for the friction stir welding process. Int. J. Adv. Manuf. Technol. 2016, 85, 2623–2638.
- Schmidt, H.; Hattel, J.; Wert, J. An analytical model for the heat generation in friction stir welding. Model. Simul. Mater. Sci. Eng. 2003, 12, 143.
- Song, M.; Kovacevic, R. Thermal modeling of friction stir welding in a moving coordinate system and its validation. Int. J. Mach. Tools Manuf. 2003, 43, 605–615.
- Amara, K.; Badji, R.; Bouabdallah, M.; Cheniti, B.; Aissani, M.; Haddad, A.; Ziouche, A. Effect of PWHT on microstructure and corrosion resistance of the nugget zone in AZ31 friction stir weld. Int. J. Adv. Manuf. Technol. 2022, 123, 2757–2769.
- West, P.; Shunmugasamy, V.C.; Usman, C.A.; Karaman, I.; Mansoor, B. Part I.: Friction stir welding of equiatomic nickel titanium shape memory alloy–microstructure, mechanical and corrosion behavior. J. Adv. Join. Process. 2021, 4, 100071.
- Subramanya, P.; Amar, M.; Arun, S.; Mervin, H.; Shrikantha, R. Friction stir welding of Aluminium matrix composites–A Review. MATEC Web Conf. 2018, 144, 03002.
- Sorensen, C.D.; Nelson, T.W. Friction stir welding of ferrous and nickel alloys. Frict. Stir Weld. Process. 2007, 44073, 111–121.
- Yang, X.S. Optimization and metaheuristic algorithms in engineering. In Metaheuristics in Water, Geotechnical and Transport Engineering; Elsevier: Amsterdam, The Netherlands, 2013; pp. 1–23.
- Modi, V.K.; Desai, D.A. Review of Taguchi Method, Design of Experiment (DOE) & Analysis Of Variance (ANOVA) For Quality Improvements through Optimization in Foundry. J. Emerg. Technol. Innov. Res. 2018, 5, 184–194. Available online: https://www.jetir.org/papers/JETIR1801035.pdf (accessed on 4 January 2023).
- Jagdev, H.S.; Browne, J.; Keogh, J. Manufacturing Process Optimisation—A Survey of Techniques. In Proceedings of the Twenty-Eighth International: Matador Conference, Macmillan Education, Manchester, UK, 18–19 April 1990; pp. 205–215.
- Chauhan, A.; Kumar, S. Optimization of Friction Stir Welding Parameters for Similar Base Material Combinations. In Advances in Engineering Materials: Select Proceedings of FLAME; Springer: Berlin/Heidelberg, Germany, 2021; pp. 665–675.
- Krishna, G.G. Improving joint strength of the friction stir welding of dissimilar aluminium alloy by using coating technique. Sādhanā 2022, 47, 7.
- Ismail, A.; Zulkipli, F.N.; Awang, M.; Ab Rahman, F.; Khalid, P.Z.M.; Baharudin, B.A. Optimum Welding Parameters for Friction Stir Welded AA6063 Pipe Butt Joint Using the Taguchi Method. Trans. Marit. Sci. 2021, 10, 404–413.
- Tutum, C.C.; Hattel, J.H. Optimisation of process parameters in friction stir welding based on residual stress analysis: A feasibility study. Sci. Technol. Weld. Join. 2010, 15, 369–377.
- Panwar, R.; Chandna, P. Parameter optimization of FSW aviation-grade AA8090 using Taguchi grey relational analysis. Aircr. Eng. Aerosp. Technol. 2023, 95, 715–724.
- Seshu Kumar, G.S.V.; Kumar, A.; Rajesh, S.; Chekuri, R.B.R.; Ramakotaiah, K. An experimental study and parameter optimization of FSW for welding dissimilar 6061 and 7075 Al alloys. Int. J. Interact. Des. Manuf. 2023, 17, 215–223.
- Zhou, L.; Luo, L.Y.; Wang, R.; Zhang, J.B.; Huang, Y.X.; Song, X.G. Process parameter optimization in refill friction spot welding of 6061 aluminum alloys using response surface methodology. J. Mater. Eng. Perform. 2018, 27, 4050–4058.
- Patel, G.C.M.; Krishna, P.; Parappagoudar, M.B. Squeeze casting process modeling by a conventional statistical regression analysis approach. Appl. Math. Model. 2016, 40, 6869–6888.
- Patel, G.C.M.; Shettigar, A.K.; Parappagoudar, M.B. A systematic approach to model and optimize wear behaviour of castings produced by squeeze casting process. J. Manuf. Process. 2018, 32, 199–212.
- Phanphet, S.; Sukprasert, N.; Wangmai, A.; Bangphan, S.; Bangphan, P. Application of factorial design to study the effect of moisture and rice of varieties on the production of Paddy Husker Machine. In Proceedings of the World Congress on Engineering, London, UK, 4–6 July 2018; Volume 2.
- Medhi, T.; Hussain, S.A.I.; Roy, B.S.; Saha, S.C. An intelligent multi-objective framework for optimizing friction-stir welding process parameters. Appl. Soft Comput. 2021, 104, 107190.
- Anand, R.; Sridhar, V.G. Microstructure and mechanical properties of interlock friction stir weld lap joint AA7475-T7 using fractional factorial design. Proc. Inst. Mech. Eng. Part C 2022, 236, 318–329.
- Senapati, P.N.; Bhoi, R.K. Characterization of Friction-Stir Welded Joints of AA1100 by Factorial Design Based Hierarchical Regression Model. Ann. Chim. Sci. Mater. 2020, 44, 271–280.
- Bector, K.; Tripathi, A.; Pandey, D.; Butola, R.; Singari, R.M. A review on the fabrication of surface composites via friction stir processing and its modeling using ANN. In Advances in Manufacturing and Industrial Engineering: Select Proceedings of ICAPIE 2019; Springer: Berlin/Heidelberg, Germany, 2021; pp. 1–11.
- Eren, B.; Guvenc, M.A.; Mistikoglu, S. Artificial intelligence applications for friction stir welding: A review. Met. Mater. Int. 2021, 27, 193–219.
- Patel, G.C.M.; Shettigar, A.K.; Krishna, P.; Parappagoudar, M.B. Back propagation genetic and recurrent neural network applications in modelling and analysis of squeeze casting process. Appl. Soft Comput. 2017, 59, 418–437.
- Haykin, S. Neural Networks: A Comprehensive Foundation; Prentice Hall: Hoboken, NJ, USA, 1998.
- Singh, R.; Kainthola, A.; Singh, T.N. Estimation of elastic constant of rocks using an ANFIS approach. Appl. Soft Comput. 2012, 12, 40–45.
- Monostori, L.; Márkus, A.; van Brussel, H.; Westkämpfer, E. Machine learning approaches to manufacturing. CIRP Ann. 1996, 45, 675–712.
- Chadha, U.; Selvaraj, S.K.; Gunreddy, N.; Sanjay Babu, S.; Mishra, S.; Padala, D.; Adefris, A. A survey of machine learning in friction stir welding, including unresolved issues and future research directions. Mater. Des. Process. Commun. 2022, 2022, 2568347.
- Mishra, A.; Dutta, S.B. Detection of surface defects in friction stir welded joints by using a novel machine learning approach. Appl. Eng. Lett. 2020, 5, 16–21.
- Verma, S.; Misra, J.P.; Singh, J.; Batra, U.; Kumar, Y. Prediction of tensile behavior of FS welded AA7039 using machine learning. Mater. Today Commun. 2021, 26, 101933.
- Mukherjee, I.; Ray, P.K. A review of optimization techniques in metal cutting processes. Comput. Ind. Eng. 2006, 50, 15–34.
- Okuyucu, H.; Kurt, A.; Arcaklioglu, E. Artificial neural network application to the friction stir welding of aluminum plates. Mater. Des. 2007, 28, 78–84.
- Rao, R.V.; Rai, D.P. Optimisation of welding processes using quasi-oppositional-based Jaya algorithm. J. Exp. Theor. Artif. Intell. 2017, 29, 1099–1117.
- Rambabu, G.; Naik, D.B.; Rao, C.V.; Rao, K.S.; Reddy, G.M. Optimization of friction stir welding parameters for improved corrosion resistance of AA2219 aluminum alloy joints. Def. Technol. 2015, 11, 330–337.
- Saeidi, M.; Manafi, B.; Besharati Givi, M.K.; Faraji, G. Mathematical modeling and optimization of friction stir welding process parameters in AA5083 and AA7075 aluminum alloy joints. Proc. Inst. Mech. Eng. Part B 2016, 230, 1284–1294.
- Sahu, P.K.; Kumari, K.; Pal, S.; Pal, S.K. Hybrid fuzzy-grey-Taguchi based multi weld quality optimization of Al/Cu dissimilar friction stir welded joints. Adv. Manuf. 2016, 4, 237–247.
- Pitchipoo, P.; Muthiah, A.; Jeyakumar, K.; Manikandan, A. Friction stir welding parameter optimization using novel multi objective dragonfly algorithm. Int. J. Light. Mater. Manuf. 2021, 4, 460–467.
- Nadikudi, B.K.B. Parametric optimization of friction stir welding process parameters of dissimilar welded joints using grey relational analysis and desirability function approach. World J. Eng. 2022, 20, 609–617.
- Van, A.L.; Nguyen, T.T. Optimization of friction stir welding operation using optimal taguchi-based ANFIS and genetic algorithm. Stroj. Vestn./J. Mech. Eng. 2022, 68, 424–438.
- Ambekar, M.; Kittur, J. Multiresponse optimization of friction stir welding process parameters by an integrated WPCA-ANN-PSO approach. Mater. Today Proc. 2020, 27, 363–368.