Your browser does not fully support modern features. Please upgrade for a smoother experience.
Please note this is a comparison between Version 1 by Mustafa Yücel and Version 3 by Jessie Wu.
As energy is vital in the sustainability of almost every part of daily life, energy security has become more crucial than ever before. One of the main threats to energy security is a possible disruption along the trade network, which jeopardizes the constant energy supply.
- strategic management
- energy supply
- diversification strategies
1. Introduction
Besides the dependence of economic superiority and welfare on energy, energy security, which means uninterrupted and affordable energy flow, has gained strategic importance with the energy crises since the early 1970s [1]. Economies that are not rich in fossil energy resources, especially the European Union (EU), have to manage the supply of these resources primarily through imports. Regulations during the crude oil crises in the 1960s and 1970s and market liberalization packages in the 1990s to 2000s aimed to mature the energy sector in the context of energy security, sustainability, competitiveness, and economy. After the oil crisis of the 1970s, Europe did not face any crisis-grade energy supply shortages for more than 30 years. This situation led the EU to pay insufficient attention to the issue of energy security until 2006, at the time the Russian–Ukrainian natural gas dispute occurred. Despite the several solid steps taken on energy security after the first Russia–Ukraine dispute, another energy crisis emerged in 2009 for the same reason. As of January 7, the natural gas transmitted throughout the Russia—Ukraine—EU chain was out of service until January 20 in the mentioned year [2]. The complete cessation of 30% of the total gas imported into Europe for two weeks has enabled the EU to take new steps on energy security. It has shown that measures such as increasing energy diversification on the basis of both resources and imports, expanding storage and reserve capacities, and providing the necessary infrastructures for the development of the energy transmission mechanism in the domestic market became a top priority and led to the preparation of required policies in this regard [3][4][3,4]. Nevertheless, despite all these initiatives, the European Energy Security Stress Tests conducted in 2014 revealed that it is not yet sufficiently prepared for a possible natural gas interruption from the east [5]. Eventually, another wave of crises emerged with the COVID-19 pandemic, severely affecting energy supply [6]. The EU has lucrative potential in many aspects, including energy, because of its position [7][8][9][7,8,9]. However, its success mainly depends on whether it fulfills its capability or not, as focusing on international crises such as pandemics or international conflicts will prevent the identification of the underlying problems. Accordingly, it was clear that the electricity generation sources of the EU still relied on fossil fuels in 2021. Approximately half (48%) of the total generation of electricity was sourced from combustible fuels and natural gas, which mainly depended on imports from non-EU countries. For instance, the EU imported 90% of its gas consumption, while more than 40% of it was solely supplied from Russia. Also, Russia accounted for 46% of coal imports and 27% of oil imports in 2021 [10].
Energy trade has strategic significance as it does not appear solely as a for-profit trade but also as an influential instrument in national political goals. Therefore, it has as a mechanism that governments constantly intervene as part of the national strategies of states [11][12]. Energy trade mainly refers to trading primary energy resources. Therefore, it covers sources that have energy production value. However, it is well-known that among these sources, oil, natural gas, and coal dominate almost the entire market [12][13][14][15][13,14,15,16]. Therefore, the mentioned sources still have significant value in the energy trade of the EU compared to other types.
Especially since the 90s, energy demand, supply, and trade relations have become more complicated. Storage and transportation of energy is a capital-intensive sector, which means high costs are required to store and transport energy [16][17]. From the point of view of crude oil, it is clear that geopolitical and diplomatic relations are the main factors affecting the trade. Also, ordinary commercial cooperation and mutual interest relations are key structural motivations of international energy trade.
Furthermore, overseas investments, technological processes, energy efficiency, and global incidents are the other key factors affecting the energy trade network. For instance, events such as the 2004–2005 Iraq–American war, the 2008 financial crisis, significant progress in shale technology, and the COVID-19 pandemic emerge as turning points that play a critical role in shaping the trade network [11][17][18][12,18,19]. Moreover, the armed conflict in Ukraine increased the urgency of providing affordable energy globally [19][20], especially from the perspective of Europe, as it has been highly dependent on imports of energy sources from Russia [20][21].
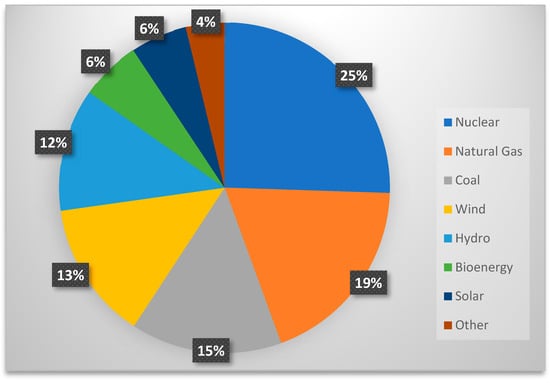 Figure 1 shows the major sources of electricity generation in the EU. According to the graph, it is clear that nuclear power became the primary source, which constitutes 25% of the total electricity generation in the EU. Natural gas is the second most-used resource to generate electricity in the EU, with 19%. It is also remarkable that renewables such as wind, solar, bioenergy, and hydro have a total share of 35%. A noteworthy point on the graph is that the sum of combustible fuels and natural gas still constitutes a significant share of the total electricity generation of the union. Furthermore, as mentioned for the specific countries before, energy sources are highly dependent on imports from non-EU countries [32][33].
2. Energy Supply and Demand in the European Union
According to the latest data, Germany has the largest population, with 83.2 million people, constituting 18.6% of the total EU population. Secondly, France constitutes 15% with 67.1 million; thirdly, Italy constitutes 13.5% with 60.2 million, followed by Spain constituting 10.6% with 47.3 million, and Poland constituting 8.5% with 38 million. Fourteen of the remaining member states have population ratios between 1 and 5%, while the other eight member states have a population ratio of less than 1% [21][22]. Germany, aka the locomotive of the EU [22][23], ranks first place in the economy as well as the population, and it alone constitutes about a quarter (24.7%) of the gross domestic product (GDP) of the EU. Other leading countries in GDP ranking are France (17.4%), Italy (12.8%), Spain (8.9%), and the Netherlands (5.8%). The countries lowest in the GDP ranking of the union are Slovakia, Luxembourg, Croatia, Bulgaria, Slovenia, Lithuania, Latvia, Cyprus, and Estonia, followed by Malta, with the lowest share of 0.1% [23][24]. Germany’s geographical location and size ensure its vital role in the energy sector of the EU. Germany, the leader in indicators such as population and GDP, ranked first in the EU in the highest energy consumption in 2019 [24][25]. With these attributes, it also ranked seventh in the world’s highest energy consumption and fifth in GDP. However, Germany meets a very high part of its energy demand through imports. As of 2019, the country provided 71% of its energy supply through imports [25][26]. France, the second largest energy-consuming country in the EU, is a net electricity exporter and the second country to produce the most electricity via nuclear energy in the world. Conversely, the country meets a large part of its demand via imports due to the limited capability for oil and natural gas production [26][27]. Italy, the third country in the highest energy consumption ranking, has an import dependency of 75%, which is above the EU average [21][22]. Spain ranks fourth in highest energy consumption and possesses nearly no crude oil or natural gas production due to geographical constraints. As almost all the oil and natural gas are supplied via imports, there is an upper-limit regulation for imports from each country to diversify the sources [27][28]. It is noteworthy that in Spain, where approximately 38% of renewable resources are used in electricity generation as of 2019, 11.4% of the total electricity produced is provided by cogeneration systems (the use of thermal energy produced for other purposes to generate electricity concurrently). Furthermore, 21.4% of the total electricity production in the country was met by nuclear power plants [28][29]. The potential of the overall renewable energy resources in terms of geographical availability and technological capacity in Spain is more than sufficient for the total domestic demand, including the need for fossil fuels [29][30]. On the other hand, Poland, the fifth highest energy consumer in the EU, is also a significant producer among the EU countries. However, it is a net importer of oil and natural gas due to the scarce crude oil and natural gas resources. Poland met 45% of its energy needs from coal, 31% from petroleum and its derivatives, 17% from natural gas, and 7% from renewable energy sources. Poland, which is trying to alleviate its excessive dependence on Russia regarding energy, is attempting to adapt to the regulations of the EU and create its energy policies in that direction [30][31]. The following Figure 1 shows the sum of electricity generation in the EU by source in 2021 [31][32]:Figure 1.
Electricity generation in the EU by source in 2021.