In an environment where manufacturing precision requirements are increasing, complete project plans can consist of hundreds of engineering drawings. The presentation of these drawings often varies based on personal preferences, leading to inconsistencies in format and symbols. The lack of standardization in these aspects can result in inconsistent interpretations during subsequent analysis. Therefore, proper annotation of engineering drawings is crucial as it determines product quality, subsequent inspections, and processing costs. To reduce the time and cost associated with interpreting and analyzing drawings, as well as to minimize human errors in judgment, researchers developed an engineering drawing recognition system. Existing 2D engineering drawings serve as the training data, and image segmentation is performed to identify objects such as dimensions, tolerances, functional frames, and geometric symbols in the drawings using the network model. By reading the coordinates corresponding to each object, the correct values are displayed.
In an environment where manufacturing precision requirements are increasing, complete project plans can consist of hundreds of engineering drawings. The presentation of these drawings often varies based on personal preferences, leading to inconsistencies in format and symbols. The lack of standardization in these aspects can result in inconsistent interpretations during subsequent analysis. Therefore, proper annotation of engineering drawings is crucial as it determines product quality, subsequent inspections, and processing costs. To reduce the time and cost associated with interpreting and analyzing drawings, as well as to minimize human errors in judgment, we developed an engineering drawing recognition system. Existing 2D engineering drawings serve as the training data, and image segmentation is performed to identify objects such as dimensions, tolerances, functional frames, and geometric symbols in the drawings using the network model. By reading the coordinates corresponding to each object, the correct values are displayed.
1. Introduction
Computer-Aided Design (CAD) software has become increasingly powerful in recent years, allowing various 3D model annotation techniques. However, even after all these years, 3D model annotation still cannot completely replace 2D engineering drawings. There are two main reasons for this. First, there is a performance issue. More powerful 3D software requires higher computer specifications, and for complex assembly structures, the loading speed of models, software display, and operations are still not as convenient as 2D drawings in terms of performance. Second, there is a difficulty in accessing information. Although 3D annotation is intuitive and provides richer information compared to 2D drawings, it is still not as convenient as 2D drawings in terms of extracting information from the model. The core of 2D drawings lies in annotation, where designers can use appropriate areas for rotation, zooming, section views, etc., to express design intent and filter out unnecessary feature information, allowing readers to quickly obtain the information the designer intends to convey. While 3D models can also achieve similar viewing and annotation to 2D drawings, the workload for drawing is much larger, and they are also more challenging for non-professionals to interpret. Therefore, engineering drawings still play an extremely important role in the manufacturing industry.
With advancing production technology, intense market competition, and constant product innovation, the demand for design drawings is increasing. For a new product, they occupy a significant portion of the schedule during the design phase. In industrial manufacturing, interpretation of drawing information by skilled technical personnel was traditionally required for subsequent processing and quality control validation to present a complete product profile. However, manual engineering drawing analysis would consume a significant amount of time in drawing interpretation, especially when most engineers still use traditional positive and negative tolerance annotation methods, resulting in many defects in the drawings. For example, traditional dimension annotation cannot control the shape, deviation, direction, or position of the components. If each person has a different understanding of the drawing, the product functionality cannot be effectively expressed, and the inspection results will also differ. Therefore, establishing a unified drawing language can reduce manual operation time and shorten the product development cycle, providing an effective solution to this problem. By training on engineering drawings using YOLO and OpenCV, a feature recognition system can be established. Initially, features are clustered and managed, and the recognition results are stored in a database, which can effectively solve the difficulty of storing numerous drawings, eliminate the trouble of manual input, reduce human errors, and shorten the subsequent validation process.
Integrating drawing information and planning into automated systems is a future direction in the engineering drawing literature. Zhou et al.
[1] noted that in engineering design, the efficiency and quality of presentation often depend on the completeness of the drawings. Therefore, feature information plays an important role in CAD drawings. Moreno-Garcia et al.
[2] pointed out that engineering drawings are moving towards digitization. As engineering drawings can be used in different industries, the current focus is on how to manage these drawings in a digital format, especially since traditional paper-based management is challenging and not conducive to preserving historical information and drawings for various industries. Sun et al.
[3] stated that GD&T is an important step in product design, as it has a significant impact on product manufacturing, quality, and functionality. The practice of GD&T can standardize engineering drawings, making them more accurate, and easier to understand. ASME
[4] noted that the Y14.5 standard is considered the authoritative guide for geometric dimensioning and tolerancing language. The symbols, rules, definitions, requirements, default values, and recommended practices outlined in the standard can provide clearer explanations of GD&T and the associated data files used in engineering to define drawings and models. Scheibel et al.
[5] noted that engineering drawings accompany the entire production process of a component. Although the manufacturing process of components is almost fully automated, the design and utilization of drawings have not yet been fully integrated into automated production. Therefore, the current challenge is how to extract dimensional information from drawings and integrate it into the production process to facilitate and optimize quality control.
The presentation of drawing information varies among different engineering drawings. Without a unified format of a drawing language, this can lead to different interpretations by subsequent recipients, resulting in mutual blaming among engineers from different departments, multiple measurement results during inspection, decreased product quality, increased costs, and other issues.
In terms of automated interpretation of drawings, one possible direction is to train systems using a standard format. This allows the system to automatically extract relevant annotation information by extracting drawing features, thus facilitating drawing management and automated inspection. Text detection and recognition in images have already been widely applied in various fields. Trischler et al.
[6] noted that understanding text is a major goal in natural language processing, which is a complex cognitive task requiring local text context reading and incorporating relevant background knowledge. Wan et al.
[7] proposed a text feature localization method using the Maximally Stable Extremal Regions (MSER) algorithm, which can extract text positions even under image rotation and affine transformations. Epshtein et al.
[8] introduced the Stroke Width Transform (SWT), a novel image operation that performs edge detection on the entire image, assigns width values to each pixel, aggregates similar width pixels, and highlights the text regions. Yu et al.
[9] designed a rule-based filtering and Support Vector Machine (SVM)-based hierarchical localization method. It extracts characters using MSER, filters out non-text regions based on text features, and locates the text positions using Histogram of Oriented Gradient (HOG) features and bounding rectangles through SVM.
In the deep learning literature, the field of image processing has received significant attention, especially in the development of object detection. This is attributed to the classification capabilities of Convolutional Neural Networks (CNN), which are a major driving force in deep learning. Lecun et al.
[10] proposed the LeNet-5 network model for character recognition. It trained a multi-layer neural network using the back-propagation algorithm, which became a prominent example of gradient learning. It can synthesize complex drawings using gradient learning algorithms with minimal preprocessing and perform classification in high-dimensional patterns. Krizhevsky et al.
[11] designed the AlexNet structure, which increased the depth of the network and enhanced its representation capabilities. They successfully introduced the Rectified Linear Unit (ReLU) activation function and the dropout technique, which alleviated the gradient vanishing problem caused by the Sigmoid function and prevented overfitting. Simonyan et al.
[12] proposed the VGGNet model, which replaced the larger convolutions in previous models with consecutive 3 × 3 convolutions. This significantly reduced the number of parameters while maintaining performance, enabling deeper networks. In the 2014 ImageNet competition, the model achieved good results in localization and classification tasks. Liu et al.
[13] introduced deep deconvolutional semantic image segmentation, which used VGGNet as the neural network for encoding and deconvolution and pixel prediction to construct image segmentation. Yu et al.
[14] noted that image semantic segmentation is formed by an image classification model. However, prediction and classification have structural differences. Therefore, they designed the Dilated Convolution module, which combines information from different layers and reduces the resolution loss, thereby improving the overall accuracy of segmentation. Li et al.
[15] and Chen et al.
[16] discussed how dilated convolution can expand the receptive field, reduce training parameters and data volume, and effectively compensate for insufficient localization accuracy when properly combined with random fields. He et al.
[17] proposed the Deep Residual Network (ResNet), and the key to training this network is the use of skip connections through identity mapping. It enables the current output to skip the computation of the original layer by mapping across layers, leading to a trend of deeper models with fewer parameters and alleviating the problem of gradient vanishing. Redmon et al.
[18] introduced YOLO, a fast and accurate object detection framework that uses regression methods to globally predict objects in images, ensuring high precision in detection. Wang et al.
[19] introduced YOLOv7, which optimizes the model architecture and training process to reduce parameters and computations. When the frames per second (FPS) range from 5 to 160, it surpasses known real-time object detectors in terms of speed and accuracy.
2. GD&T
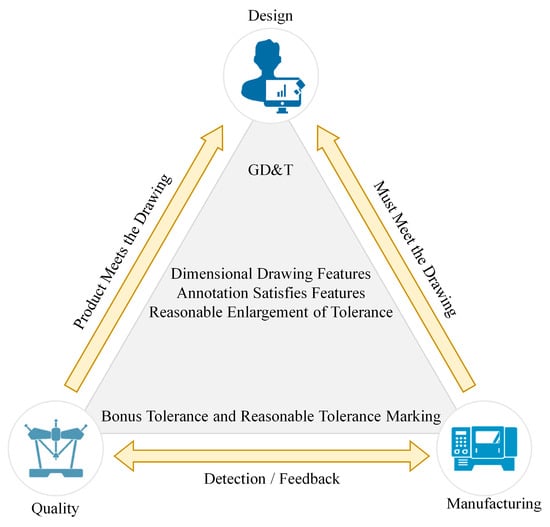
For product manufacturing processes, how to fully interpret the object on the drawing after part design is currently a major concern. Incomplete drawing design can result in defects in the production and inspection processes, leading to parts that do not accurately match the model. Therefore, in order to meet international requirements for drawing formats and symbols, a GD&T framework has been designed for assembly design and production standards, as shown in
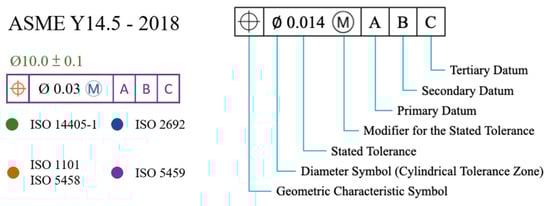
Figure 1. This framework is a universal language of engineering drawing symbols, primarily used in engineering drawings and models to define the allowable deviations of geometric elements. It can precisely express functional requirements for each feature’s position, orientation, size, shape, etc., in the design. Both production and verification personnel can use this language to understand design intent and inspection and to determine design requirements. Different companies use different GD&T standards. The two major geometric dimensioning and tolerancing standards used worldwide today are the ASME Y14.5 and ISO GPS standards. ASME Y14.5 is the American national standard, specifying dimensions and tolerances for part drawings only. ISO is the international standard, providing detailed specifications for gauge design, acceptance testing, coordinate measurement, calibration, and other procedures. Both standards aim to address issues of part interchangeability and assembly. Approximately 80% to 90% of the content in the two standards is similar. This study primarily adopts ASME Y14.5, which is widely used in the United States and globally, as shown in
Figure 2. Geometric dimensioning and tolerance symbols are shown in
Table 1.
Figure 1. Relationship framework of GD&T with design, manufacturing, and measurement.
Table 1. Geometric dimensioning and tolerance symbols.
3. Learning Model
ReIn this s
earcherstudy, we utilized YOLOv7, which was proposed by Wang et al.
[19], for the development of deep learning-based object recognition. YOLO is a fast and accurate object detection framework that treats the input image as a whole and predicts output through CNN channels. The overall architecture is depicted in
Figure 3. The image is divided into multiple grid cells, and the neural network predicts the confidence, probability, and bounding boxes of objects. Finally, the Non-Maximum Suppression (NMS) algorithm is applied to filter out erroneous, overlapping, and inaccurate samples and determine the best detection locations. YOLOv7 outperforms all known object detectors in terms of both speed and accuracy within the range of 5 FPS to 160 FPS. It is primarily optimized in terms of the model architecture and training process.
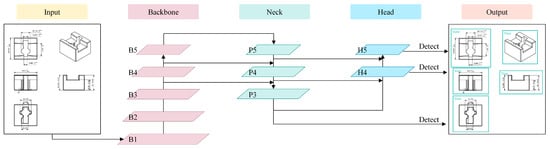
Figure 3. YOLOv7 architecture diagram.
For model architecture optimization, extended efficient layer aggregation networks and model scaling techniques are employed. In the training process optimization, re-parameterization techniques are used to replace the original modules, and a dynamic label assignment strategy is adopted to allocate labels more efficiently to different output layers.
In
Figure 3, the Backbone is primarily responsible for feature extraction and processes the input image through the first pyramid structure. As the numbers increase from B1 to B5, the feature maps of the input image become progressively smaller. With the increasing numbers, the number of features with more channels also increases. The Neck performs upsampling from top to bottom and expands the feature maps layer by layer, reducing the numbers from P5 to P3. Through lateral connections, the Neck merges the features from different layers of the Backbone to obtain scale-rich representation information. The Head then undergoes a reverse process of the pyramid structure and is primarily used for predicting the class and position (bounding boxes) of the target.