Remote sensing technology is vital for precision agriculture, aiding in early issue detection, resource management, and environmentally friendly practices. Recent advances in remote sensing technology and data processing have propelled unmanned aerial vehicles (UAVs) into valuable tools for obtaining detailed data on plant diseases with high spatial, temporal, and spectral resolution. Given the growing body of scholarly research centered on UAV-based disease detection, a comprehensive review and analysis of current studies becomes imperative to provide a panoramic view of evolving methodologies in plant disease monitoring and to strategically evaluate the potential and limitations of such strategies. This study undertakes a systematic quantitative literature review to summarize existing literature and discern current research trends in UAV-based applications for plant disease detection and monitoring.
- unmanned aerial vehicle
- plant disease
- disease monitoring
- image processing
- machine learning
1. Introduction
In all the reviews listed above, an overview of the types of plants and diseases investigated using UAV imagery, the trends of sensor and camera types, along with the related data analysis methods has yet to be provided. Furthermore, as UAV-based plant stress detection is still a subject of ongoing research, a comprehensive overview and interpretation of current research on UAV-based applications for plant disease detection and monitoring is of particular interest. For farmers willing to adopt such approaches, such a comprehensive review can serve as a repository of knowledge, elucidating the evolving landscape of technological advancements and methodologies pertinent to disease management. It also offers a strategic perspective on the potential and limitations of these approaches. For agribusinesses, comprehensive reviews can facilitate informed decision-making regarding investment, implementation, and integration of UAV systems within farm activities. For researchers, in addition to providing potential research avenues, the findings of the review can help create and/or foster collaboration and information exchange, encouraging innovation and cross-sectoral synergy.
In this study, we aimed to analyze current research on UAV-based approaches for plant disease detection, identification, and quantification using a systematic quantitative literature review (SQLR) [28,29]. Through the SQLR we complemented existing reviews by quantitatively assessing the literature on the topic. More specifically, we systematically examined the literature to provide a comprehensive overview of the types of plants and diseases investigated using UAV imagery and to characterize the types of sensors used and methods employed to analyze the images and quantify disease incidence and/or severity. From the analysis, we then discussed future research directions for improved management of plant diseases using UAV-based approaches.
2. UAV-Based Applications for Plant Disease Detection and Monitoring
Plants of Interest Found in Articles
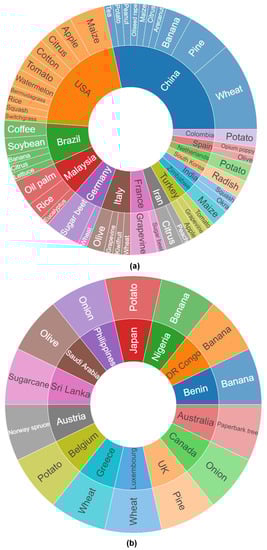
Diseases and Groups of Pathogens Investigated
| Plant | Disease | Related Reviewed Study |
|---|---|---|
| Apple tree | Cedar rust | [37][38][64,65] |
| Scab | [37][64] | |
| Fire blight | [39][66] | |
| Areca palm | Yellow leaf disease | [40][67] |
| Banana | Yellow sigatoka | [41][68] |
| Xanthomonas wilt of banana | [42][36] | |
| Banana bunchy top virus | [42][43][36,38] | |
| Fusarium wilt | [44][45][46][69,70,71] | |
| Bermudagrass | Spring dead spot | [47][72] |
| Citrus | Citrus canker | [48][73] |
| Citrus huanglongbing disease | [49][50][51][52][74,75,76,77] | |
| Phytophthora foot rot | [52][77] | |
| Citrus gummosis disease | [53][78] | |
| Coffee | Coffee leaf rust | [54][55][79,80] |
| Cotton | Cotton root rot | [56][57][81,82] |
| Eucalyptus | Various leaf diseases | [58][83] |
| Grapevine | Grapevine leaf stripe | [59][60][61][62][84,85,86,87] |
| Flavescence dorée phytoplasma | [63][88] | |
| Black rot | [38][62][65,87] | |
| Isariopsis leaf spot | [61][62][86,87] | |
| Kiwifruit | Kiwifruit decline | [64][89] |
| Lettuce | Soft rot | [65][90] |
| Maize | Northern leaf blight | [66][67][68][91,92,93] |
| Southern leaf blight | [69][94] | |
| Maize streak virus disease | [70][71][35,37] | |
| Tar spot | [72][95] | |
| Norway spruce | Needle bladder rust | [73][96] |
| Oil palm | Basal stem rot | [74][75][76][97,98,99] |
| Oilseed rape | Sclerotinia | [77][100] |
| Okra | Cercospora leaf spot | [78][101] |
| Olive tree | Verticillium wilt | [79][32] |
| Xylella fastidiosa | [80][81][102,103] | |
| Peacock spot | [82][104] | |
| Onion | Anthracnose-twister | [83][105] |
| Stemphylium leaf blight | [84][106] | |
| Opium poppy | Downy mildew | [85][107] |
| Paperbark tree | Myrtle rust | [86][34] |
| Peach tree | Fire blight | [87][108] |
| Peanut | Bacterial wilt | [88][109] |
| Pine tree | Pine wilt disease | [89][90]111[91],112[92],113[93][110,,114] |
| Red band needle blight | [94][115] | |
| Potato | Potato late blight | [31][32][33][34][57,58,59,60] |
| Potato early blight | [30][56] | |
| Potato Y virus | [35][61] | |
| Vascular wilt | [36][62] | |
| Soft rot | [35][61] | |
| Radish | Fusarium wilt | [95][96][116,117] |
| Rice | Sheath blight | [97][118] |
| Bacterial leaf blight | [98][119] | |
| Bacterial panicle blight | [98][119] | |
| Soybean | Target spot | [99][100][120,121] |
| Powdery mildew | [99][100][120,121] | |
| Squash | Powdery mildew | [101][122] |
| Sugar beet | Cercospora leaf spot | [102][103][104][105][106][107][123,124,125,126,127,128] |
| Anthracnose | [103][124[104],125] | |
| Alternaria leaf spot | [103][104][124,125] | |
| Beet cyst nematode | [108][129] | |
| Sugarcane | White leaf phytoplasma | [109][130] |
| Switchgrass | Rust disease | [110][131] |
| Tea | Anthracnose | [111][132] |
| Tomato | Bacterial spot | [112][113][114][133,134,135] |
| Early blight | [112][133] | |
| Late blight | [112][133] | |
| Septoria leaf spot | [112][133] | |
| Tomato mosaic virus | [112][133] | |
| Leaf mold | [112][133] | |
| Target leaf spot | [112][113][114][133,134,135] | |
| Tomato yellow leaf curl virus | [112][114][133,135] | |
| Watermelon | Gummy stem blight | [115][63] |
| Anthracnose | [115][63] | |
| Fusarium wilt | [115][63] | |
| Phytophthora fruit rot | [115][63] | |
| Alternaria leaf spot | [115][63] | |
| Cucurbit leaf crumple | [115][63] | |
| Downy mildew | [116][136] | |
| Wheat | Yellow rust | [16][17][18]25][42,43[,4419],45[20],46[21],47[22],48[23],49[24],50[,51] |
| Leaf rust | [16][42] | |
| Septoria leaf spot | [27][53] | |
| Powdery mildew | [26][52] | |
| Tan spot | [27][53] | |
| Fusarium head blight | [28][29][54,55] |
Sensors Used for the Detection and Monitoring of Plant Diseases
Various types of sensors mounted on UAVs have been used to collect high spatial and spectral resolution data for plant disease detection and monitoring (Figure 25). The most used sensors were multispectral, RGB, hyperspectral, and digital cameras. Wheat was the plant whose diseases were investigated using different sensor types (individually or in combination) (Figure 25). Thus, symptoms of yellow rust on wheat leaves have been investigated using data from multispectral sensors [17][19][25][43,45,51], RGB cameras [16][22][24][42,48,50], hyperspectral sensors [18][20][21][44,46,47], and RGB + multispectral sensors [23][49]. Symptoms of Fusarium head blight were identified using data captured by hyperspectral sensors [29][55] and thermal infrared + RGB sensors [28][54], whereas symptoms of Septoria leaf blotch and tan spot were detected using RGB + multispectral sensors [27][53] (Figure 25). Images acquired using multispectral and RGB sensors were more often used to derive vegetation indices (VIs), which allowed for the detection of changes in vegetation health indicative of disease (e.g., discoloration, wilting, spots). Owing to their capability to capture images in different narrow spectral bands, hyperspectral sensors were used to detect more subtle changes in vegetation health that may not be visible with other sensors. Such data were used to create spectral signatures characteristic of a given disease.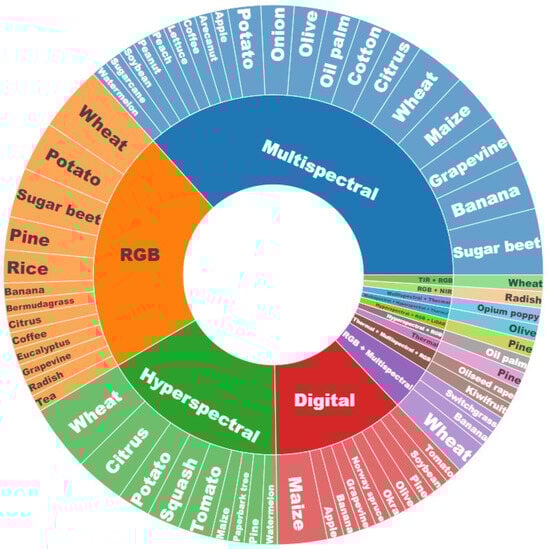
Methods Used for Image Processing and Data Analysis
3. Promising Means for Improving Plant Disease Management
4. The Way Forward
Research on using UAV-based approaches to detect and monitor plant stress caused by diseases is still underway, and there are ample opportunities to develop innovative solutions and improve the effectiveness and efficiency of these approaches. Current image analysis techniques for plant disease detection can be time-consuming, labor-intensive, and computationally demanding, particularly when it comes to using sophisticated CNN-based approaches, that require graphical processing units to train models. Balancing the trade-offs between resource requirements, model complexity, performance, and interpretability, and transfer learning opportunities has guided the choice of the most suitable ML technique for analyzing UAV imagery data. Future research can focus on improving the efficiency of ML-based approaches through the development of more advanced ML algorithms that can analyze images quickly and accurately. This will allow for the development of methods for real-time data analysis and decision-making tools that can be integrated with UAV systems. In this line, future research can investigate the use of reinforcement learning algorithms for plant disease management, which will involve training the models to learn from past actions and make decisions that optimize long-term plant health and minimize disease outbreaks.
There have been encouraging outcomes in integrating multiple sensors to provide more detailed and accurate data for plant disease detection, as highlighted by the number of related research articles, though this remains limited to a few numbers of plant species and diseases (Table 1Table 2). Future research can explore extending such approaches to economically important plant diseases of major food crops, such as rice, wheat, maize, cassava, plantains, potatoes, sorghum, soybeans, sweet potatoes, and yams, around the world. Research can also focus on integrating UAV data from multiple sensors or with satellite imagery (i.e., data fusion) for plant disease detection, as it has been explored for crop yield forecasting [118]([142]) and crop monitoring [119]([143]). Such UAV and satellite data fusion will allow for a better understanding of crop health patterns and trends over large areas [120][144].