Your browser does not fully support modern features. Please upgrade for a smoother experience.
Please note this is a comparison between Version 1 by Shuangquan Liu and Version 2 by Jason Zhu.
China has made significant progress in developing renewable energy, but challenges in integrating variable sources like wind, solar, and hydro power persist. Existing research has a regional focus and lacks a comprehensive understanding of integration challenges in specific regions. Moreover, research concentrates on individual energy types rather than multiple sources.
- renewable energy consumption
- electricity market
- market mechanism
1. Policies to Encourage Consuming Renewable Energy
China’s National Energy Administration (CNEA) issued the “Guidelines on establishing a target guidance system for the development and utilization of renewable energy” in March 2016, aiming to scientifically plan the targets for developing renewable energy to address increasingly prominent problems in integrating renewable energy. Then, it issued the “Implementation scheme to reduce the waste of hydro, wind and solar energies”, “Clean energy integration action plan (2018, 2020)”, and other documents to encourage taking active measures to promote high-quality development and adequate integration of renewable energy. In 2018, the CNEA solicited and discussed comments three times on the “Renewable energy power quota and assessment methods”, indicating the transition of the energy-supporting policy of China from price-fixed electricity to a renewable energy quota system. In May 2019, the China National Development and Reform Commission (CNDRC) and the CNEA jointly issued a notice on “Establishing and improving the mechanism to ensure adequate integration of renewable energy”, requiring regions at the provincial level to share responsibility for integrating renewable energy. In June 2022, the National Development and Reform Commission, the Energy Administration, and nine other departments jointly issued the “14th Five-Year Plan for Renewable Energy Development”, anchoring the goals of carbon peak and carbon neutrality, clarifying the main directions and targets of renewable energy development during the 14th Five-Year Plan period, with the intent that renewable energy will change from the original incremental supplement of energy and electricity consumption to the main body of energy and electricity consumption increase [1][8].
2. Development of Renewable Energy
The installed capacity of renewable energy in China was 0.48 billion kW at the end of 2015. During the 13th Five-Year Plan period, China invested about CNY 2.5 trillion in renewable energy, making the country the largest renewable investor in the world and strongly promoting the optimization of China’s energy structure. After steady year-by-year growth, it reached 1.063 billion kW for renewable energy by the end of 2021, increasing by up to 120% compared to 2015. Among the renewables, wind and solar power increased most significantly. The solar power growth rate increased by nearly 80% in 2016, the first year of the 13th Five-Year Plan, and wind power also reached its peak growth in 2020. Figure 12 illustrates the installed capacities (a) and growth rate (b) of renewable energy in China from 2015 to 2021 [2][3][4][5][6][7][8][9,10,11,12,13,14,15].
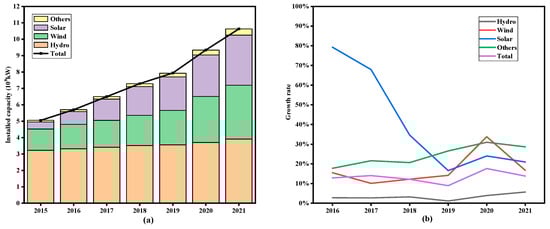
Figure 12.
Installed capacities (
a
) and growth rate (
b
) of renewable energy in China from 2015 to 2021.
Figure 23 depicts the proportion of installed capacity for various energy sources in 2022. The proportion of renewable energy’s installed capacity had increased to 47.3%. As the country with the largest renewable energy production capacity, China’s utilization of renewable energy is constantly improving. In 2022, China produced 2.7 trillion kWh of renewable energy, with a year-on-year increase of 1.7%, accounting for 31.6%% of the total electricity generation [9][16]. By the end of July 2023, China’s renewable installed capacity reached 1.32 billion kW, accounting for 48.7% of the total installed capacity, including 418 million kW of hydropower, 389 million kW of wind power, and 470 million kW of solar power [10][17]. The total installed capacity of hydro, wind, and solar power is the largest in the world, and the role of renewable energy in replacing fossil fuel energies is increasingly prominent.
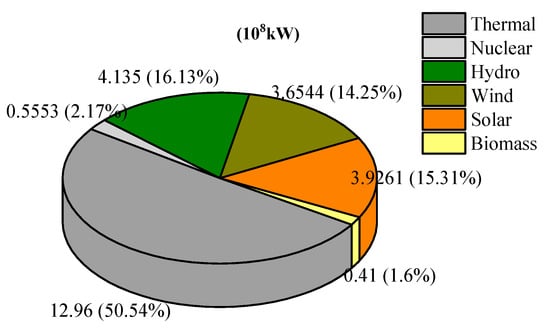
Figure 23.
Proportion of installed capacity for various energy sources in 2022.
3. Integration of Renewable Energy
3.1. Hydropower
China is rich in hydropower resources, with the installed hydropower capacity accounting for more than 30% of the world’s total. The hydropower resources are distributed unevenly over regions in the country, mainly concentrated in the southwest areas, especially in Yunnan and Sichuan Provinces. The current economic development and industrial structure make it possible to consume only a small part of hydropower production locally, and the construction of power grids is relatively lagging, leading to insufficient capacity in transmitting electric power across regions. Hydropower spillage is particularly massive in the southwest, where the installed capacity and production of hydropower keep growing. In 2016, Yunnan and Sichuan Provinces had 31.4 and 16.4 billion kWh of hydropower curtailment, respectively, accounting for about 96% of the total spillage in China [11][18].
In 2017, the CNDRC and CNEA jointly issued a “Notice on promoting hydropower integration in Southwest China” to effectively address hydropower curtailment problems in the southwest by planning and constructing more electric power transmission facilities and, at the same time, establishing and improving the market mechanisms to integrate more hydropower production. The amount of hydropower curtailed in Sichuan Province dropped to 9.2 billion kWh in 2019, falling for three consecutive years and reaching the lowest level in six years, and in 2021 9.444 billion kWh of abandoned hydropower was discarded—a year-on-year decrease of 22.6%, mainly attributable to a better trading mechanism in the electricity market and the full operation of UHV power transmission channels, especially the Fufeng and Binjin channels. In the same year, only 2.4 billion kWh of hydropower was curtailed in Yunnan Province, which fostered its power demand by vigorously supporting energy-intensive industries such as electrolytic aluminum and silicon plants, and at the same time promoting wider consumption of clean energy by selling more electricity across provinces through the market trading mechanism. Despite the decreasing hydropower curtailment rate in China over the years, challenges remain in effectively integrating hydropower energy, due to various factors, such as slowing economic growth and obstacles in delivery channels.
3.2. Wind Power
In 2020, the installed capacity of wind power connected to power grids increased by 71.7 million kW, up by 178% year on year, and the total installed capacity of wind power was 282 million kW, accounting for 10.4% of the total installed capacity in China. The wind power generation reached 466.5 billion kWh, up 15% year on year, accounting for 21.2% of the total generation. During the 13th Five-Year Plan period, the average utilization hours of wind power in China increased significantly, from 1728 h in 2015 to 2082 h in 2019, with a cumulative increase of 20.48%. Yunnan Province has the most average utilization hours of wind power in China, at 2808 h, followed by Fujian Province and Sichuan Province. Meanwhile, introducing renewable energy quotas and a moratorium on new wind power projects in areas with high wind curtailment has helped ease the wind curtailment and power rationing across the country. Figure 34 illustrates the new installed capacities, generations, curtailment, and curtailment rates of wind power during the 13th Five-Year Plan in China. New installed capacity and generation for wind power continued to increase constantly, while curtailment and the curtailment rate gradually reduced. The curtailment rate for wind power in 2020 reached to 3%, indicating that the consumption of wind power has continued to improve [7][12][13][14][15][14,19,20,21,22].
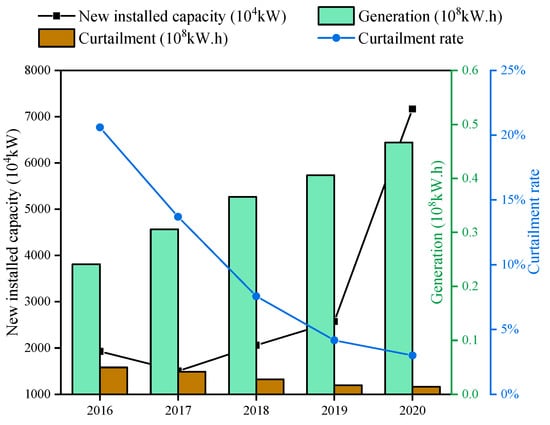
Figure 34.
New installed capacities, generations, curtailment, and curtailment rates of wind power during the 13th Five-Year Plan in China.
At present, Northwest China is where most of the wind curtailments occur. In 2021, the wind power utilization rates in Xinjiang, Qinghai, and Inner Mongolia were 92.7%, 89.3%, and 91.1%, respectively, which are still far from the national average wind power utilization rate of 96.9%.
3.3. Solar Power
In 2021, China’s new grid-connected photovoltaic power generation capacity was 54.88 million kilowatts, of which distributed photovoltaic installation added 29.28 million kilowatts, exceeding 50% for the first time, and the trend of centralized and distributed development of photovoltaic power generation is evident. The installed capacity of distributed photovoltaics exceeded 100 million kilowatts, accounting for about one-third of the total grid-connected installed capacity of photovoltaic power generation.
The government issued a “Notice on matters concerning solar power generation” in 2018 to control the construction scale of solar power projects and promote the integration of solar energy by strictly limiting and reducing price subsidies for new photovoltaic projects. China generated 224.3 billion kWh of solar energy in 2019, an increase of 89.5% compared with 2017. The average annual utilization of solar power was 1169 h, with a total of 4.6 billion kWh curtailed in 2019, and the curtailment rate dropped to 2%. Figure 45 illustrates the development and consumption of solar power during the 13th Five-Year Plan period. The new installed capacity and curtailment rate of solar power show a similar trend to that seen for wind [11][16][17][18][19][18,23,24,25,26].
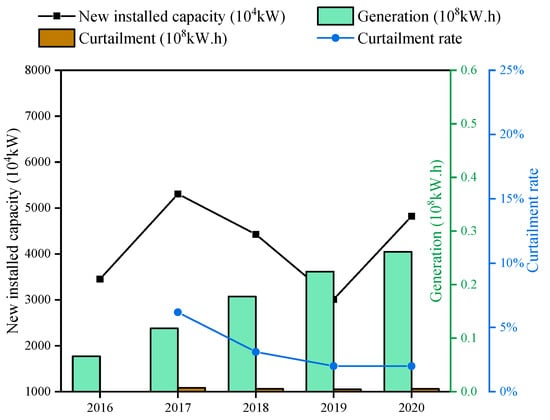
Figure 45.
New installed capacities, generations, curtailment, and curtailment rates of solar power during the 13th Five-Year Plan in China.