Your browser does not fully support modern features. Please upgrade for a smoother experience.
Please note this is a comparison between Version 1 by Wenyang Shi and Version 2 by Fanny Huang.
Petroleum engineers need real-time understanding of the dynamic information of reservoirs and production in the development process, which is essential for the fine description of oil and gas reservoirs. Due to the non-invasive feature of electromagnetic waves, more and more oil and gas reservoirs have received attention to capture the development dynamics with electrical resistance tomography (ERT). By measuring the distribution of resistivity on the surface, the ERT can offer information on the subsurface media.
- tomography
- residual oil distribution
- electrical resistance tomography
- oil and gas reservoirs
1. Introduction
Monitoring the dynamics of oil and gas reservoir development can provide in-time information about the reservoir and provide key data support for reservoir engineers. Accurate monitoring results can provide an in-depth understanding of the dynamic changes, reserve distribution, fluid migration, and other characteristics of the reservoir to maximize the development and utilization of oil and gas resources, reduce the development risk, and improve the recovery rate and production. Therefore, monitoring the dynamics of oil and gas reservoir development is of great importance in oil and gas exploration and exploitation. Electrical Resistance Tomography (ERT), as a non-invasive and real-time subsurface imaging technology, occupies a key position in the process of monitoring the dynamics of oil and gas reservoir development. Its successful application in the field of monitoring the dynamics of oil and gas reservoir development has been recognized by many experts and researchers [1][2][3][1,2,3].
ERT is a multidisciplinary real-time online detection technology that meets the needs of actual industrial production and has been widely used in the fields of chemical engineering industry [4], environment and pollution [5][6][5,6], biomedical and pharmaceutical [7], biological and ecology [8], new energy [9], and marine development [10][11][10,11]. The origin of Electrical Resistance Tomography (ERT) can be traced back to the resistivity imaging of linear electrode arrays proposed in the 1920s [12], and the concept of “flow imaging” and the technique of “process tomography” were proposed by a research team at the University of Manchester, UK, in 1985 [13], which laid the foundation for modern industrial chromatography. Currently, the widely used and mature technology of Electrical Impedance Tomography (EIT) includes Electrical Capacitance Tomography (ECT) [14], Electrical Resistance Tomography (ERT [15][16][15,16], and Electromagnetic Tomography (EMT) [17][18][17,18]. In the 1990s, ERT was rapidly expanded into the industrial field, where it is used in groundwater resource management, environmental monitoring, monitoring pipeline blockage and fluid distribution in petrochemicals, and detection of underground CO2 transport [19][20][21][22][19,20,21,22].
Potentiometric testing has been utilized in the oilfield since the mid- to late-1900s. Meanwhile, ERT technology has been gradually applied to the dynamic monitoring of oil and gas reservoirs and verified in actual oilfields. The well-known Sandia Laboratories in the U.S.A. used this technique to evaluate the asymmetry of fractures and to detect the orientation of hydraulically fractured fractures, among other things [23]. Ref. [24] used this method to find a high abundance of dead oil zones in several lithologic traps in an oil-bearing region of the former Soviet Union. Ref. [25] used this method to identify the depth of burial and the distribution of geothermal reservoirs in a regional hot field. [26] used this method to effectively monitor oil and gas reservoirs in terms of the direction of the hot-water tongue and the advancement of water injection. Ref. [27] investigated the flow process during water displacement of oil in a sand-filled model using a low-field ERT basis indoors, which demonstrates the promising application of ERT for monitoring the dynamics of porous media.
At the beginning of the 21st century, with the advancement of computer technology and data processing algorithms, ERT technology has been further improved in monitoring the dynamics of oil and gas reservoir development. In China, ERT has been utilized in many oilfields such as Shengli, Daqing, and Changqing, with a total of more than 400 times, and the construction failure rate is 0% [28]. Through field exploration and experimentation, researchers have verified the feasibility and effectiveness of ERT in monitoring the dynamics of oil and gas reservoir development [29][30][29,30]. High-resolution data acquisition equipment, advanced imaging algorithms, and real-time monitoring systems enable ERT to provide more accurate and faster acquisition and analysis of reservoir information. In recent years, ERT has often been used in combination with other monitoring techniques to obtain more comprehensive reservoir information. Through the comprehensive application of multiple monitoring means, accurate monitoring and evaluation of key parameters such as reservoir dynamic changes, flooding effect, and oil-water interface can be realized [31][32][33][31,32,33].
2. Application of Electrical Resistance Tomography Technology
For the oil reservoir, natural gas reservoir, and coal mine in China, the ERT can be widely used to analyze residual oil distribution, capture flooding fronts, and monitor hydraulic fracturing.
2.1. Residual Oil Distribution Study
ERT technology can reveal the resistivity distribution characteristics of underground reservoirs and infer the location of the waterflood front edge and the distribution of residual oil. In general, underground reservoirs show non-uniformity, especially in the “favorable channel” with good porosity and permeability; the saturation of reinjected wastewater is larger and the resistivity is relatively low, while the resistivity is relatively high in the lithologically dense section and the section with a large saturation of residual oil [34][57]. Anomalies in underground resistivity will have different effects on the distribution of surface potential values. Based on current-conductive theory in the uniform conductor [35][36][37][34,35,36], the distribution of the equipotential lines is a uniform concentric circle [38][40]. When one of the strata is replaced by high resistance, the surface equipotential line appears to be compressed inward. When one of the strata is replaced by low resistance, the surface equipotential line appears to be extended to the place.
Therefore, combining the information of sedimentary phase distribution, lithology information, and formation water mineralization of underground strata, researchers use the anomalous potential inverse to perform the distribution image of resistivity and then calculate the distribution of oil saturation. For example, ref. [39][59], in response to the problem of unclear residual oil distribution in five wells of the Y Oilfield in the Muglad Basin, Sudan, and the unknown effect of water injection, used ERT to obtain the 3D resistivity distribution of the Aradeiba Foamtion in the basin. The high resistivity (18~20 Ω·m) is distributed in the southeast of the top layer and the northwest, central, and southeast of the bottom layer. The high resistivity is the high remaining oil saturation zone, and the low resistivity (3~10 Ω·m) represents the high-water saturation zone. The black dots on the graph represent well locations. The difference in the resistivity distribution shows the oil saturation of the bottom layer is higher than the top layer as a whole, and Aradeiba has a strong heterogeneity and complicated oil-water interface.
Then, their team used the resistivity slices obtained by inversion to calculate oil saturation slices, which revealed the block distribution of the remaining oil-rich area and the characteristics of the spatial distribution of oil and water [39][59].
Ref. [40][60] used ERT to obtain the field-measured potential data of the 26-J9 well zone of the eighth section in Gudong Oilfield, processed the measured potential data with numerical simulation and inverse imaging methods, and obtained the resistivity and residual oil saturation distribution of the target formation in the 26-J9 well zone. Ref. [41][61] focused on the application of the image processing method of well potential measurement data in the Wu1 Block of Xingjiang Oilfield and analyzed the correspondence between the distribution of residual oil and the effect of injection and extraction. Ref. [42][62] applied the ERT to measure and obtain the measured potential data of four blocks in the hilly reservoir, which provided a good basis for monitoring the residual oil distribution in a low-permeability sandstone reservoir. Ref. [43][63] focused on the residual oil distribution in the Daqing Oilfield based on the well-ground ERT technology. Ref. [44][64] established a three-dimensional geological model with ERT constraints by combining the resistivity and saturation distribution within the Chi-46 well area of JiYuan Oilfield with ERT technology and introduced reservoir evaluation parameters on this basis, which in turn led to favorable zone prediction of the reservoir. Ref. [45][65] focused on analyzing and evaluating the application effect of ERT technology in the Daqing Sabei Oilfield 9-102 well area, which showed the good application prospect of ERT technology in the remaining distribution study. Ref. [46][66] obtained more reliable ERT measurement data through EPI measurements and data processing of 7 wells in the Konys-406 well group in Area K, Kazakhstan, and the raw data truly and reliably reflected the resistivity of the subsurface. The resistivity and residual oil saturation distribution characteristics of the subsurface medium were obtained by inverse imaging of the standardized potential data. Ref. [47][67] also verified the applicability of ERT technology in the target area by testing.
2.2. Waterflood Front Detection Study
Well-ground ERT technology can not only provide important clues about the formation characteristics and hydrocarbon distribution through the distribution of residual oil but also better evaluate the water drive effect and water injection program through the detection of the leading edge of waterflooding [48][49][68,69]. In the waterflooding process, due to the relative mobility difference between water and oil, the water pushes the oil toward the extraction well, forming the waterflood front. The purpose of the downhole ERT technology is to accurately monitor the change in subsurface resistivity, invert the resistivity distribution, and finally calculate the distribution of the waterflood front. For EOR in tight oilfields by the waterflood, the fracturing well is widely used in the injection-water well. To obtain the waterflood front information of the fractured injection-water well, [50][38] estimated the water breakthrough locations of multi-stage fractured horizontal wells by combining pressure-transient analysis and ERT. The injection well is the vertical well, and the production well is the horizontal well. Due to the fact that the wellbore of the production is longer than the injection-water well, the tested points are located at the production and distributed along the wellbore.
Ref. [51][70] tested the waterflood leading edge of the Zhuang 9 well area of the Xifeng oilfield by using the ERT technique and adopted the five-point method of well network injection to improve the water-driven effect in this type of reservoir. Ref. [52][71] inversely imaged the water injection and waterflood front in a muddy sandstone reservoir by placing electrodes in water injection and production wells using inter-well time-shift resistivity imaging. Ref. [53][72] monitored the results of brine tracers over time using well-ground and interwell electrical resistivity tomography. Based on the principle of well-ground ERT, the research team at China University of Geosciences (Beijing) established a multi-layer joint inversion method for large inclined and horizontal wells, inverted the ground potential response using the finite difference and conjugate gradient methods, and determined the transport direction of water bodies in each layer before and after injection by constructing 3D imaging maps of the injection layer [54][73].
2.3. Monitoring Dynamics of Hydraulic Fracturing Effects
Hydraulic fracturing is a process widely used in oil and gas exploration and development, based on the principle that fracturing fluids (mainly containing water, thickeners, sand, or other proppants) are injected into a well at high pressure, and the pressurized fluids pass through the well into the reservoir to fracture the rock. In this way, the fracture extends into the reservoir and increases the effective permeability of the reservoir, thereby increasing its ability to produce oil or natural gas.
Hydraulic fracturing has become a cost-effective and indispensable method for oil and gas exploration and development to modify the reservoir structure. In hydraulic fracturing, the orientation direction and real-time shape of the fracture are directly related to the effect of oil and gas reservoir modification; therefore, the real-time monitoring of fracture morphology is a key technology in the fracturing process, and the ability to accurately monitor the fracture orientation and geometric parameters directly affects all aspects of evaluating the fracturing effect, improving the fracturing process, and improving the recovery rate of oil and gas [55][74]. The application principle of ERT technology in the hydraulic fracturing process is to use the casing and fractured fractures filled with conductive fracturing fluid as the transmission medium to inject high current into the subsurface to form a subsurface electric field, and then to deploy ring-shaped measuring electrodes at the wellhead of the measuring wells located on the surface, and to use the measured potential data to invert and derive the information of the relevant parameters of the subsurface fractures as shown in Figure 1.
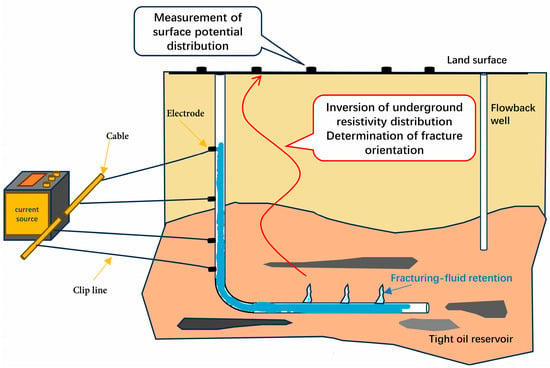
Figure 1.
A schematic diagram of the application of ERT technology in the hydraulic fracturing process.
The determination of artificial fracture azimuth and fracture extension length is the main problem of the wellbore potentiometric method in hydraulic fracturing, and many researchers have conducted extensive research on this issue. The Institute of Enhance Oil Recovery Technology of Dagang Oilfield, China, has researched monitoring fracture azimuth using a well-ground potentiometric method since the 1980s and initially formed a series of more mature potentiometric monitoring technology systems.
Ref. [56][75] obtained the geometric parameters of fracture distribution before and after hydraulic fracturing of the M1 well in the coalbed methane exploration area of the Beipiao coal mine by using ERT technology, which demonstrated that ERT technology has a good prospect of application for detecting hydraulically fractured joints. Ref. [57][76] introduced the potentiometric well monitoring technique for the real-time detection of fracture size and orientation during the fracturing process to deploy the whole well network for the development of extra-low permeability reservoirs in the Wuhaozhuang reservoir of Shengli Oilfield and judged the fracture location by the outer ring potentiometric anomaly curves, which provided the theoretical basis for the deployment of the well network in the subsequent blocks and the analysis of the fracturing effect.
In addition, Ref. [58][77] analyzed and evaluated the hydraulic fracturing process of Carboniferous volcanic reservoirs in the J230 well area of Karamay Oilfield by using ERT fracture monitoring technology for data monitoring, which provides a reference basis for the optimal design of fracturing in this type of reservoir, the preferred selection of action scheme, the overall treatment of injection and extraction units, and the improvement of recovery rate. Ref. [59][78] conducted indoor and outdoor experiments, respectively. The outdoor experiments took Chao 121-27 in the Chaoyanggou oilfield of Daqing 10th plant as the research object, and the fracture orientation was inferred by the potential anomaly curve, which laid the foundation for the start of ERT technology fracture monitoring field experiments.
Ref. [60][79] conducted the research on the hydraulic fracturing dynamic monitoring method based on wellbore ERT technology and used finite element COMSOL software (https://cn.comsol.com/) to successively optimize the current source model, and the results of its inverse performance were more consistent with the actual morphology of the fracture. They then verified the correctness of the orthogonal model through flume simulation experiments. Ref. [61][80] used the new ERT method to successfully estimate the range and aperture diameter of hydraulic fracturing, which provided the basis for oil and gas recovery and thermal engineering support. Ref. [62][81] considered that a complex fracture network providing flow channels would have a significant impact on well performance in unconventional reservoirs. A foundation was laid for subsequently obtaining more accurate rate transient responses as well as fracturing parameter estimation. The team from China University of Petroleum (Beijing) adopted a multi-section fractured horizontal fluid production profile monitoring method for multi-fractured horizontal wells (MFHWs) in Changqing Oilfield by combining the unstable well test and well ground ERT techniques and effectively diagnosing the location of water seen in the wellbore of MFHWs [50][62][63][38,81,82]. Their team also studied fractures induced by water drives around injectors in tight reservoirs. By studying fracture length, fracture conductivity, bottom-hole pressure [64][83] and other related parameters, a new semi-analytical model is proposed. The new progress of water injection-induced dynamic fracture characterization technology at home and abroad is clarified, and the impact of dynamic fracture on water injection development and the well network encryption adjustment strategy based on dynamic fracture are systematically elaborated [65][84]. In addition, the research team introduced big data technology applied to the prediction of reservoir parameters and evaluation of well production capacity in oil fields in the western part of the South China Sea [66][85].
Ref. [67][86] studied the orthogonal model, numerical simulation, and optimized design of the on-site monitoring system and data analysis of the well-ground potential measurement method, and further verified the reasonableness of the orientation and length prediction of fractured fractures using the potential method by using the finite element COMSOL software, which will be a reference value for the future improvement of fracturing operation effects and optimization of fracturing design.
2.4. Advances in Well-Ground ERT Equipment Improvement and Forward and Backward Optimizations
Equipment optimization and algorithm optimization are the key driving factors to promote the continuous development and application of well-ground ERT technology and are also important ways to realize the efficient cooperation and optimized performance of the various parts of the well-ground ERT workflow. Specifically, the well-ground ERT work operation is mainly composed of the surface multi-electrode array, power source, data acquisition and processing unit, and image reconstruction and analysis unit. A multiple-line electrode array is used in the horizontal wellbore to measure the resistance of the reservoir during the injection and production testing processes. In the test process, the equipment and the inverse algorithms play a very important role. Therefore, the advanced equipment and optimized forward and inverse algorithms promote each other to improve the accuracy and efficiency of data acquisition and optimize the accuracy and reliability of image reconstruction and parameter inversion.
2.4.1. Equipment Optimization
Equipment optimization aims to improve measurement efficiency and data quality so that the borehole ERT can obtain the underground resistivity distribution information faster and more accurately by improving the electrode design and placement, optimizing the data acquisition instrument, improving the multi-electrode array design, and introducing system control and automation technology.
At present, research scholars in the U.K. have conducted many studies on equipment improvement and algorithm optimization. Aiming at different engineering backgrounds of oil-gas-water multiphase pipe flow generation, Mi Wang’s research team at the University of Leeds, UK, has successively designed various electrode sensor arrays such as annular [68][89], linear, parallel, and U-shaped [69][90], developed single/dual/multi-sectional unimodal and double-modal inspection devices, and established supporting image reconstruction algorithms, and established supporting image reconstruction algorithms, and applied the double-model electrostatic tomography (ERT-ECT) technique to identify the stratified flow, slug flow, plug flow, annular flow, and bubbly flow within the oil-gas-water three-phase flow system in a horizontal pipe [70][71][72][91,92,93]. Usually, ERTs recognition of non-liquid phases, especially gas, is not very good; however, in Mi’s double-model, the gas, oil, and water are very easily captured and calculated by the ERT field. The results show that the improvement and upgrade of ERT equipment is an important way to accurately obtain fluid parameters.
Ref. [73][88] has developed high-quality unpolarized electrodes with small differential potentials, good stability performance, low noise, wide bandwidth, light and durability, and easy storage in response to the disadvantages of well-ground ERT electrodes, which are similarly affected by the natural potentials of the well and ground sites and the interference of industrial frequency, the change of ambient temperature, and the polarization phenomenon of electrodes. More accurate data processing of the measured data will further provide effective technical support for the development and utilization of petroleum and minerals. In addition, Ref. [74][94] improved the well-ground ERT equipment and designed a synchronization scheme combining Beidou satellite timing technology, a local clock system, and wireless radio frequency transmission technology, which was applied to the well-ground water-driven leading edge and fractured fracture resistivity stratigraphic imager, so that the data collected by the instrument in the test were guaranteed and reached the synchronization level of the similar geological exploration instruments at home and abroad. Ref. [75][95] investigated the ERT data quality control problem, proposed a bipolar-bipolar co-current channel set method for rapid detection of ERT data quality, and suggested data quality control and hydraulic conductivity fracture delineation before ERT inversion and tracer testing. Ref. [76][96] focused on small-scale ERT for high-resolution subsurface imaging, including 3D modeling and electrode configuration. It was deduced that small-scale ERT requires accurate electrode representation and placement. Ref. [77][97] designed a hybrid resistivity tomography and induced polarization (ERT/IP) cable/distributed system. This system with multi-source capability allows for the transmission of as many sources as possible when using separate lines, thereby increasing the current input to the ground and increasing the depth of investigation and resolution. To develop an inter-well ERT system for CO2 transport monitoring in the formation, Ref. [78][98] optimized the electrode array and verified its usability.
2.4.2. Algorithm Optimization
Algorithm optimization focuses on improving data processing and interpretation capabilities. By improving the data processing and inversion algorithms, the Well-Ground ERT technique can more accurately reconstruct subsurface structure and properties from measured data. Optimized data processing algorithms filter out noise, correct data, and provide more accurate interpretations. Improved inversion algorithms provide engineers with more detailed information about subsurface structure by more accurately inverting the resistivity distribution of the subsurface medium from resistivity measurements. To study the surface potential response caused by 3D anomalies in the subsurface, [79][99] designed an orthogonal algorithm of a well-ground ERT technique based on practical problems and finally gave the map obtained by the orthogonal algorithm. The constraints are provided, and the foundation is laid for further 3D inversion studies. Ref. [80][100] investigated point current sources (single or multiple points) and arbitrary line current sources when supplied in a well and three-dimensional resistivity forward and inverse under the ground receiving mode. It provides a very meaningful guide for the design of field observation systems. [81][101] discussed the method of underground vertical line source segmentation calculation and field superposition and realized the 3D numerical simulation of DC power supply on the casing, which provides some reference basis for the design of the well-ground ERT technology. Ref. [82][102] investigated an intrusive resistive tomographic imaging sensor for vertical oil well production logging, applying a sensitivity-based algorithm for image reconstruction. Ref. [83][103] completed Bayesian ERT inversion based on non-smooth inverse martensitic covariance matrices. A team of researchers led by the Pacific Northwest Laboratory (PNNL) in the United States intentionally measured electrical conductivity in rocks using the ERT program and generated 4D (3D + time-lapse) images of the subsurface. In addition, Tim Johnson, a key member of the team, has developed E4D software (https://www.pnnl.gov/projects/e4d, accessed on 15 August 2023) that runs on a supercomputer and displays all the electrical signals and fluctuating conditions over time in a heat map-like visualization [84][87].
Ref. [85][104] studied the problem of three-dimensional resistivity inversion polysolvability and proposed a method based on the constraints of the reference model. By fusing multiple geophysical information, an accurate reflection of anomaly morphology and resistivity is achieved, and polysolvability is suppressed. Ref. [86][105] investigated the resistivity logging problem in the two-phase test wells of water injection, and using iterative numerical algorithms and orthogonal simulation methods, they concluded that the resistivity logging data can reflect the change in water mineralization. Ref. [87][106] used the DBSCAN (Density-Based Spatial Clustering of Applications with Noise) clustering algorithm to improve the interpretation of the inverted ERT sections.