Your browser does not fully support modern features. Please upgrade for a smoother experience.
Please note this is a comparison between Version 1 by Dmitriy Viderman and Version 2 by Jason Zhu.
Perioperative disorders of neurocognitive function are a set of heterogeneous conditions, which include transient post-operative delirium (POD) and more prolonged post-operative cognitive dysfunction (POCD).
- general anesthesia
- regional anesthesia
- post-operative delirium
1. Introduction
Perioperative disorders of neurocognitive function are a set of heterogeneous conditions, including post-operative cognitive dysfunction (POCD) and post-operative delirium (POD) [1]. POCD is one of the most common complications in the elderly patient population after surgery under general anesthesia [2][3][4][2,3,4]. POCD is characterized by a new cognitive impairment that occurs after a surgical procedure [2]. Its manifestations are subtle and manifold, depending on the affected cognitive function. The most commonly seen problems are memory impairment and impaired performance on intellectual tasks [2]. POCD involves several cognitive domains, such as attention, memory, and executive functions [5][6][5,6]. In turn, attention impairment in POCD combines disorder of the following independent networks: (1) alerting, (2) orienting, and (3) executive control, which is distinguished at the biochemical and cognitive levels [5][6][7][8][5,6,7,8]. The diagnosis requires both pre- and post-operative psychometric testing. Several previous studies reported long-term POCD in elderly patients.
It has been consistently speculated that the risk of POCD might be mitigated if surgical procedures are performed under local or regional anesthesia. However, previous studies did not find a significant difference when comparing general anesthesia and regional anesthesia using neuropsychological testing [5][9][10][5,9,10].
Hypothetical mechanisms of POCD include surgical trauma and neuroinflammation through disruption of the blood–brain barrier (BBB), leading to functional disruption of neural activity and POCD [1]. Each element of this hypothesis is controlled by a variety of inflammatory mediators. These events can persevere long-following surgery resulting in neurocognitive decline, especially in frail patients [1].
The second type of disorder of neurocognitive function is delirium. Delirium is an “organ failure of the brain”. Post-operative delirium (POD) is a frequent neuropsychiatric post-operative complication, predominantly in elderly patients [11]. The incidence of POD is reported to occur from 10% to 70% of patients depending on patient age, comorbidities, and type of surgery [12].
POD worsens short- and long-term outcomes, associated with high morbidity and mortality rates, high post-operative complication rates, prolonged intensive care unit (ICU) and hospital stay, loss of independence, long-term disability, increased hospitalization cost, and medication use [13]. POD is associated with an increased risk of persistent cognitive dysfunction and dementia [14]. Cognitive dysfunction is identified using a series of neuropsychiatric tests that offer a detailed assessment of higher cortical function rather than the usual neurological examination. It is difficult to determine the precise cause of POCD, for example, surgery-related or anesthesia-related, and these causes are currently almost inseparable.
Taking into account that the proportion of the elderly population and the number of surgical procedures in this population is growing rapidly, it is important to find the anesthetic method with the least negative effect on cognitive function. Since the percentage of the elderly population is expected to increase, the burden of this problem is expected to increase as well [11][12][13][11,12,13].
2. Incidence of Post-operative Delirium
The incidence of post-operative delirium was reported in five [10][15][16][17][18][10,21,22,24,26] studies (Figure 1). The overall effect of the model shows no significant difference between RA and GA (risk ratio, RR, with 95% CI: 1.10 [0.91, 1.33], p-value = 0.33, I2 = 0).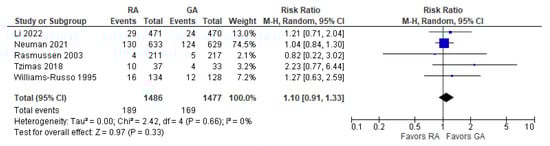
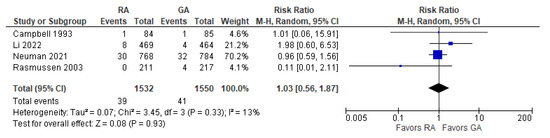
3. Incidence of POCD Per-Protocol Analysis
The incidence of POCD was reported in two [10][19][10,23] studies. The overall effect of the model (Figure 2) shows no risk difference between the RA group and the GA (RR with 95% CI: 1.27 [0.61, 2.67], p-value = 0.52, I2 = 68% (moderate)). The subgroup analysis for one week postoperatively and three months postoperatively shows no difference either. However, in one week postoperatively, the result is sensitive to the exclusion of Silbert 2014 [19][23]: the model tends to favor RA over GA.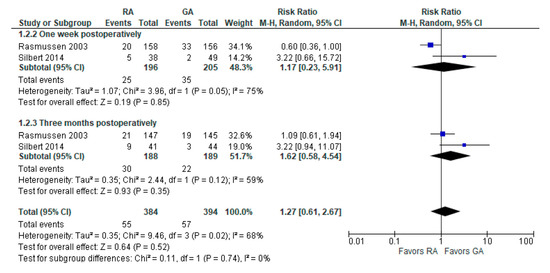
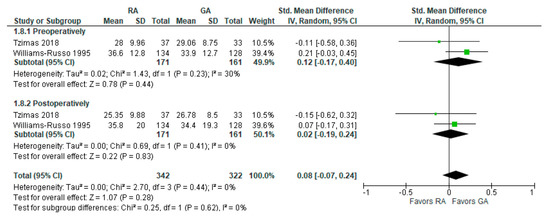
4. Psychomotor/Attention Tests (Preoperatively/Baseline)
The psychomotor/attention (preoperative/baseline) tests’ results were reported in six [17][18][20][21][22][23][16,18,19,24,25,26] studies (Figure 3). Weber et al., 2009 [23][25] reported (the German version) trail-making test results; researchers incorporated it as A test (A subgroup). The overall effect of the model does not show any difference between RA and GA (SMD with 95% CI is 0.17 [–0.18, 0.53]), and this result is insensitive to the exclusion of any study. In subgroup analysis, the model does not show any difference between RA and GA in all subgroups.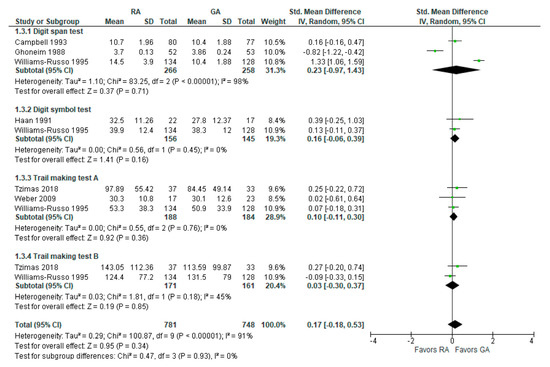
5. Psychomotor/Attention Tests (Postoperatively)
The psychomotor/attention (post-operative) tests’ results were reported in six [17][18][20][21][22][23][16,18,19,24,25,26] studies (Figure 4). For a digit span test, three studies [18][20][21][16,18,26] reported measured results in three different time intervals: two weeks, mean one to ten days, and one week postoperatively. In this subgroup analysis, the model does not show any difference between RA and GA. For a digit symbol test, the model based on two studies [18][22][19,26] does not show any difference between RA and GA. The data values were given as a mean of four days [22][19] and at one week postoperatively [18][26].
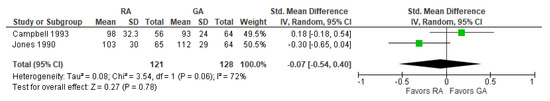
6. Visual Recall Test (Memory Test Postoperatively and Follow-up Study)
Visual recall test (memory test) results were reported in two [18][22][19,26] studies (Figure 5). In a visual recall test conducted four days postoperatively by Haan et al., 1991 [22][19] and one week postoperatively by Williams-Russo et al., 1995 [18][26], the model does not show any difference between RA and GA, and the result is insensitive to the exclusion of either study. The overall effect of the model on the results of the memory tests does not show any difference between RA and GA, and this result is insensitive to the exclusion of any study.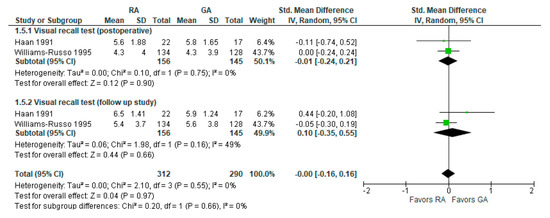
7. MMSE Score 24 h Postoperatively
The post-operative mini-mental state examination (MMSE) test score was reported in three [17][24][25][17,24,27] studies (Figure 6). The overall effect of the model does not show any difference between RA and GA, and this result is insensitive to the exclusion of any study.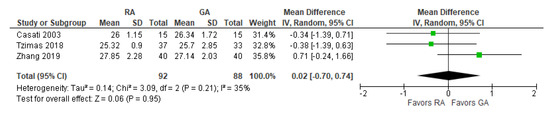
8. Reaction Time Three Months Postoperatively (ms)
The post-operative reaction time was reported in two [21][26][18,20] studies (Figure 7). The overall effect of the model does not show any difference between RA and GA, but the result is sensitive to the exclusion of a study by Jones 1990 [26][20], in which case the model favors GA over RA.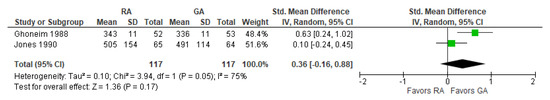
9. Controlled Oral Word Association Test
The preoperative and post-operative controlled oral word association test results were reported in two [17][18][24,26] studies (Figure 8). The model shows no difference between RA and GA, and the result is insensitive to the exclusion of either study. researchers should note that Tzimas et al., 2018 [17][24] reported results of the test conducted 30 days postoperatively, and Williams-Russo et al., 1995 [18][26] one week postoperatively.