Your browser does not fully support modern features. Please upgrade for a smoother experience.
Please note this is a comparison between Version 1 by Malak Abdullah Almarshad and Version 2 by Rita Xu.
Scoring polysomnography for obstructive sleep apnea diagnosis is a laborious, long, and costly process. Machine learning approaches, such as deep neural networks, can reduce scoring time and costs.
- artificial intelligence (AI)
- transformer neural networks
- deep learning (DL)
- oxygen saturation (SpO2)
1. Introduction
Obstructive sleep apnea (OSA) is a sleep disorder that occurs when the upper airway collapses during sleep, blocking airflow [1]. This can lead to repeated episodes of shallow or interrupted breathing. OSA is a common medical condition affecting an estimated one billion people worldwide [2]. The prevalence of OSA is particularly high in middle-aged and older adults, with some studies reporting a prevalence of up to 50% in these age groups [2]. Untreated OSA can have serious health consequences, including heart disease, stroke, diabetes, and impaired quality of life [2]. One reason for this is the delayed diagnosis and treatment due to the complex diagnostic procedures required to conduct and interpret sleep studies [3].
Polysomnography (PSG) is considered the gold-standard diagnostic test for OSA, where the patient undergoes neuro-muscular-cardio-respiratory monitoring in the sleep laboratory [4]. PSG can be a full-night diagnostic study followed by a full-night therapeutic study or split-night sleep study, where the first half is diagnostic and the second half is therapeutic. The American Academy of Sleep Medicine (AASM) guidelines for PSG performance recommend collecting the following signals: electroencephalogram (EEG), electrocardiogram (ECG), electromyography (EMG) for chin and legs, thermal sensors, nasal pressure-flow transducer, and photoplethysmography (PPG) [5][6][5,6]. PSG is expressed as epochs of raw data, where each epoch is 30 s (Figure 1). A record of 8 h translates to around 900 pages (epochs) [4].
Even though PSG is the ideal method for OSA diagnosis, there are some inherent constraints and shortcomings in PSG; for instance, a type-I sleep study requires admission to the sleep laboratory and a sleep technician attendance, and subsequently, a well-trained technician spends a lot of time scoring PSG manually from the start to the end. Moreover, each PSG record might be scored by multiple technicians. Sleep medicine physicians frequently rely on the manually scored reports provided by technicians to make their medical decisions, and this is compounded by the significant backlog of patients waiting for medical attention. Furthermore, readings given by sleep technicians for OSA events are also subject to inter-scorer variability among technologists [7]. These differences are likely due to diverse rules used to score events as well as differences in the technologist’s understanding of the rules [7]. The whole process is complicated and expensive, which could lead to delayed diagnosis and treatment for patients with OSA [7]. Considering the high prevalence and the serious consequences of OSA, much more effort is needed for accurate and early diagnosis [2].
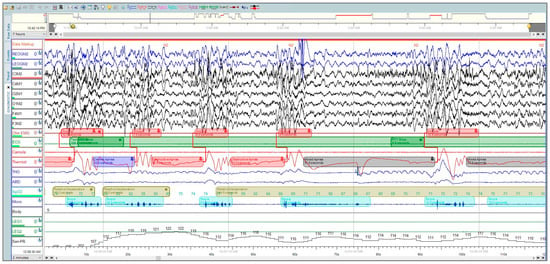
Figure 1. A polysomnographic recording from Sleepware G3 shows a two-minute window that was manually scored by a professional technician at the University Sleep Disorders Center at King Saud University Medical City (KSUMC).
Blood oxygen saturation (SpO2) stands for the saturation percentage of oxygen in hemoglobin. It is a measure of how much oxygen is bound to hemoglobin in the blood. SpO2 is typically measured using a pulse oximeter, which is a small, handheld device that clips onto a finger or earlobe [5]. The AASM recommends a fast sampling rate oximeter (shorter interval, e.g., 3 s or less) to improve sensitivity as patients with sleep-disordered breathing (SDB) usually have short-lasting intermittent hypoxemia, which can be missed if the sampling rate is too slow [8][9]. Smartwatches monitor SpO2 with a high level of accuracy [5][9][10][5,10,11]. Recently, certain advanced smartwatches and fitness trackers have been equipped with sleep-tracking features that can detect and indicate the potential presence of sleep apnea [9][10]. Patients suffering from OSA have intermittent oxygen desaturation that follows obstructive respiratory events. Desaturation during sleep studies is scored when there is a drop of SpO2 of 3% or 4% (depending on the used criteria) from the previous normal SpO2 [6]. Generally, the aim is always to keep oxygen saturation levels above 88%. All of this suggests that SpO2 monitoring using pulse oximetry or other wearable technology could be an effective and affordable tool for early OSA screening [5][11][5,12]. In addition, it encourages the development of machine learning (ML) and deep learning (DL) models that detect OSA utilizing SpO2 exclusively [12][13]. The use of SpO2 only for OSA screening has several benefits [13][14] Pulse oximetry is non-invasive, cost-effective, portable and convenient. This means that it does not require any electrodes or sensors to be placed on the body, and it does not cost as much as other methods, and can be used in home settings [14][15]. Theoretical research on the use of SpO2 only to automate OSA scoring has been limited. However, further investigation is needed to confirm these findings and determine the validity of using DL to classify OSA from SpO2.
Over the last 10 years, few PSG auto-scoring solutions have evolved. Among them, the only ready-to-use product is Somnolyzer from Philips [15][8]. Somnolyzer is proprietary software, which means that the algorithm behind it is not publicly available. This makes it difficult to assess the accuracy and reliability of the software [16]. Theoretically, multiple types of research have been conducted to automate OSA scoring. These include statistical analysis, signal processing, ML [12][13], and DL methods. A study in 2019 suggested that the DL approach for sleep event detection can reach expert human performance [17]. Furthermore, features in DL are learned during the training and not handcrafted by a human; this is a big advantage over other ML algorithms [18][19][18,19]. Deep learning models are trained by feeding them a large amount of data and adjusting the weights of the connections between the nodes until the model can make accurate predictions. The training process is typically performed using the backpropagation algorithm, which gradually adjusts the weights of the connections to minimize the error between the model’s predictions and the ground truth labels. Once a deep learning model is trained, it can be used to make predictions on new data [13][19][14,19].
2. Oximetry for Obstructive Sleep Apnea
Recent research has shown that DL can be used to detect sleep apnea using SpO2 only with an acceptable degree of accuracy [20]. For example, one study found that a DL model based on an ANN architecture was able to detect sleep apnea with an accuracy of 97.8% [21]. Generally, four main types of DL networks were widely used to detect OSA from SpO2 [20]. Earlier, a deep vanilla neural network (DNN) was used to learn simple patterns [22][23][22,23]. More recent work tends to use a convolutional neural network (CNN) to learn spatial features from sleep apnea data [11][24][25][26][27][12,24,25,26,27]. Lately, temporal patterns have been learned using recurrent neural networks (RNNs), long short-term memory (LSTM), or a hybrid architecture [28][29][28,29]. While few researchers prefer to build their own datasets from scratch, many prefer benchmark datasets. Two datasets have been used in the literature, namely St. Vincent’s University Hospital/University College Dublin Sleep Apnea (UCD database) [30] and the Childhood Adenotonsillectomy Trial (CHAT) dataset [31]. Some researchers have used only SpO2 to diagnose apnea using DL, while others have used other signals combined with SpO2, such as ECG, EEG, and respiratory effort, for more accurate diagnosis [21][27][28][21,27,28]. Previous attempts to automate the diagnosis of OSA from SpO2 have many shortcomings. Intensive filtering methods are applied to reduce the noise [28][29][28,29]. Furthermore, some of them heavily rely on data preprocessing and feature extraction [23][27][23,27]. Cen et al. [32] used only accuracy to measure the performance of an imbalanced dataset, which is not always a reliable metric. Table 1 provides a brief chronological order list of the approaches that make use of oximetry to detect OSA using DL.Table 1. Different approaches for apnea detection from SpO2 using DL, arranged by year of publication.
| Ref | Year | DL Model | Dataset | Window Size (Time) | #* Subjects | Accuracy % (Best) |
|---|---|---|---|---|---|---|
| Almazaydeh et al. [23] | 2012 | NN * | UCD database [30] | - | 7 | 93.3 |
| Morillo et al. [22] | 2013 | PNN * | Private dataset | 30 s | 115 | 84 |
| Mostafa et al. [26] | 2017 | Deep Belief NN with an autoencoder | UCD database [30] | 1 min | 8 and 25 | 85.26 |
| Pathinarupothi et al. [29] | 2017 | LSTM *-RNN | UCD database [30] | 1 min | 35 | 95.5 |
| Cen et al. [32] | 2018 | CNN * | UCD database [30] | 1 s | - | 79.61 |
| Mostafa et al. [33] | 2020 | CNN | Private dataset and UCD database [30] | 1, 3 and 5 min | - | 89.40 |
| John et al. [11][12] | 2021 | 1D CNN | UCD database [30] | 1 s | 25 | 89.75 |
| Vaquerizo-Villar et al. [25] | 2021 | CNN | CHAT dataset [31] and 2 private datasets | 20 min | 3196 | 83.9 |
| Piorecky et al. [27] | 2021 | CNN | Private dataset | 10 s | 175 | 84 |
| Bernardini et al. [28] | 2021 | LSTM | OSASUD [34] | 180 s | 30 | 63.3 |
| Li et al. [21] | 2021 | Artificial neural network (ANN) | Private dataset | - | 148 | 97.8 |