Your browser does not fully support modern features. Please upgrade for a smoother experience.
Please note this is a comparison between Version 2 by Camila Xu and Version 1 by Xi Zhao.
Cold-formed steel (CFS) members are manufactured at room temperature, offering benefits such as high strength, ease of transportation, and rapid erection and construction. The Digital Twin (DT)-based numerical simulation method is developed using the actual geometries of CFS shapes, which are acquired by a 3D laser scanner.
- digital twin-based numerical simulation
- cold-formed steel
- 3D laser scanner
1. Introduction
Cold-formed steel (CFS) members are manufactured at room temperature, offering benefits such as high strength, ease of transportation, and rapid erection and construction. However, the thin-walled characteristic of CFS members makes them sensitive to strength variations based on their geometries [1]. Although manufacturing tolerances are well controlled, transportation and storage can introduce additional geometric imperfections to the CFS members [2,3][2][3]. Consequently, predicting structural performance becomes more challenging due to random geometry deviations during numerical simulations. Traditional numerical simulations typically introduce an initial imperfection to the CFS models, with shapes based on the first buckling modes [4]. The magnitude of the imperfection is determined as L/960 by both Chinese [5] and North American standards [4]. However, modern structural design trends lean towards analysis-based or simulation-based approaches, wherein nonlinear structural performance is a crucial consideration [6,7][6][7]. Traditional numerical simulations fall short of meeting the demands of structural analysis, particularly for CFS members [8]. Accurate simulations for strength predictions must consider the real-world conditions of CFS members, such as their true geometry.
Measurement techniques are crucial for obtaining geometric information about CFS members. Over the past decades, measurements have evolved from contact-based to non-contact approaches [9,10][9][10]. Traditional contact measurements employ displacement sensors, calipers, and rulers to gauge geometric surface textures, cross-section dimensions, and specimen length. Consequently, the geometric imperfections incorporated into numerical simulations might not adequately represent the actual impacts of geometry on the strength of CFS members. On the other hand, non-contact measurements of CFS members predominantly utilize optical measurement techniques, such as laser-scanning triangulation (Figure 1) [10,11][10][11] and photography DIC techniques [12]. Such member-level measurements are more common in laboratories than in the industry. Limitations of these techniques include cost and efficiency. DIC techniques necessitate multiple high-resolution cameras and specialized software for measurements. Both research costs and device expenses can be prohibitive. Furthermore, the precision of these measurements might exceed the necessary qualifications [13]. Laser-based measurement seems more pragmatic, but challenges arise in reconstructing measurements and their application in structural analysis.
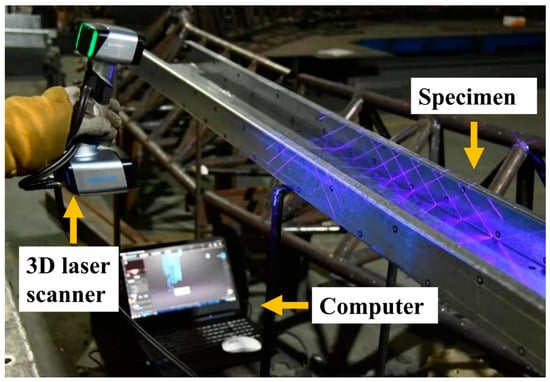
Figure 1.
Laser-scanning triangulation technique.
Reconstruction of laser measurements has advanced in recent years. While commercial software is not yet tailored for structural member applications, fundamental surface registration from scanned segments is achievable. Users can register scanned segments of items from various angles using geometric features or calibration markers [14,15][14][15]. Additionally, such software can only compute the area and dimensions of regions specified by users. The level of automation in image processing for measurements is not satisfactory, especially considering the unstructured data in structural applications. As a solution, Zhao et al. [11] proposed a post-processing algorithm that can automatically filter measurement noises and reorganize data for Zee-shaped section members. The post-processing algorithm processes data section by section. Section positions were determined through hardware records. A maximal curvature test was conducted on segments sequentially within a cross-section, identifying four maximum curvatures. These maximal curvatures were deemed the corners of the cross-section, while other segments represented flat regions such as webs, flanges, and lips. This method organized the data structure of the Zee-shaped sections for simpler structural and dimensional analysis. However, this approach was solely applied to Zee-shaped sections measured on a laboratory laser platform.
Feng et al. [10] and Xu [16] also introduced a post-processing method for measurements from a hand-held laser scanner, specifically RASNAC and geometric model reconstruction. Given that the targets are thick, hot-rolled steel sections, the resolution requirements for measurements are not as stringent as those for CFS members. Cross-sectional features are defined using several straight lines, enabling the intelligent identification of flanges and webs. Zhao [8] later proposed a new robust feature recognition method that fits other shapes of CFS members. The new robust feature recognition method is suitable for various shapes of CFS members. This method is globally optimized, ensuring more accurate feature recognition. The data structure is organized based on the geometric features of structural members, such as webs, flanges, lips, and corners. This geometric feature data structure can be utilized for various applications in the field, including identifying geometric imperfections [10,11,17][10][11][17] or detecting deformations [16]. The reorganized reconstructed models can be viewed as digital twins, where the organized point clouds accurately represent the genuine geometric conditions of the measured structural members [18,19][18][19].
2. Laser Measurements
An EinScan HX laser scanner is utilized in the research, as shown in Figure 2a. The EinScan HX scanner features a camera and a detector, utilizing triangulation measurement technology for swift positioning and data capture. The scanner gathers optical data and transmits it to a computer via transmission wires. Accompanying the laser scanner is the EXScan HX software, used for real-time reconstruction of the measurements. The recommended scanning distance ranges between 370 mm and 570 mm, with a measurement accuracy reaching up to 0.04 mm.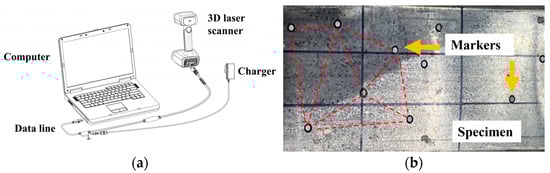
Figure 2.
Laser scanner and scanning specimen: (
a
) EinScan HX laser scanner; (
b
) Markers’ arrangement by triangulation.
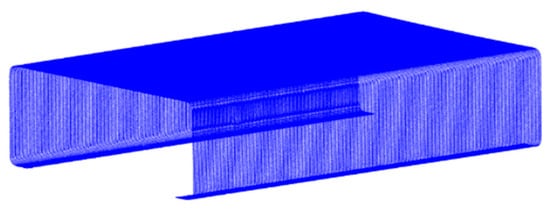
Figure 3.
Scanning result of the CFS Cee specimen.
3. Post-Processing
The pre-processed point clouds of CFS members are unsuitable for direct application in structural analysis. The data structures of these reconstructed point cloud data (PCd) models are imperfect, characterized by disordered points and undefined geometric features. As a result, direct identification of dimensions and surface textures becomes challenging. This necessitates the use of a post-processing algorithm for the pre-processed PCd models. The post-processing involves three primary steps: layering, sorting, and feature recognition. Scanned members inherently possess inner and outer surface layers, as depicted in Figure 4. However, the inner layer of a CFS member is challenging to scan comprehensively due to shaded reflections from the laser scanners. The thin-walled nature of CFS members allows the assumption that the inner and outer layers resemble each other. Consequently, the incomplete inner layer of the PCd models can be removed, leaving only the outer layer points. This process is carried out using Geomagic Wrap 2021 software [15].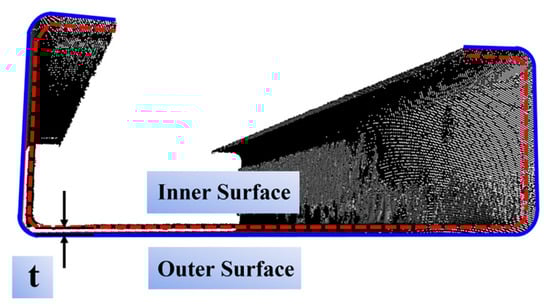
Figure 4.
Inner and outer layers of the PCd.
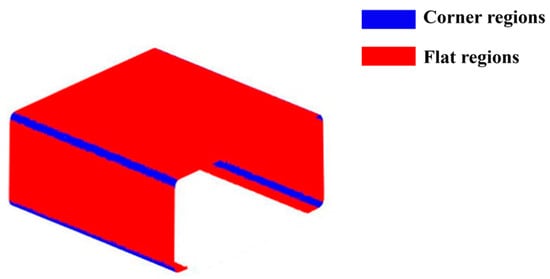
Figure 5.
Cross Sections feature recognition.
References
- Lechner, B.; Pircher, M. Analysis of imperfection measurements of structural members. Thin-Walled Struct. 2005, 43, 351–374.
- Amouzegar, H.; Amirzadeh, B.; Zhao, X.; Schafer, B.; Tootkaboni, M. Statistical analysis of the impact of imperfection modes on collapse behavior of cold-formed steel members. In Proceedings of the Structural stability Research Council Annual Sta, Nashville, TN, USA, 24–27 March 2015.
- Farzanian, S.; Louhghalam, A.; Schafer, B.; Tootkaboni, M. Geometric imperfection models for CFS structural members, Part I: Comparative review of current models. Thin-Walled Struct. 2019.
- AISI S240-15; North American Standard for Cold Formed Steel Structural Framing. American Iron and Steel Institute: Washington, DC, USA, 2015.
- G. 50017-2017; Steel Structure Design Standard. China Construction Industry Press Beijing: Beijing, China, 2017.
- Zhao, X. Measurement and Application of Geometric Imperfections in Cold-Formed Steel Members. Ph.D. Thesis, Johns Hopkins University, Baltimore, MD, USA, 2016.
- Ahmed, H.; Ghosh, S.; Mangal, M. Probabilistic estimation of the buckling strength of a CFS lipped-channel section with Type 1 imperfection. Thin-Walled Struct. 2017, 119, 447–456.
- Zhao, X.; Wang, G.; Sun, X.; Wang, X.; Schafer, B. Modeling of uncertain geometry of cold formed steel members based on laser measurements and machine learning. Eng. Struct. 2023, 115578, 279.
- Schafer, B.; Pekoz, T. Computational modeling of cold-formed steel: Characterizing geometric imperfections and residual stresses. J. Constr. Steel Res. 1998, 47, 193–210.
- Feng, P.; Zou, Y.; Hu, L.; Liu, T. Use of 3D laser scanning on evaluating reduction of initial geometric imperfection of steel column with pre-stressed CFRP. Eng. Struct. 2019, 198, 109527.
- Zhao, X.; Tootkaboni, M.; Schafer, B. Laser-based cross-section measurement of cold-formed steel members: Model reconstruction and application. Thin-Walled Struct. 2017, 120, 70–80.
- Sun, Z.; Zheng, Y.; Sun, Y.; Shao, X.; Wu, G. Deformation ability of precast concrete columns reinforced with steel-FRP composite bars (SFCBs) based on the DIC method. J. Build. Eng. 2023, 68, 106083.
- Mai, B.; Pham, C.; Hancock, G.; Nguyen, G. Block shear strength and behaviour of cold-reduced G450 steel bolted connections using DIC. J. Constr. Steel Res. 2019, 157, 151–160.
- Keyence. High-Speed 2D/3D Laser Scanner LJ-V7000 Specification. Available online: http://www1.keyence.com/topics/measure/ljv/ljv7000/ljv7000.php?ad=gapress1212prljv (accessed on 16 August 2023).
- Geomagic, Version 2013.0.2 ; Geomagic, Inc. and 3Dsystems. Inc.: Hangzhou, China, 2013.
- Xu, Y.; Zhang, M.; Yang, S.; Zheng, B. Measurement and qualification of welded I-column failure mode using laser scanning technique. In Structures; Elsevier: Amsterdam, The Netherlands, 2021; Volume 34, pp. 2694–2707.
- Zhao, X.; Tootkaboni, M.; Schafer, B. Development of a laser-based geometric imperfection measurement platform with application to cold-formed steel construction. Exp. Mech. 2015, 55, 1779–1790.
- Grieves, M. Digital twin: Manufacturing excellence through virtual factory replication. White Pap. 2014, 1, 1–7.
- Zhang, H.; Liu, Q.; Chen, X.; Zhang, D.; Leng, J. A digital twin-based approach for designing and multi-objective optimization of hollow glass production line. IEEE Access 2017, 5, 26901–26911.
More