Intelligent agriculture imposes higher requirements on the recognition and localization of fruit and vegetable picking robots. Due to its unique visual information and relatively low hardware cost, machine vision is widely applied in the recognition and localization of fruit and vegetable picking robots. Visual sensors are used to acquire image information and the three-dimensional positioning of targets. Machine vision algorithms are used for target recognition. Common algorithms include image segmentation, object detection, and three-dimensional reconstruction. Image segmentation algorithms can segment target objects in complex scenes, object detection algorithms can timely detect target objects and other interferences in images, while three-dimensional reconstruction algorithms can convert the two-dimensional image information obtained by the camera into three-dimensional spatial information of the target.
- machine vision
- fruit and vegetable harvesting robots
- image recognition
- visual localization
1. Visual Sensors
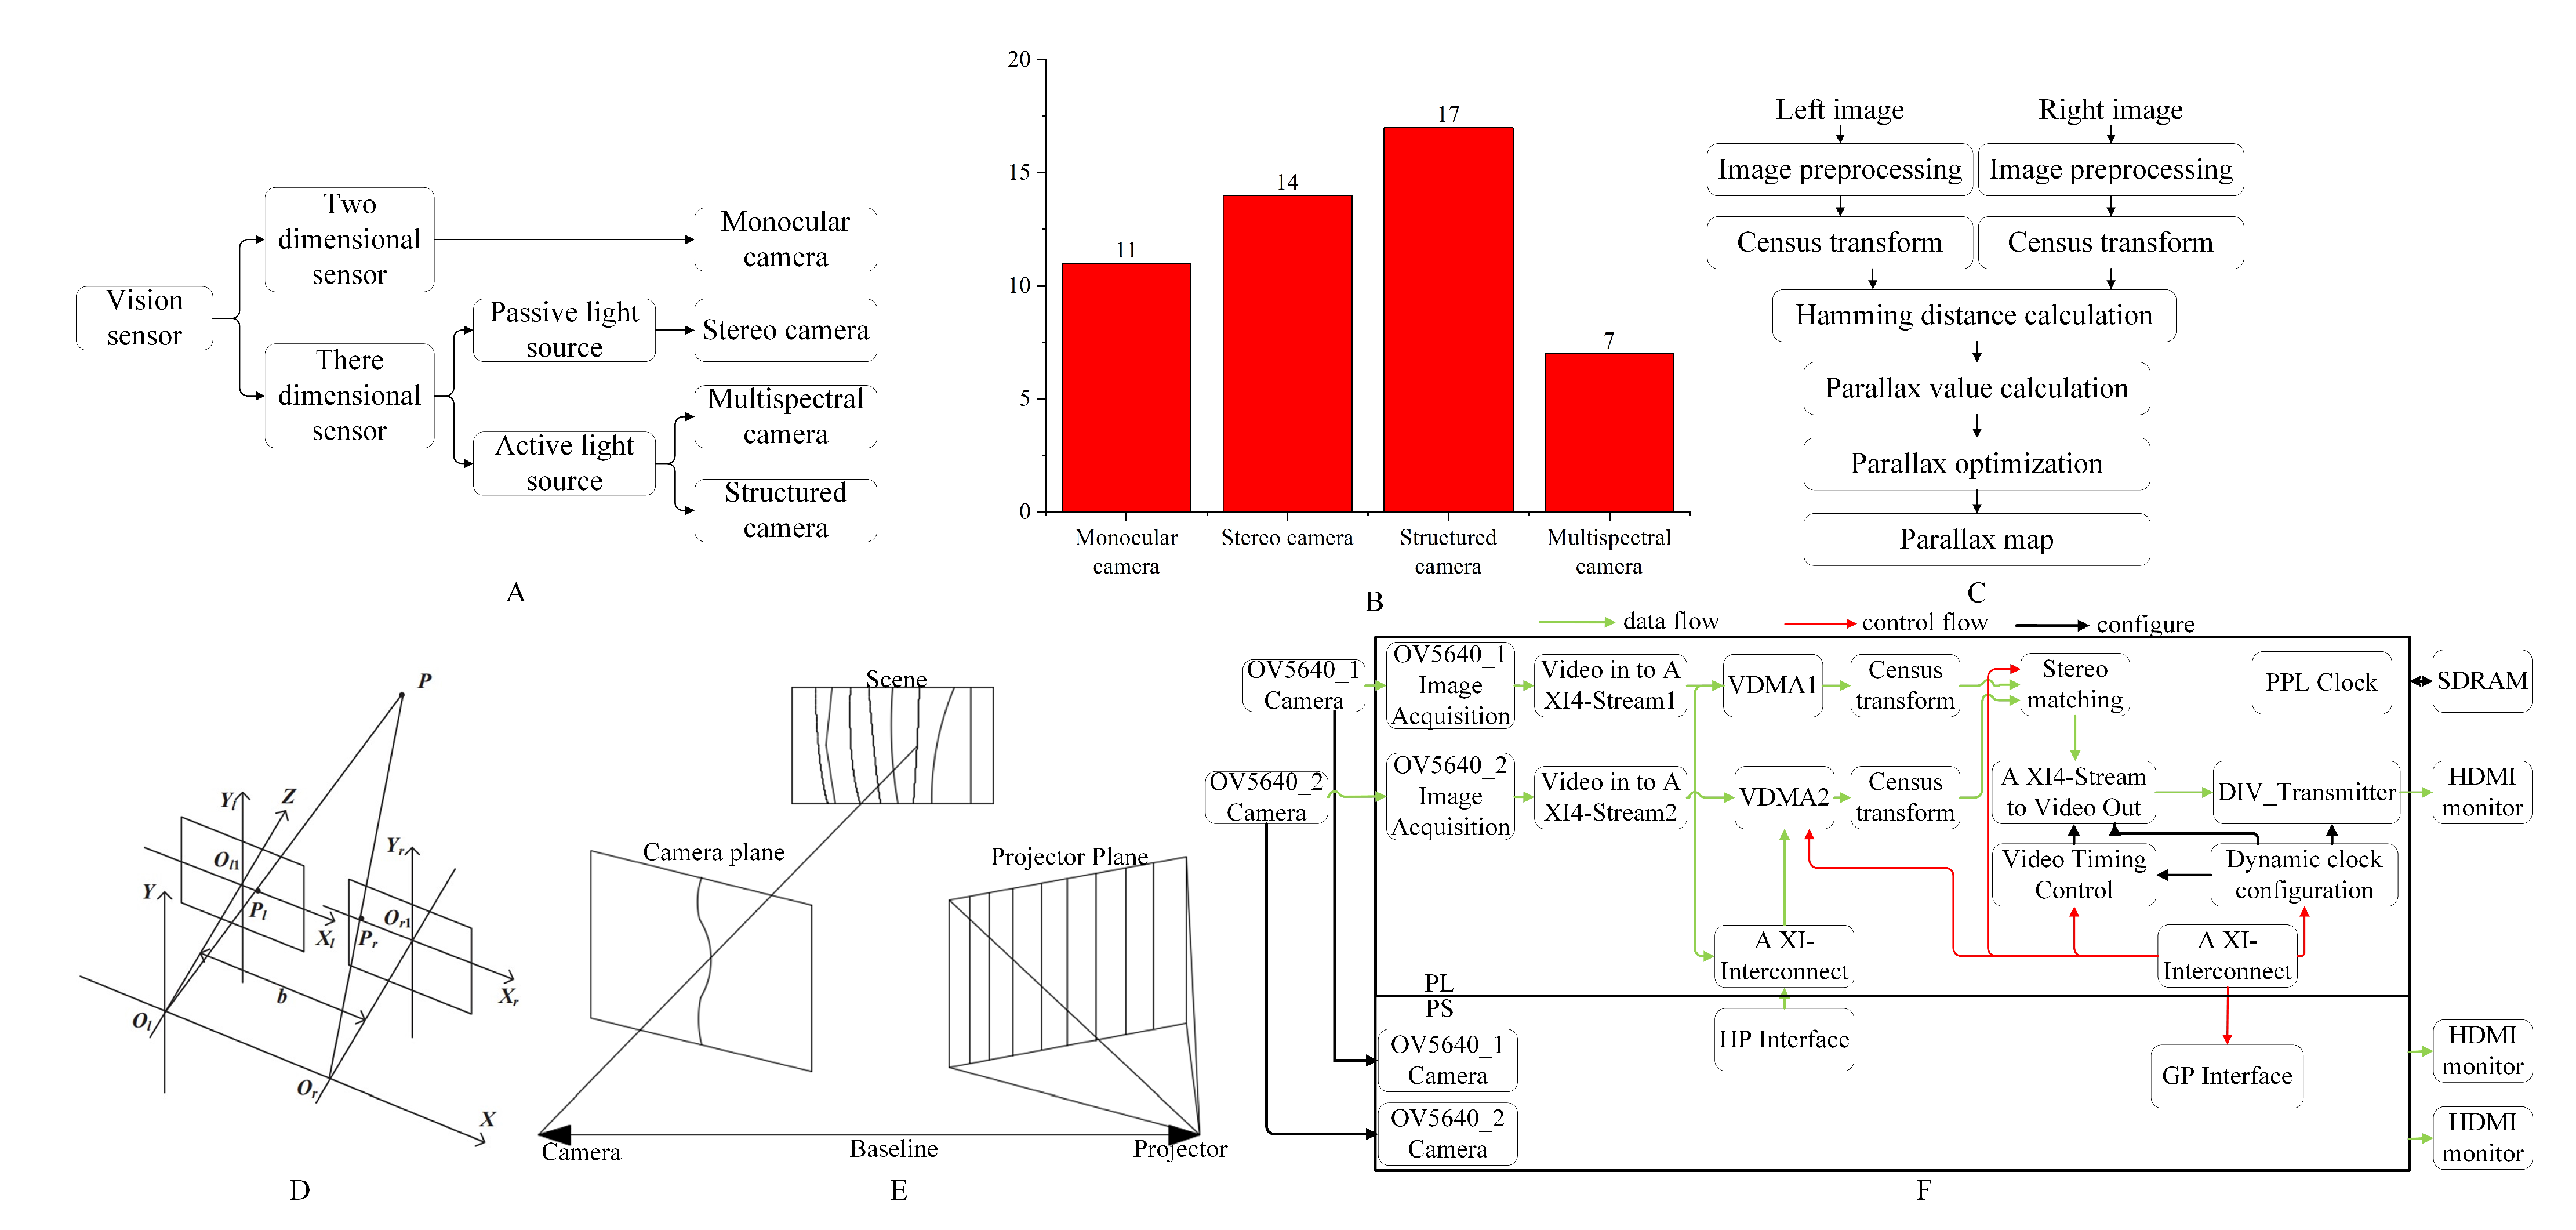
1.1. Monocular Camera
| Types of Sensors | Applications and Principles | Advantages | Disadvantages | Images |
|---|---|---|---|---|
| Monocular camera | Color, shape, texture, and other features | Simple system structure, low cost, can be combined with multiple monocular systems to form a multi-camera system | It can only capture two-dimensional image information, has poor stability, and cannot be used in dark or low-light conditions [25][10] |  |
| Stereo camera | Texture, color, and other features; obtaining the spatial coordinates of the target through the principle of triangulation imaging | By combining algorithms, the matching efficiency can be improved, and three-dimensional coordinate information can be obtained | It requires high sensor calibration accuracy, and the stereo matching computation takes a long time. It is also challenging to determine the three-dimensional position of edge points |  |
| Structured camera | Obtaining three-dimensional features through the reflection of structured light by the object being measured | The three-dimensional features are not easily affected by background interference and have better positioning accuracy | Sunlight can cancel out most of the infrared images, and the cost is high |  |
| Multispectral camera | Identifying targets based on the differences in radiation characteristics of different wavelength bands | It is not easily affected by environmental interference | It requires heavy computational processing, making it unsuitable for real-time picking operations |  |
1.2. Stereo Camera
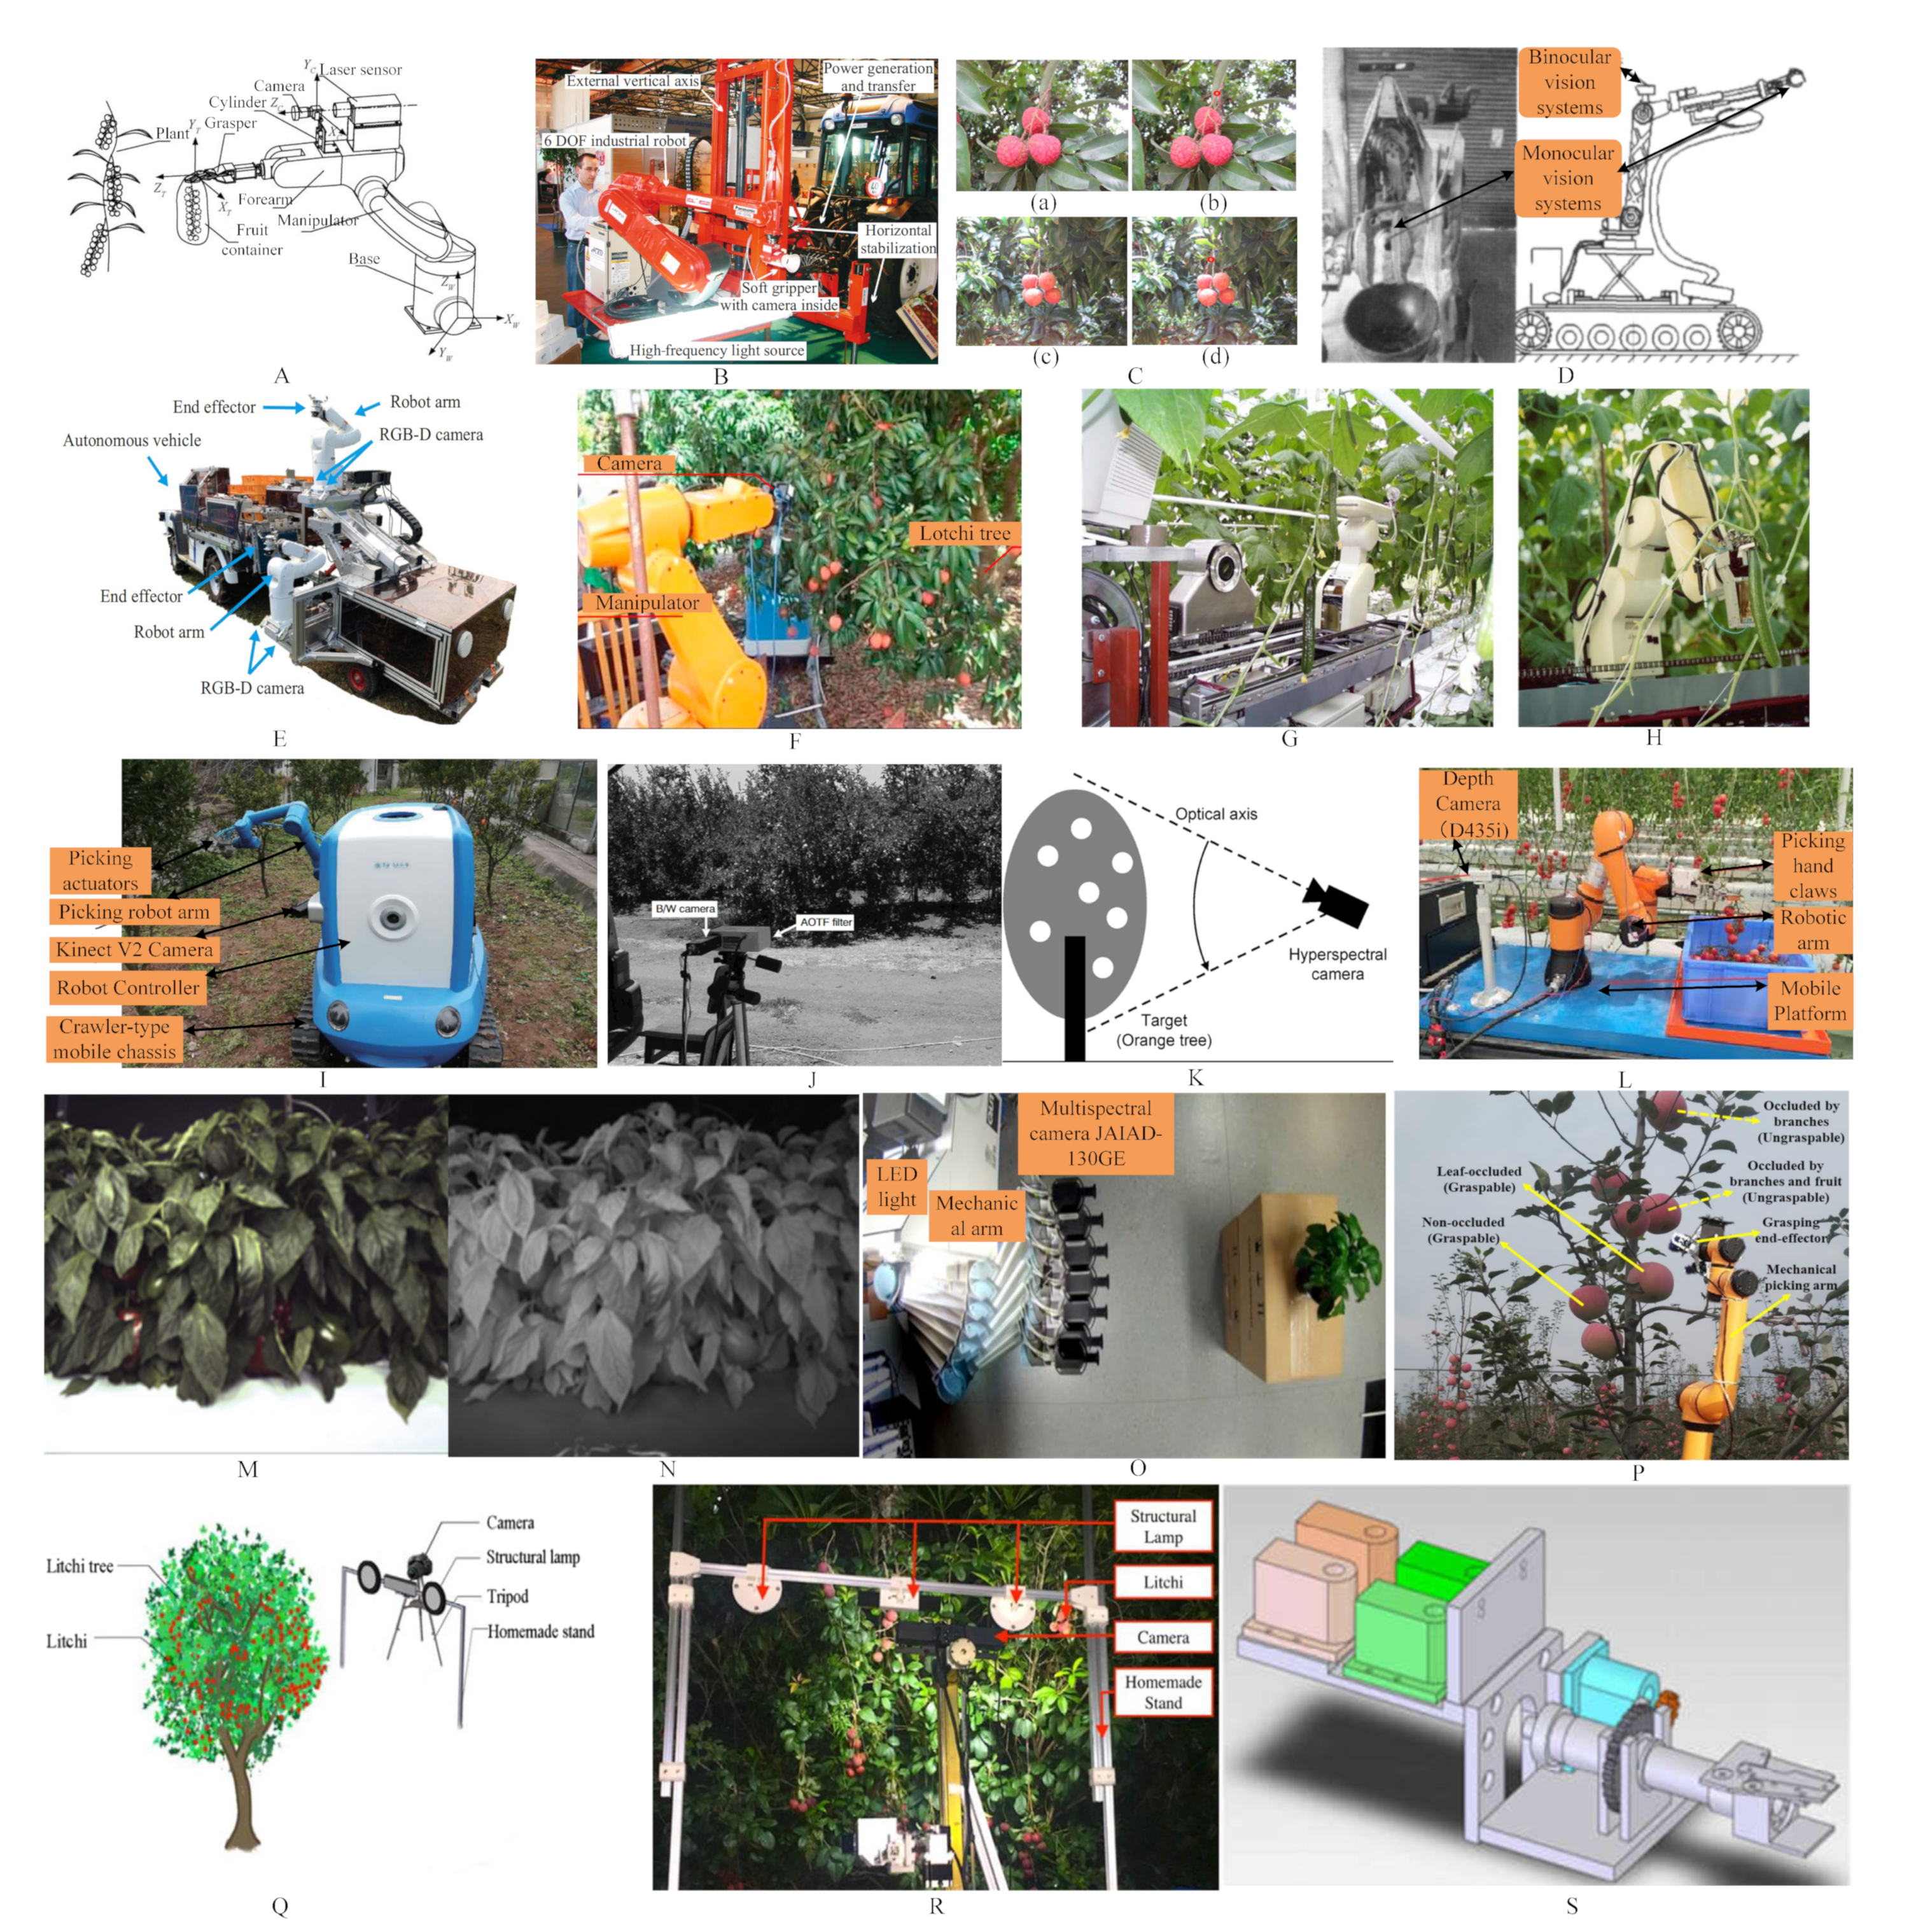
1.3. Structured Camera
1.4. Multispectral Camera
2. Machine Vision Algorithms
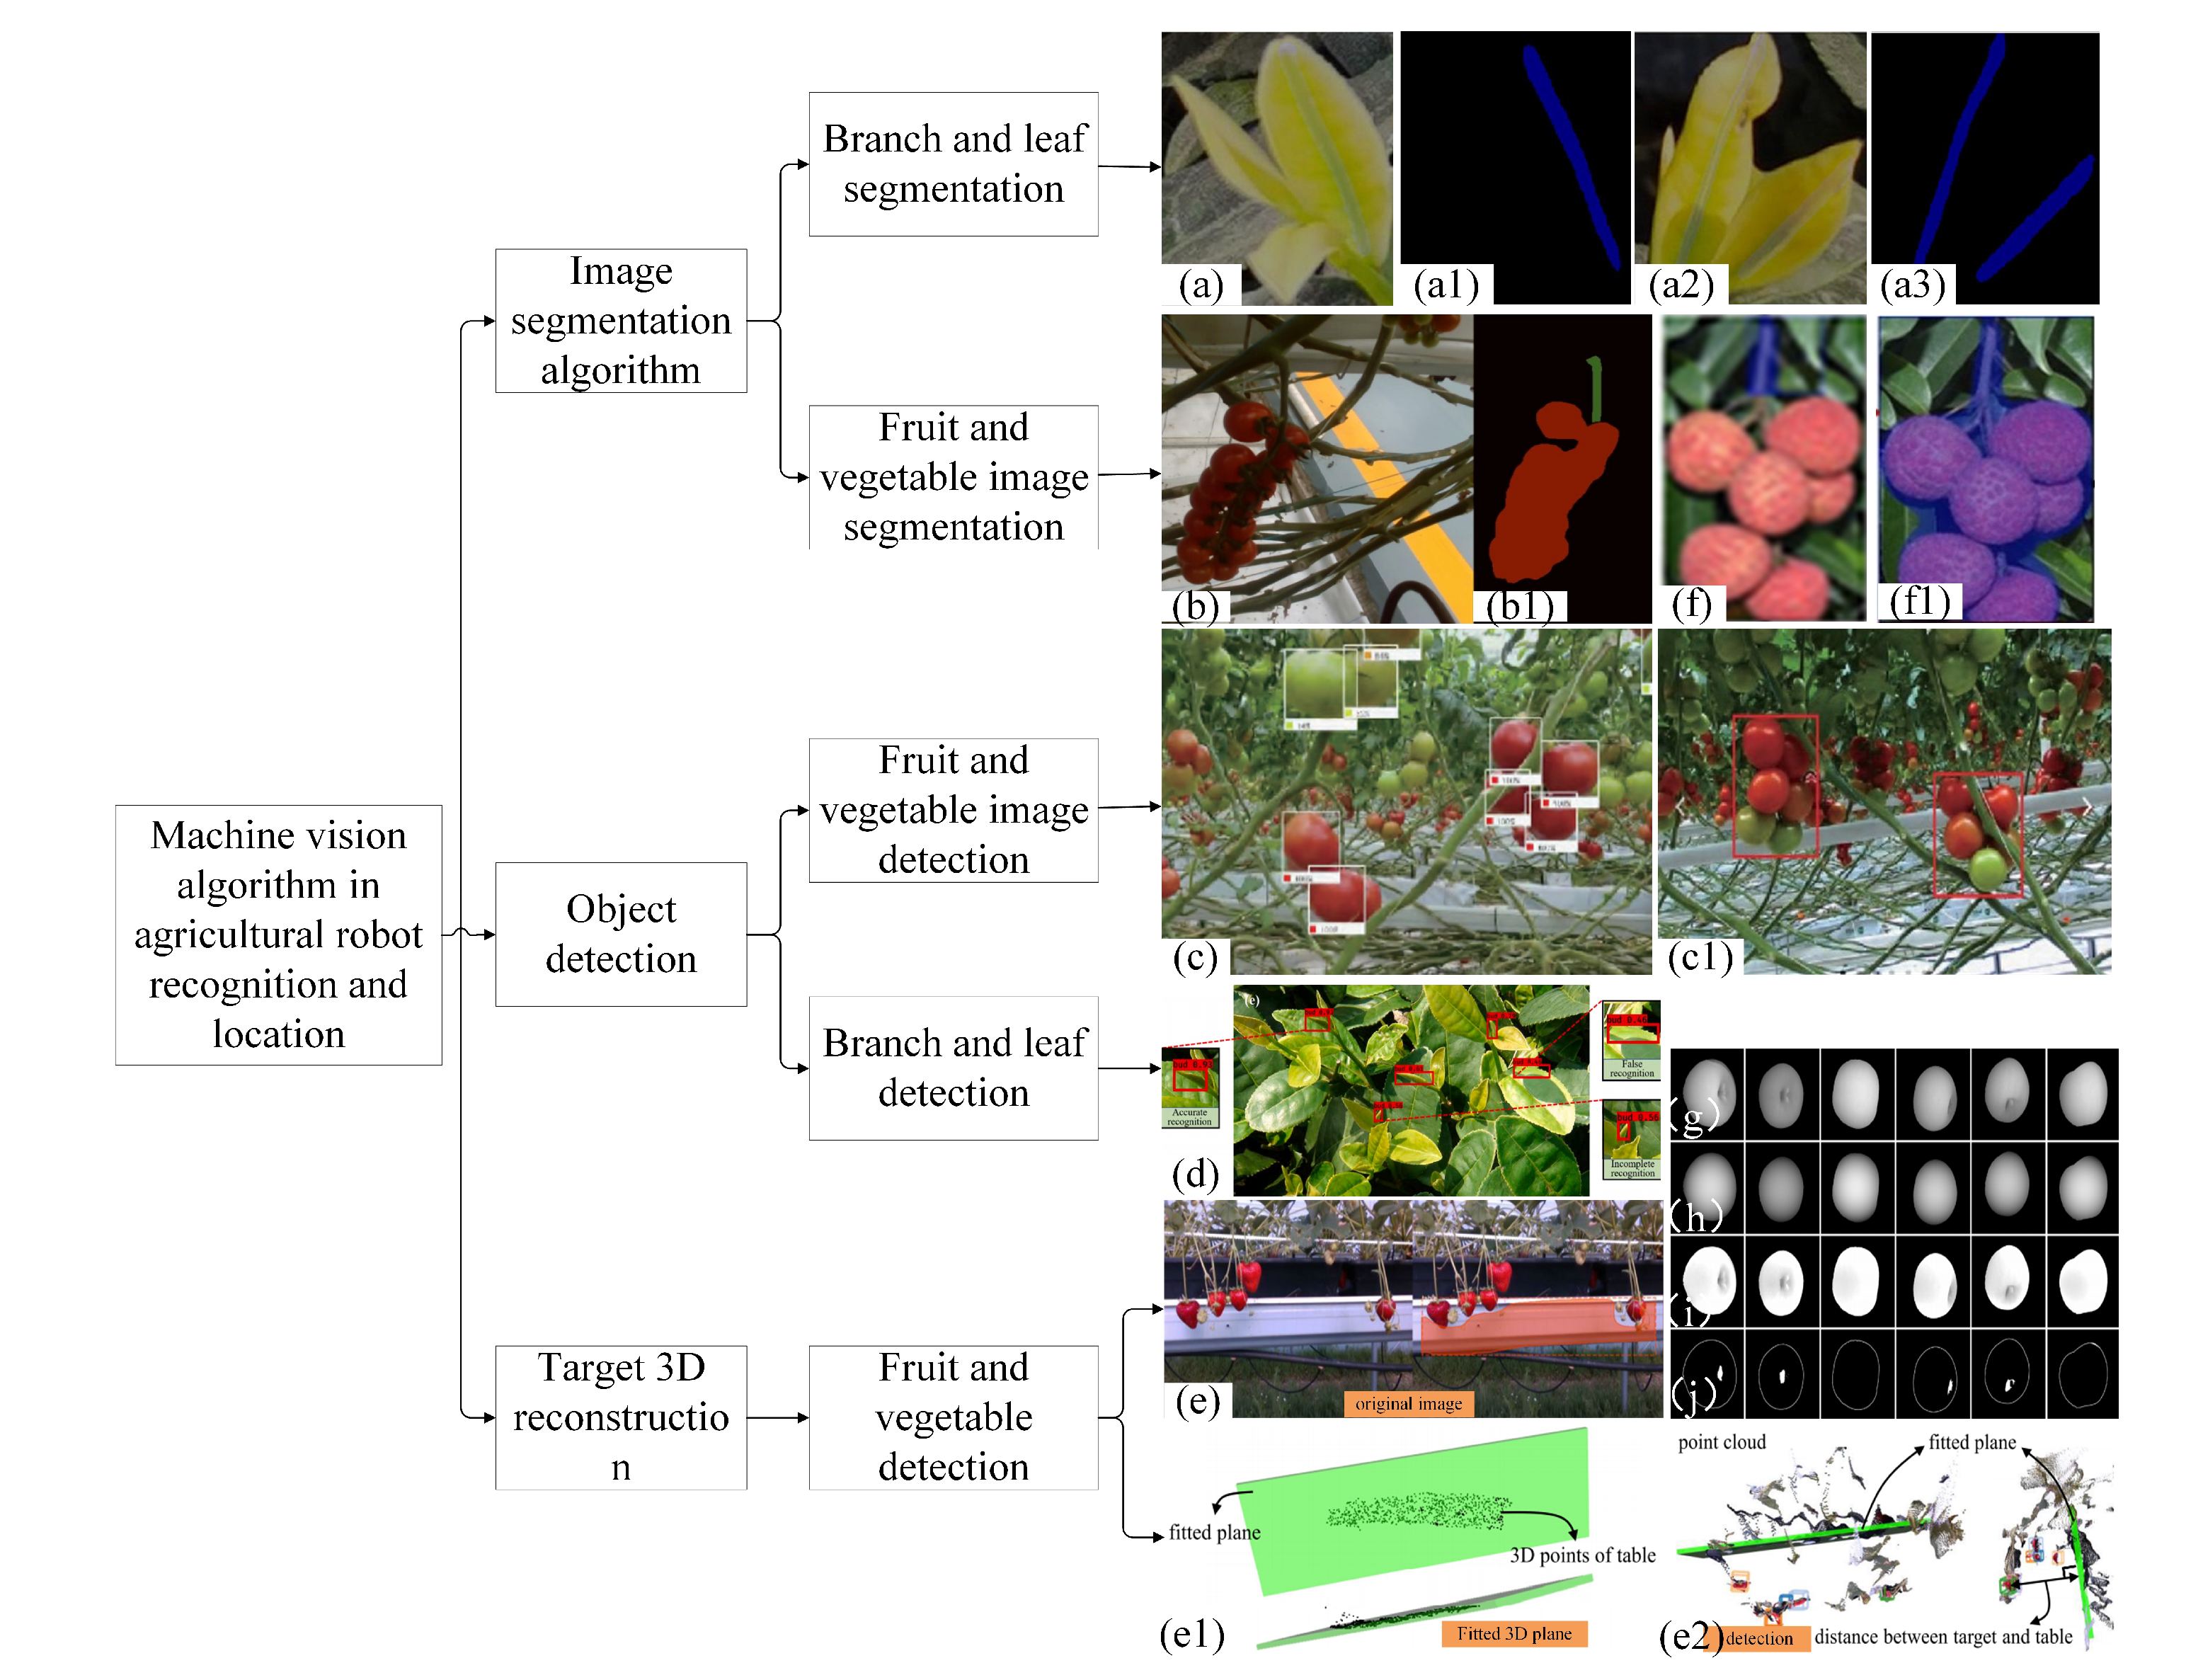
2.1. Image Segmentation Algorithms
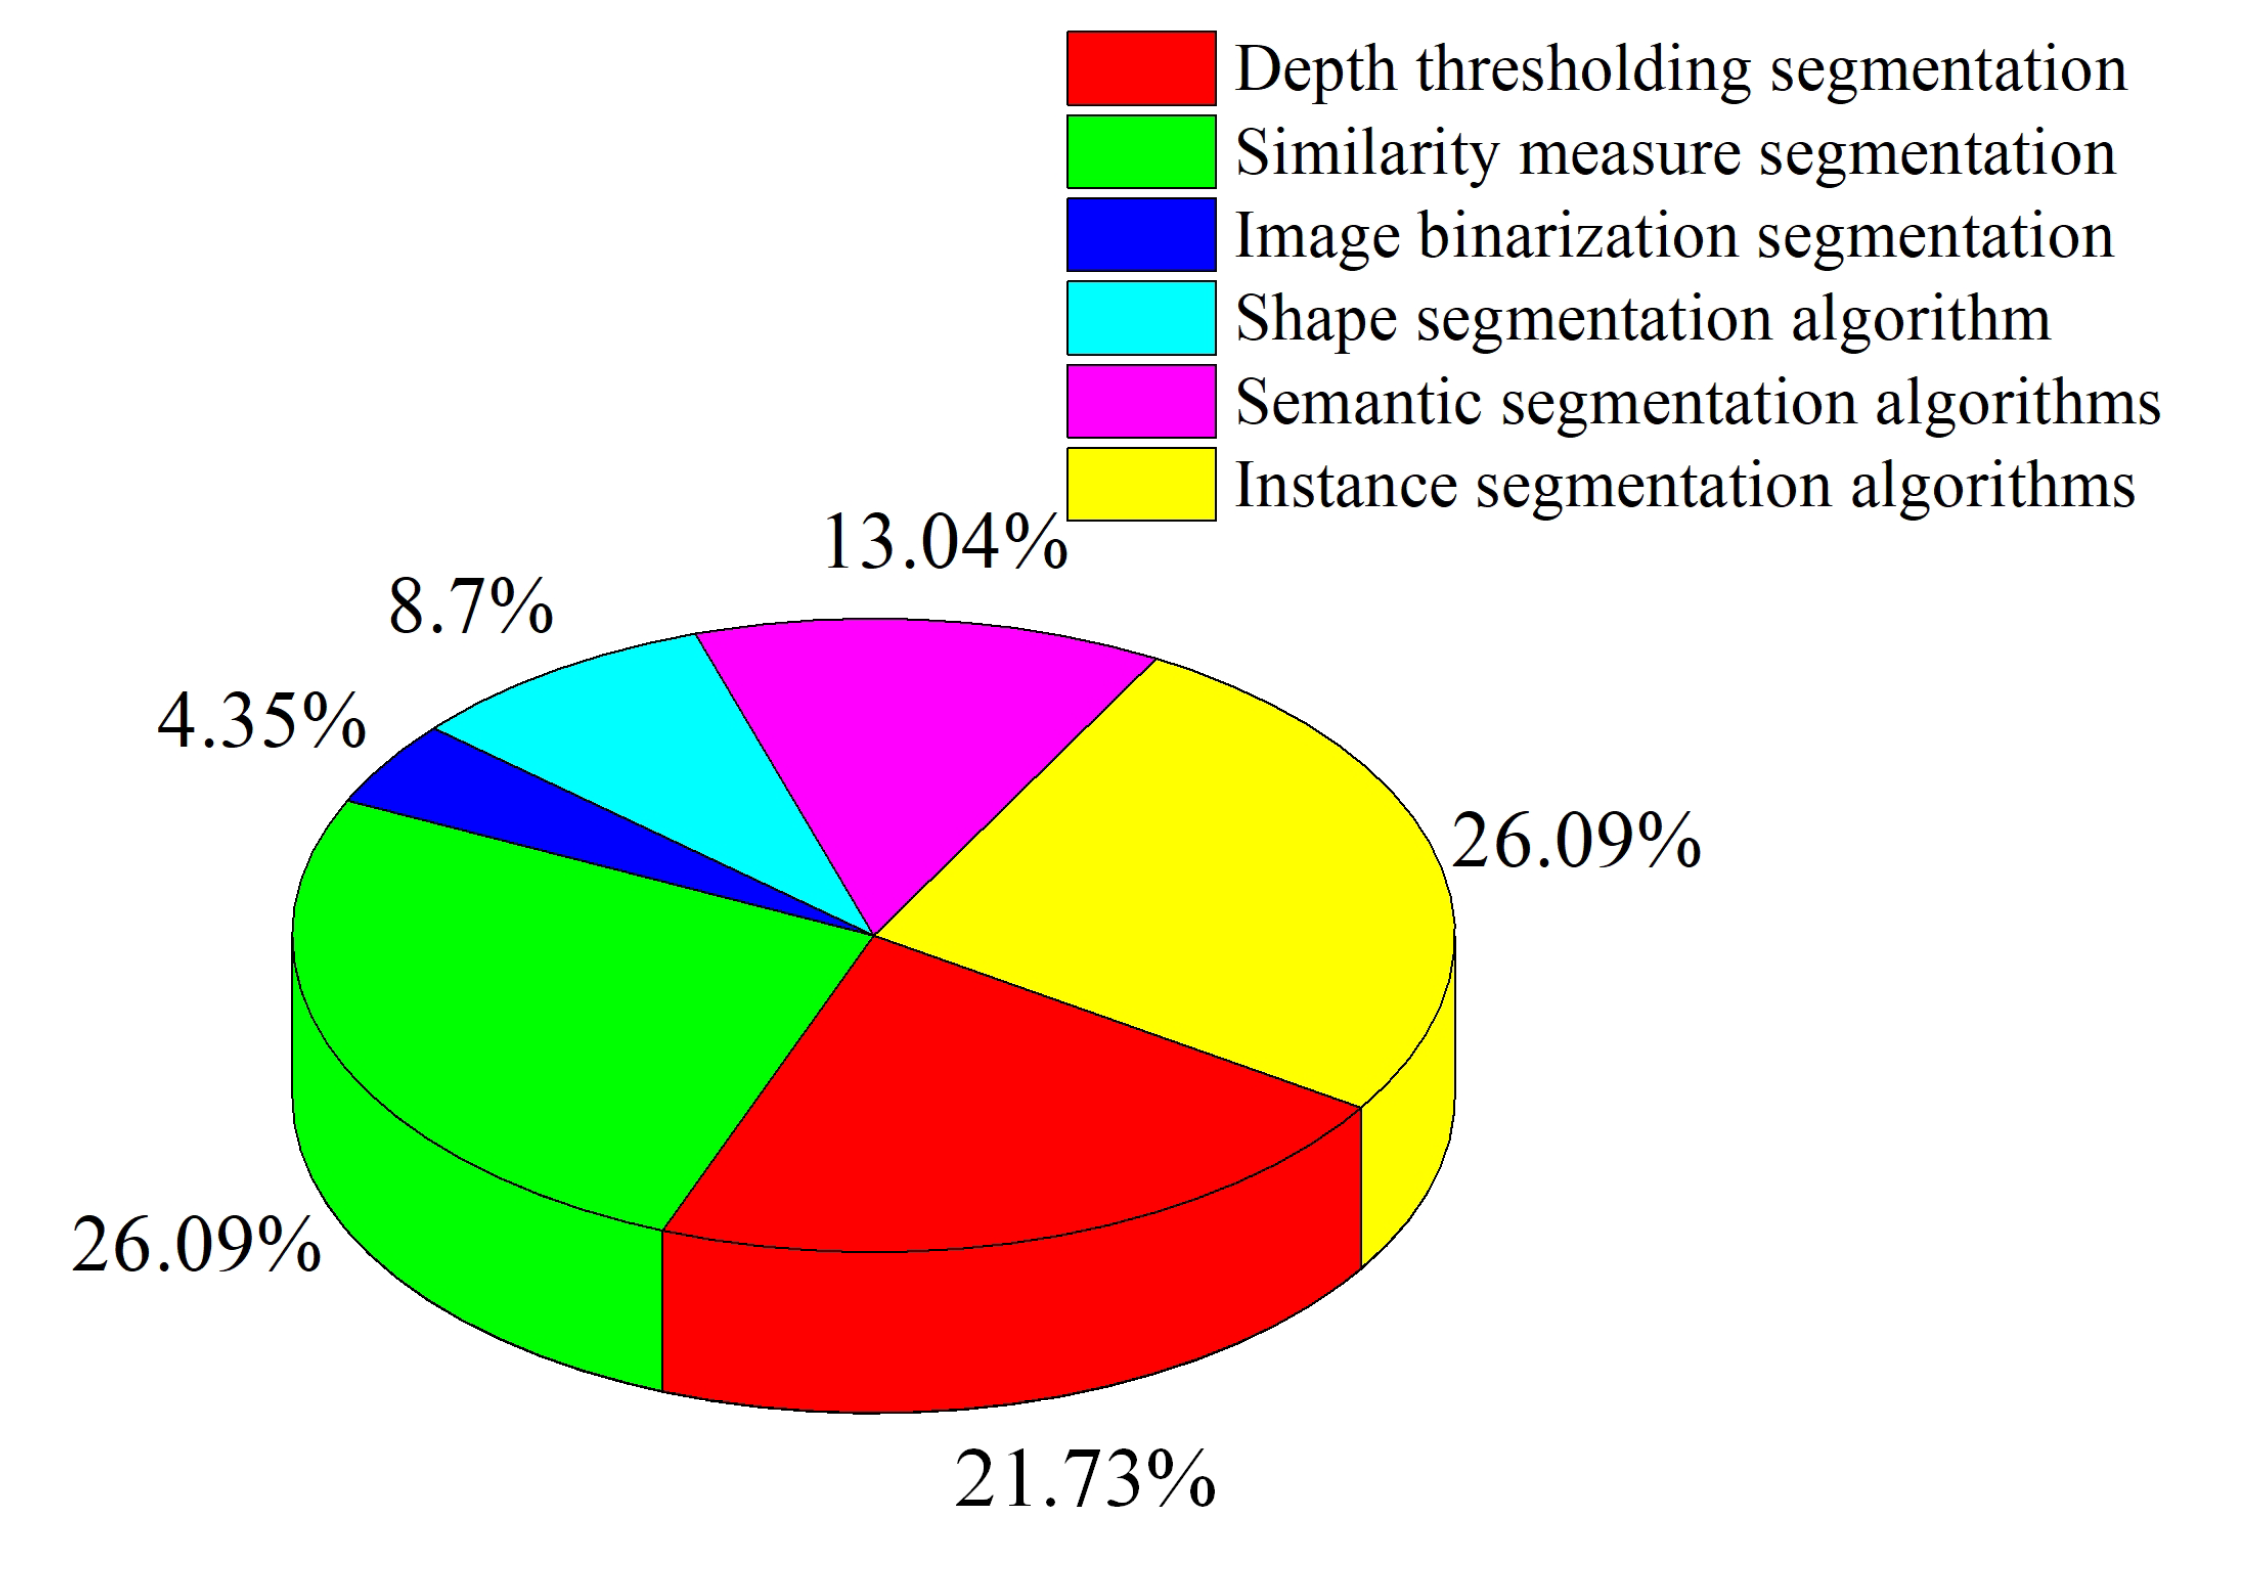
| Algorithms | Image Segmentation Algorithms | Module | Cite References | Object | Detection Time | Detection Accuracy |
|---|---|---|---|---|---|---|
| Specific Methods | Cite References | Object | Detection Time | |||
| Traditional segmentation | Depth thresholding segmentation | HSV thresholding | [71,72,73][61][62][63] [74,75][64][65] |
Tomato, orange | 2.34 s | 83.5–93% |
| Similarity measure segmentation | NCC,K-means | [46,66,76][32][54][66] [33,77,78][19][67][68] |
Tomato, orange, lychee, cucumber | 0.054–7.58 s | 85–98% | |
| Image binarization segmentation | Otsu | [79][69] | Grape | 0.61 s | 90% | |
| Shape segmentation algorithm | Hough circle transform | [75,80][65][70] | Banana, apple | 0.009–0.13 s | 93.2% | |
| Machine learning | Semantic segmentation algorithms | PSP-Net semantic segmentation, U-Net semantic segmentation | [81,82][71][72] | Lychee, cucumber | - | 92.5–98% |
| Instance segmentation algorithms | Mask R-CNN and YOLACT | [7,83,84][55][73][74] [69,85,86][59][75][76] |
Tomato, strawberry, lychee | 0.04–0.154 s | 89.7–95.78% |
2.2. Object Detection Algorithm
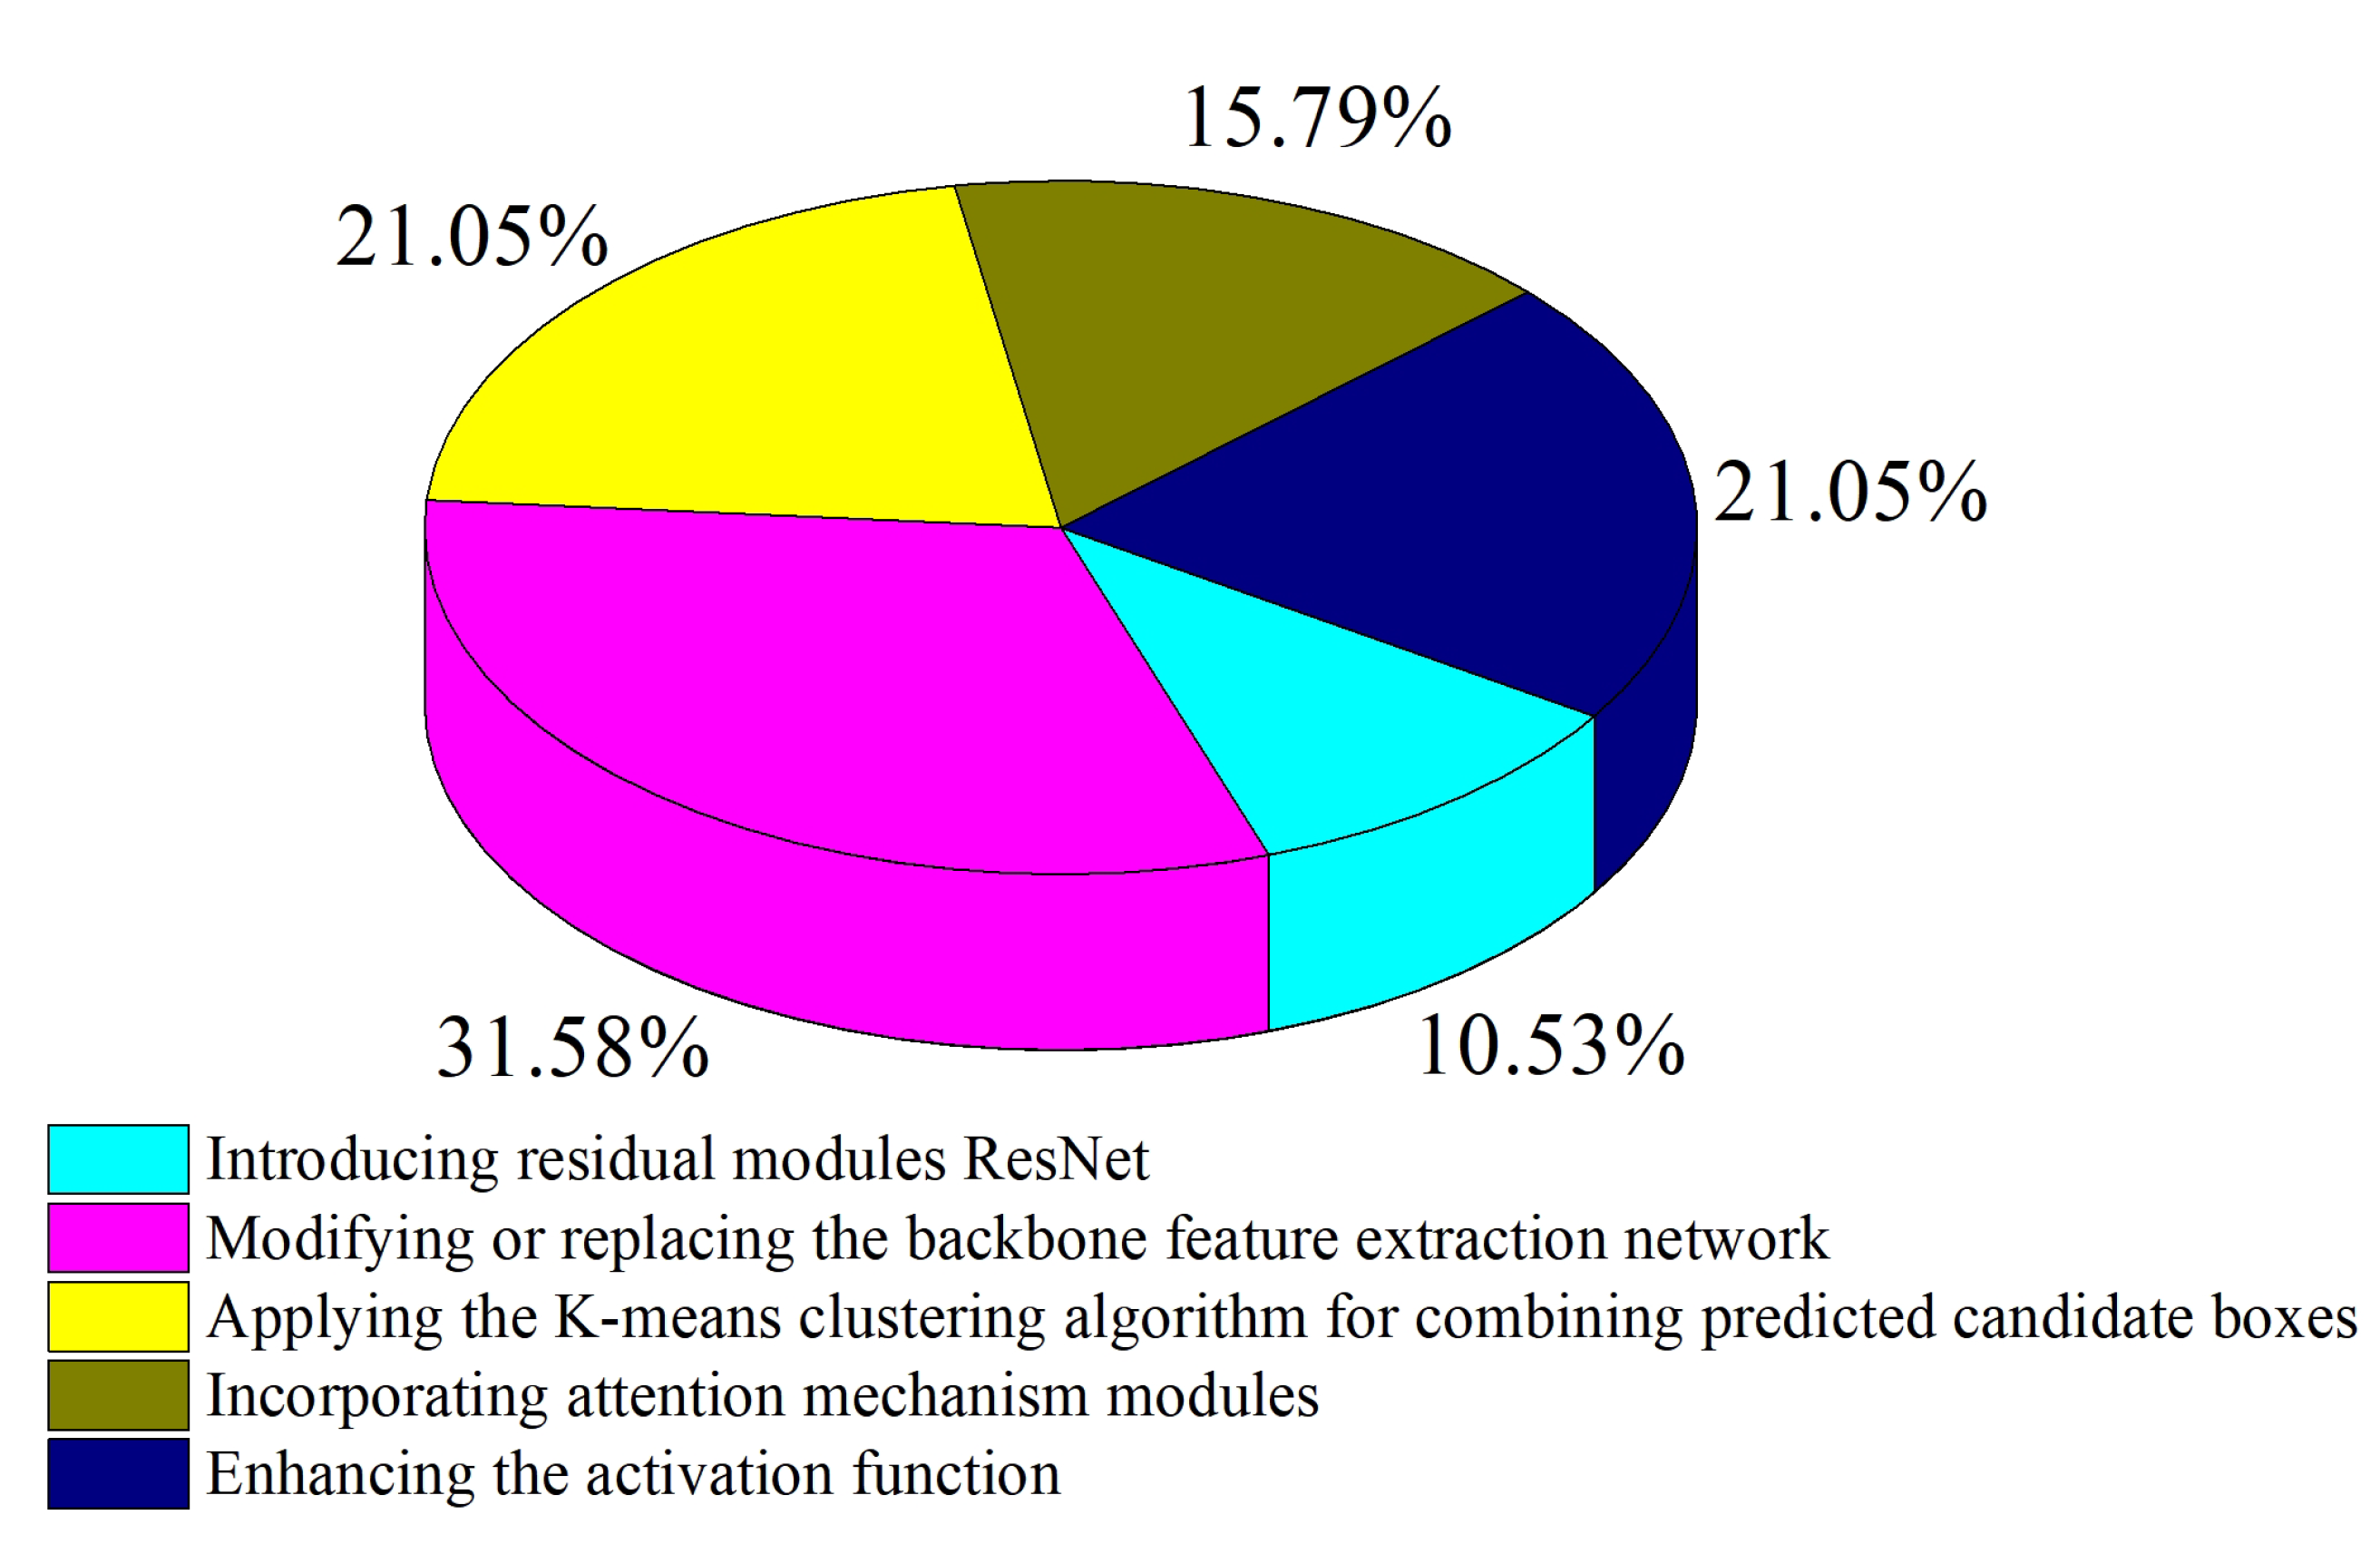
| Detection Accuracy | |
|---|---|
| Introducing residual modules ResNet | [67 |
2.3. A 3D Reconstruction Algorithm for Object Models
| Specific Methods | Cite References | Object | Rebuilding Accuracy | |||||
|---|---|---|---|---|---|---|---|---|
| Density-based point clustering and localization approximation method | ,87][56][ | [9][58]77] | Tomato, lychee | Strawberry0.017–0.093 s | 94.44–97.07% | |||
| 74.1% | Modifying or replacing the backbone feature extraction network | [8,68,88,89,90,91][57][78][79][80][81][82] | ||||||
| Nearest point iteration algorithm | [99] | Citrus, tea tooth, cherry, apple, green peach |
0.01–0.063 s | [86.57–97.8% | ||||
| 90 | Applying the K-means clustering algorithm for combining predicted candidate boxes | [43,92,93,94][29][83][84][85] | Tomato, citrus, lychee, cherry tomato | 0.058 s | 79–94.29% | |||
| ] | Apple | 85.49% | ||||||
| Delaunay triangulation method | [70][60] | Apple | 97.5% | Incorporating attention mechanism modules | [91,92,95][82][83][86] | Apple, tomato | 0.015–0.227 s | 86.57–97.5% |
| Three-dimensional reconstruction algorithm based on iterative closest point (ICP) | [100][91 | Enhancing the activation function | [89,91,96,97][80][82][87][88] | Apple, tomato, lychee, navel orange, Emperor orange |
0.467 s | 94.7% |
| ] |
| Apples, bananas, cabbage, pears |
| - |
References
- Luo, G. Depth Perception and 3D Reconstruction Based on Binocular Stereo Vision. Ph.D. Thesis, Central South University, Changsha, China, 2012; pp. 6–15.
- Anwar, I.; Lee, S. High performance stand-alone structured light 3D camera for smart manipulators. In Proceedings of the 2017 14th International Conference on Ubiquitous Robots and Ambient Intelligence (URAI), Jeju, Republic of Korea, 28 June–1 July 2017; pp. 192–195.
- Jiang, P.; Luo, L.; Zhang, B. Research on Target Localization and Recognition Based on Binocular Vision and Deep Learning with FPGA. J. Phys. Conf. Ser. 2022, 2284, 12009.
- Ruan, S.J.; Chen, J.H. Title of presentation. In Proceedings of the 2022 IEEE 4th Global Conference on Life Sciences and Technologies, Osaka, Japan, 7–9 March 2022; pp. 431–432.
- Feng, Q.C.; Zou, W.; Fan, P.F.; Zhang, C.F.; Wang, X. Design and Test of Robotic Harvesting System for Cherry Tomato. Int. J. Agric. Biol. Eng. 2018, 11, 96–100.
- Baeten, J.; Kevin, D.; Sven, B.; Wim, B.; Eric, C. Autonomous Fruit Picking Machine: A Robotic Apple Harvester. Field Serv. Robot. 2008, 42, 531–539.
- Bulanon, D.M.; Kataoka, T.; Ota, Y.A. Machine Vision System for the Apple Harvesting Robot. Agric. Eng. Int. Cigr. Ejournal 2001, 3, 1–11.
- Zhao, J.; Tow, J.; Katupitiya, J. On-tree Fruit Recognition Using Texture Properties and Color Data. In Proceedings of the 2005 IEEE/RSJ International Conference on Intelligent Robots and Systems, Edmonton, AB, Canada, 2–6 August 2005; pp. 263–268.
- Mehta, S.S.; Burks, T.F. Vision-based Control of Robotic Manipulator for Citrus Harvesting. Comput. Electron. Agric. 2014, 102, 146–158.
- Meng, L.; Yuan, L.; Qing, L.W. A Calibration Method for Mobile Omnidirectional Vision Based on Structured Light. IEEE Sens. J. 2021, 21, 11451–11460.
- Cao, K.; Liu, R.; Wang, Z.; Peng, K.; Zhang, J.; Zheng, J.; Teng, Z.; Yang, K.; Stiefelhagen, R. Tightly-coupled liDAR-visual SLAM based on geometric features for mobile agents. arXiv 2023, arXiv:2307.07763.
- Shu, C.F.; Luo, Y.T. Multi-modal feature constraint based tightly coupled monocular Visual-liDAR odometry and mapping. IEEE Trans. Intell. Veh. 2023, 8, 3384–3393.
- Zhang, L.; Yu, X.; Adu-Gyamfi, Y.; Sun, C. Spatio-temporal fusion of LiDAR and camera data for omnidirectional depth perception. Transp. Res. Rec. 2023, 1.
- Cheng, X.; Qiu, S.; Zou, Z.; Pu, J.; Xue, X. Understanding depth map progressively: Adaptive distance interval separation for monocular 3D object detection. arXiv 2023, arXiv:2306.10921.
- Ma, R.; Yin, Y.; Chen, J.; Chang, R. Multi-modal information fusion for liDAR-based 3D object detection framework. Multimed. Tools Appl. 2023, 13, 1731.
- Mehta, S.S.; Ton, C.; Asundi, S.; Burks, T.F. Multiple Camera Fruit Localization Using a Particle Filter. Comput. Electron. Agric. 2017, 142, 139–154.
- Guo, S.; Guo, J.; Bai, C. Semi-Direct Visual Odometry Based on Monocular Depth Estimation. In Proceedings of the 2019 IEEE International Conference on Unmanned Systems (ICUS), Beijing, China, 17–19 October 2019; pp. 720–724.
- Edan, Y.; Rogozin, D.; Flash, T. Robotic melon harvesting. IEEE Trans. Robot. Autom. 2000, 16, 831–834.
- Xiong, J.; He, Z.; Lin, R.; Liu, Z.; Bu, R.; Yang, Z.; Peng, H.; Zou, X. Visual Positioning Technology of Picking Robots for Dynamic Litchi Clusters with Disturbance. Comput. Electron. Agric. 2018, 151, 226–237.
- Wang, H.; Mao, W.; Liu, G.; Hu, X.; Li, S. Recognition and positioning of apple harvesting robot based on visual fusion. J. Agric. Mach. 2012, 43, 165–170.
- Mrovlje, J.; Vrancic, D. Distance measuring based on stereoscopic pictures. In Proceedings of the 9th International PhD Workshop on Systems and Control, Izola, Slovenia, 1–3 October 2008.
- Pal, B.; Khaiyum, S.; Kumaraswamy, Y.S. 3D point cloud generation from 2D depth camera images using successive triangulation. In Proceedings of the IEEE International Conference on Innovative Mechanisms for Industry Applications, Bangalore, India, 19–20 May 2017; pp. 129–133.
- Ji, W.; Meng, X.; Qian, Z.; Xu, B.; Zhao, D. Branch Localization Method Based on the Skeleton Feature Extraction and Stereo Matching for Apple Harvesting Robot. Int. J. Adv. Robot. Syst. 2017, 14, 172988141770527.
- Guo, A.; Xiong, J.; Xiao, D.; Zou, X. Calculation and stereo matching of picking points for litchi using fused Harris and SIFT algorithm. J. Agric. Mach. 2015, 46, 11–17.
- Jiang, H.; Peng, Y.; Ying, Y. Measurement of 3-D locations of ripe tomato by binocular stereo vision for tomato harvesting. In Proceedings of the 2008 ASABE International Meeting, Providence, RI, USA, 29 June–2 July 2008; p. 084880.
- Van Henten, E.J.; Van Tuijl, B.A.J.; Hoogakker, G.-J.; Van Der Weerd, M.J.; Emming, J.; Kornet, J.G.; Bontsema, J. An Autonomous Robot for De-leafing Cucumber Plants Grown in a High-wire Cultivation System. Biosyst. Eng. 2006, 94, 317–323.
- Van Henten, E.J.; Van Tuijl, B.A.J.; Hemming, J.; Kornet, J.G.; Bontsema, J.; Van Os, E.A. Field Test of an Autonomous Cucumber Picking Robot. Biosyst. Eng. 2003, 86, 305–313.
- Yoshida, T.; Kawahara, T.; Fukao, T. Fruit Recognition Method for a Harvesting Robot with RGB-D Cameras. Robomech. J. 2022, 9, 1–10.
- Yang, C.; Liu, Y.; Wang, Y.; Xiong, L.; Xu, H.; Zhao, W. Research on Recognition and Positioning System for Citrus Harvesting Robot in Natural Environment. Trans. Chin. Soc. Agric. Mach. 2019, 50, 14–22+72.
- Safren, Q.; Alchanatis, V.; Ostrovsky, V.; Levi, O. Detection of green apples in hyperspectral images of apple-tree foliage using machine vision. Trans. ASABE 2008, 50, 2303–2313.
- Okamoto, H.; Lee, W.S. Green citrus detection using hyperspectral imaging. Comput. Electron. Agric. 2010, 66, 201–208.
- Zhang, Q.; Chen, J.; Li, B.; Xu, C. Method for identifying and locating the picking points of tomato clusters based on RGB-D information fusion and object detection. Trans. Chin. Soc. Agric. Mach. 2021, 37, 143–152.
- Mccool, C.; Sa, I.; Dayoub, F. Visual detection of occluded crop: For automated harvesting. In Proceedings of the 2016 IEEE International Conference on Robotics and Automation, Stockholm, Sweden, 16–19 May 2016.
- Yan, B.; Fan, P.; Lei, X. A real-time apple targets detection method for picking robot based on improved YOLOv5. Remote Sens. 2021, 13, 1619.
- Liang, C.; Xiong, J.; Zheng, Z. A visual detection method for nighttime litchi fruits and fruiting stems. Comput. Electron. Agric. 2020, 169, 105192.
- Han, K.S.; Kim, S.-C.; Lee, Y.-B.; Kim, S.C.; Im, D.-H.; Choi, H.-K. Strawberry harvesting robot for bench-type cultivation. Biosyst. Eng. 2012, 37, 65–74.
- Atif, M.; Lee, S. Adaptive Pattern Resolution for Structured Light 3D Camera System. In Proceedings of the 2018 IEEE SENSORS, New Delhi, India, 28–31 October 2018; pp. 1–4.
- Weinmann, M.; Schwartz, C.; Ruiters, R.; Klein, R. A Multicamera, Multi-projector Super-Resolution Framework for Structured Light. In Proceedings of the 2011 International Conference on 3D Imaging, Modeling, Processing, Visualization and Transmission, Hangzhou, China, 16–19 May 2011; pp. 397–404.
- Lee, S.; Atif, M.; Han, K. Stand-Alone Hand-Eye 3D Camera for Smart Modular Manipulator. In Proceedings of the IEEE/RSJ IROS Workshop on Robot Modularity, Daejeon, Republic of Korea, 9–14 October 2016.
- Hyun, J.S.; Chiu, G.T.-C.; Zhang, S. High-speed and high-accuracy 3D surface measurement using a mechanical projector. Opt. Express 2018, 26, 1474–1487.
- Nevatia, R. Depth measurement by motion stereo. Comput. Graph. Image Process. 1976, 5, 203–214.
- Sa, I.; Zong, G.; Feras, D.; Ben, U.; Tristan, P.; Chris, M.C. Deepfruits: A Fruit Detection System Using Deep Neural Networks. Sensors 2016, 16, 1222.
- Subrata, I.D.M.; Fujiura, T.; Nakao, S. 3-D Vision Sensor for Cherry Tomato Harvesting Robot. Jpn. Agric. Res. Q. 1997, 31, 257–264.
- Wang, Z.; Walsh, K.B.; Verma, B. On-tree mango fruit size estimation using RGB-D images. Sensors 2017, 17, 2738.
- Rong, J.; Dai, G.; Wang, P. A peduncle detection method of tomato for autonomous harvesting. Complex Intell. Syst. 2021, 8, 2955–2969.
- Zheng, B.; Sun, G.; Meng, Z.; Nan, R. Vegetable Size Measurement Based on Stereo Camera and Keypoints Detection. Sensors 2022, 22, 1617.
- Jin, X.; Tang, L.; Li, R.; Zhao, B.; Ji, J.; Ma, Y. Edge Recognition and Reduced Transplantation Loss of Leafy Vegetable Seedlings with Intel RealsSense D415 Depth Camera. Comput. Electron. Agric. 2022, 198, 107030.
- Tran, T.M. A Study on Determination of Simple Objects Volume Using ZED Stereo Camera Based on 3D-Points and Segmentation Images. Int. J. Emerg. Trends Eng. Res. 2020, 8, 1990–1995.
- Pan, S.; Ahamed, T. Pear Recognition in an Orchard from 3D Stereo Camera Datasets to Develop a Fruit Picking Mechanism Using Mask R-CNN. Sensors 2022, 22, 4187.
- Zhang, B.H.; Huang, W.Q.; Li, J.B. Principles, developments and applications of computer vision for external quality inspection of fruits and vegetables: A review. Food Res. Int. 2014, 62, 326–343.
- Bac, C.W.; Hemming, J.; Van Henten, E.J. Robust pixel-based classification of obstacles for robotic harvesting of sweet-pepper. Comput. Electron. Agric. 2013, 96, 148–162.
- Yuan, T.; Li, W.; Feng, Q. Spectral imaging for greenhouse cucumber fruit detection based on binocular stereovision. In Proceedings of the 2010 ASABE International Meeting, Pittsburgh, PA, USA, 20–23 June 2010.
- Ji, C.; Feng, Q.; Yuan, T. Development and performance analysis of greenhouse cucumber harvesting robot system. Robot 2011, 6, 726–730.
- Bao, G.; Cai, S.; Qi, L. Multi-template matching algorithm for cucumber recognition in natural environment. Comput. Electron. Agric. 2016, 127, 754–762.
- Xu, P.; Fang, N.; Liu, N. Visual recognition of cherry tomatoes in plant factory based on improved deep instance segmentation. Comput. Electron. Agric. 2022, 197, 106991.
- Zheng, T. Research on tomato detection in natural environment based on RC-YOLOv4. Comput. Electron. Agric. 2022, 198, 107029.
- Xu, W.; Zhao, L.; Li, J. Detection and classification of tea buds based on deep learning. Comput. Electron. Agric. 2022, 192, 106547.
- Ge, Y.; Xiong, Y.; Tenorio, G.L. Fruit localization and environment perception for strawberry harvesting robots. IEEE Access 2019, 7, 147642–147652.
- Zhong, Z.; Xiong, J.; Zheng, Z. A method for litchi picking points calculation in natural environment based on main fruit bearing branch detection. Comput. Electron. Agric. 2021, 189, 106398.
- Zhang, B.; Huang, W.; Wang, C. Computer vision recognition of stem and calyx in apples using near-infrared linear-array structured light and 3D reconstruction. Biosyst. Eng. 2015, 139, 25–34.
- Feng, Q.; Zhao, C.; Wang, X. Measurement method for targeted measurement of cherry tomato fruit clusters based on visual servoing. Trans. Chin. Soc. Agric. Mach. 2015, 31, 206–212.
- Zhao, Y.; Gong, L.; Huang, Y.; Liu, C. Robust tomato recognition for robotic harvesting using feature images fusion. Sensors 2016, 16, 173.
- Li, Y. Research on Target Recognition and Positioning Technology of Citrus Harvesting Robot Based on Binocular Vision. Master’s Thesis, Chongqing University of Technology, Chongqing, China, 2017.
- Yan, J.; Wang, P.; Wang, T. Identification and Localization of Optimal Picking Point for Truss Tomato Based on Mask R-CNN and Depth Threshold Segmentation. In Proceedings of the 2021 IEEE 11th Annual International Conference on CYBER Technology in Automation, Control, and Intelligent Systems (CYBER), Jiaxing, China, 27–31 May 2021; pp. 899–903.
- Yang, Q.; Chen, C.; Dai, J. Tracking and recognition algorithm for a robot harvesting oscillating apples. Int. J. Agric. Biol. Eng. 2020, 13, 163–170.
- Zhang, J. Target extraction of fruit picking robot vision system. J. Phys. Conf. Ser. 2019, 1423, 012061.
- Xiong, J.; Zou, X.; Peng, H. Real-time recognition and picking point determination technology for perturbed citrus harvesting. Trans. Chin. Soc. Agric. Mach. 2014, 45, 38–43.
- Xiong, J.; Lin, R.; Liu, Z. Recognition technology of litchi picking robot in natural environment at night. Trans. Chin. Soc. Agric. Mach. 2017, 48, 28–34.
- Zhu, Y.; Zhang, T.; Liu, L. Fast Location of Table Grapes Picking Point Based on Infrared Tube. Inventions 2022, 7, 27.
- Wu, F.; Duan, J.; Ai, P. Rachis detection and three-dimensional localization of cut-off point for vision-based banana robot. Comput. Electron. Agric. 2022, 198, 107079.
- Silwal, A.; Karkee, M.; Zhang, Q. A hierarchical approach to apple identification for robotic harvesting. Trans. ASABE 2016, 59, 1079–1086.
- Qi, X.; Dong, J.; Lan, Y. Method for Identifying Litchi Picking Position Based on YOLOv5 and PSPNet. Remote Sens. 2022, 14, 2004.
- Feng, Q.; Cheng, W.; Li, Y.; Wang, B.; Chen, L. Localization method of tomato plant pruning points based on Mask R-CNN. Trans. Chin. Soc. Agric. Eng. 2022, 38, 128–135.
- Feng, Q.; Cheng, W.; Zhang, W. Visual Tracking Method of Tomato Plant Main-Stems for Robotic Harvesting. In Proceedings of the 2021 IEEE 11th Annual International Conference on CYBER Technology in Automation, Control, and Intelligent Systems (CYBER), Jiaxing, China, 27–31 July 2021; pp. 886–890.
- Tafuro, A.; Adewumi, A.; Parsa, S. Strawberry picking point localization, ripeness, and weight estimation. In Proceedings of the 2022 International Conference on Robotics and Automation (ICRA), Philadelphia, PA, USA, 23–27 May 2022; pp. 2295–2302.
- Yu, Y.; Zhang, K.; Yang, L.; Zhang, D. Fruit detection for strawberry harvesting robot in non-structural environment based on Mask R-CNN. Comput. Electron. Agric. 2019, 163, 104846.
- Zhang, X.; Fu, L.; Karkee, M.; Whiting, M.D.; Zhang, Q. Canopy segmentation using ResNet for mechanical harvesting of apples. IFAC-PapersOnLine 2019, 52, 300–305.
- Xiao, X.; Huang, J.; Li, M. Fast recognition method for citrus under complex environments based on improved YOLOv3. J. Eng. 2022, 2022, 148–159.
- Zhang, P.; Liu, X.; Yuan, J. YOLO5-spear: A robust and real-time spear tips locator by improving image augmentation and lightweight network for selective harvesting robot of white asparagus. Biosyst. Eng. 2022, 218, 43–61.
- Gai, R.; Chen, N.; Yuan, H. A detection algorithm for cherry fruits based on the improved YOLO-v4 model. Neural Comput. Appl. 2023, 35, 13895–13906.
- Cui, Z.; Sun, H.M.; Yu, J.T. Fast detection method of green peach for application of picking robot. Appl. Intell. 2022, 52, 1718–1739.
- Peng, H.X.; Huang, B.; Shao, Y.Y. Generalized improved SSD model for multi-class fruit picking target recognition in natural environment. Trans. Agric. Eng. 2018, 34, 155–162.
- Su, F.; Zhao, Y.; Wang, G. Tomato Maturity Classification Based on SE-YOLOv3-MobileNetV1 Network under Nature Greenhouse Environment. Agronomy 2022, 12, 1638.
- Wu, J.; Zhang, S.; Zou, T. A Dense Litchi Target Recognition Algorithm for Large Scenes. Math. Prob. Eng. 2022, 2022, 4648105.
- Chen, J.; Wang, Z.; Wu, J. An improved Yolov3 based on dual path network for cherry tomatoes detection. J. Food Process Eng. 2021, 44, 13803.
- Ji, W.; Pan, Y.; Xu, B. A real-time Apple targets detection method for picking robot based on ShufflenetV2-YOLOX. Agriculture 2022, 12, 856.
- Zhao, D.A.; Wu, R.D.; Liu, X.Y.; Zhao, Y.Y. Localization of Apple Picking Under Complex Background Based on YOLO Deep Convolutional Neural Network. Trans. Chin. Soc. Agric. Eng. 2019, 35, 164–173.
- Zhang, Q.; Chen, J.M.; Li, B.; Xu, C. Tomato cluster picking point identification based on RGB-D fusion and object detection. Trans. Chin. Soc. Agric. Eng. 2021, 37, 143–152.
- Peng, H.; Xue, C.; Shao, Y. Litchi detection in the field using an improved YOLOv3 model. Int. J. Agric. Biol. Eng. 2022, 15, 211–220.
- Sun, G.; Wang, X. Three-dimensional point cloud reconstruction and morphology measurement method for greenhouse plants based on the Kinect sensor self-calibration. Agronomy 2019, 9, 596.
- Isachsen, U.J.; Theoharis, T.; Misimi, E. Fast and accurate GPU-accelerated, high-resolution 3D registration for the robotic 3D reconstruction of compliant food objects. Comput. Electron. Agric. 2021, 180, 105929.
