You're using an outdated browser. Please upgrade to a modern browser for the best experience.
Please note this is a comparison between Version 1 by Michele Samaja and Version 2 by Peter Tang.
Hypoxia is a life-threatening challenge for about 1% of the world population and a contributor to high morbidity and mortality scores in patients affected by various cardiopulmonary, hematological, and circulatory diseases. In most cases, it is not hypoxia that generates diseases, but rather the attempts to adapt to the hypoxia condition. Thus, when adaptation to hypoxia becomes excessive, it translates into maladaptation. The oxygen cascade may represent a tool for understanding the genesis and the consequences of physiological and pathological hypoxia.
- hypoxia
- altitude
- adaptation
- maladaptation
- genome-wide association studies
1. Introduction
About 1% of the world's human population lives permanently at >2500 m altitudes, mainly in non-Western countries [1]. The major health problem these people constantly face stems from breathing an atmosphere impoverished in oxygen (O2). On average, up to 10% of the population living at altitude develop diseases linked to insufficient O2 or hypoxia [2]. Hypoxia may occur even at sea level, contributing to morbidity and mortality in numberless patients with acute respiratory diseases (ARDS), chronic pulmonary diseases (COPD), emphysema, lung tumors, anemia, heart failure, and hundreds of other disorders that stem from unmatched O2 supply with respect to needs. Such diseases take an intolerable toll on humanity in terms of sufferance, life loss, and economic distress: the burden imposed in one single year (2010) in the US only by COPD alone was USD49.9 billion [3]. Among all the factors that afflict humanity, hypoxia has the unique feature of being both physiological (i.e., due to altitude), and pathological (i.e., due to a pre-existing disease). When physiological, hypoxia may raise some form of adaptation, and the ability to adapt to environmental stress factors represents a key feature in the Darwinian theory of evolution of species. However, it is not yet clear whether humans can ever adapt to hypoxia, given the high incidence of the clinical manifestations associated with both physiological and pathological hypoxia.
2. Oxygen and Hypoxia
Three 18th-century scientists participated in the discovery of O2. Carl Wilhelm Scheele (1742–1786), a Swedish–German pharmaceutical chemist, was the first to discover O2, but his low academic profile and lack of international competitiveness caused him the loss of priority for this discovery [4]. Joseph Priestley (1733–1804), a polyhedric English chemist, natural philosopher, separatist theologian, grammarian, multi-subject educator, and liberal political theorist, was able to intertwine his scientific work with the ongoing debate on phlogiston within a conflict with the Church of England that led him to migrate to the US. His publication, although delayed with respect to that of Scheele, gained him priority as a discoverer of O2 [5]. Finally, Antoine Lavoisier (1743–1794), a French nobleman and chemist, coined, together with Marie-Anne Lavoisier, the term “oxygen”, based on the misleading concept of a substance that generates acidity (-ὀξύς (oxys, acid) + -γενής (-genēs, generator)), during the years of the French Revolution that led Antoine to execution under the guillotine [6]. The contributions by two other 17th-century scientists, the English John Mayhow (1661–1679) and the Polish Michael Sendivogius (1566–1636) should also be mentioned, although their extraordinary work probably was not robust enough to assign them the role of discoverers of O2 [7].3. The Oxygen Cascade
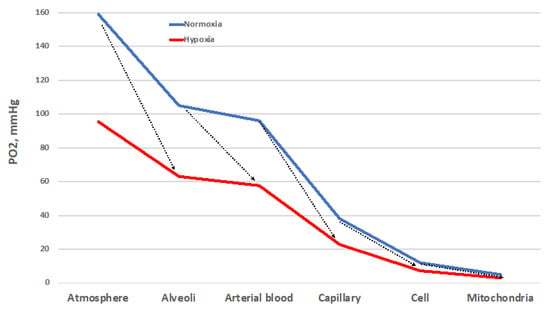
Despite important limitations [8], the O2 cascade remains a good representation of the path of O2 from the atmosphere to mitochondria, the final O2 users (Figure 1). The blue line represents the progressive stepwise decreases in PO2 along the path in normoxic healthy conditions. The establishment of O2 gradients at the interface between adjacent compartments ensures the correct flow of O2 along the cascade. Each of these gradients must be wide enough to grant a sufficient O2 supply to the mitochondria [9]. The red line represents the situation established when atmospheric PO2 is reduced by one-third, equivalent to 3400 m/13.9 %O2. Such a drop translates into a reduced width of each gradient step, which corresponds to a decreased supply of O2 to the mitochondria. Thus, all the interfaces must cooperate to ensure the correct O2 supply. The same reduction in O2 supply to mitochondria occurs when the environmental PO2 is normal, but some sites of resistance to the O2 flux emerge in the correspondence of one of the interfaces. This situation corresponds to wider PO2 gradients between adjacent compartments. Such sites of resistance are usually associated with diseases that transform a normoxic situation into a hypoxic one downstream of the block in the O2 cascade. This determines the establishment of pathological hypoxia, which differs from the physiological one by being often accompanied by factors such as inflammation and redox imbalance, just to name a few.
Figure 1. The oxygen cascade in normoxia (blue) and in hypoxia (red, which depicts the situation at 3400 m/13.9 %O2). The arrows indicate the sites of resistance to the O2 flux that increase the PO2 gradient. These sites of resistance may convert a normoxic situation into a hypoxic one. Other explanations in the text.

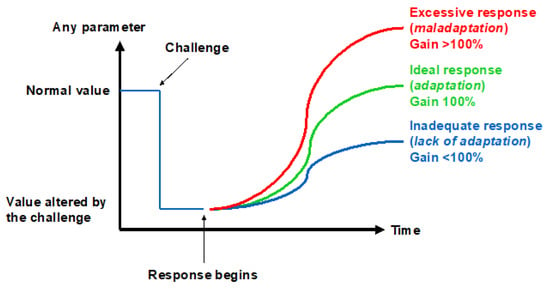
Figure 2.
Three ways to respond to a challenge.
4. Adaptation vs. Maladaptation
4.1. Ability of Sea Level Populations to Adapt to High Altitude
Most literature data are obtained in the days or weeks immediately following the onset of hypoxia, where the signs of maladaptation are addressed in terms of AMS insurgence. Relatively little data are available to document the effects of longer (months, years) exposures, which may give clues for the ability of low-altitude dwellers to adapt to hypoxia.
The sojourners in the Antarctica plateau are fit and healthy individuals who are specifically trained to sojourn for up to 10 months at an equivalent altitude of 3800 m/13.2 %O2 in an environment that excludes the presence of disturbing variables related to cold and changes in altitude, with the only probable exception the rupture of circadian rhythms [12]. In these subjects, the expected changes in the acid–base status are maintained for 10 months without any appreciable modification [12]. Remarkably, even the metabolome changes remain unaffected for that period of time, with the exception of a slow return toward baseline of the non-polar metabolome after 6 months of hypoxia [13]. Likewise, the variables linked to the redox imbalance, including ROS, oxidative stress biomarkers, NO, and proinflammatory cytokines, peak by the 20th day of hypoxia but do not return to baseline levels [14]. Such data highlight a missed capacity of adaptation to hypoxia in Caucasians born at sea level, at least for one year. Longer permanence of sea-level dwellers at altitude, such as immigrant Han Chinese in Tibet, gives rise to up to 18% incidence of CMS [15]. Thus, to the best of the ouresearchers' knowledge, available data indicate that sea-level-dwellers exposed to hypoxia for years have missed the ability to adapt to this challenge.
4.2. Generations-Long Adaptation to Hypoxia
About 80 million people live permanently at >2500 m altitude in the Andes, South-East Asia, and Ethiopia [1]. These populations have developed diverging responses to altitude hypoxia. Andeans go the hematological route [16] with elevated Hb that enables carrying more O2 in blood, but high CMS incidence, which occurs in 16% of the adult male population, with increasing prevalence with age, rising up to 30% by the fifth decade of age [17], highlighting poor adaptation to hypoxia. Tibetans go the respiratory route [16]: They inhale more air with each breath and breathe more rapidly with high plasma NO2− + NO3−, a biomarker of the NO-storing capacity. This results in sporadic CMS in altitude-native Tibetans [15][18]. Ethiopians Amhara highlanders display lower CMS rates [19], reduced erythropoiesis, higher plasma NO2− + NO3− and cGMP, and lower diastolic blood pressure. These features translate into a marked vasodilatory response to hypoxia with respect to related lowlanders at altitude, who instead display an elevated erythropoietic response [20]. Although not properly an altitude population, the Kyrghyz commuters are of interest because 14–20% of them show signs of altitude PH and are characterized by a higher-than-normal fraction of hyper-responders to acute hypoxia [21]. A case–control study identified in healthy Kyrghyz highlanders the presence of genetic traits that discriminate hyper-responders to hypoxia who develop PH [22]. It was pointed out [22] that Kyrghyz commuters have unique patterns with respect to other altitude populations because they do not present other features linked to chronic hypoxia besides PH, unlike the Andean population, where polycythemia may have confounding characteristics, or Tibetans, where PH is practically absent.
It is therefore tempting to state that high-altitude populations born and residing in the Himalayas (Tibetans, Sherpas, and to a lesser extent Ladakhis) are “adapted” to altitude because they suffer altitude-related diseases to a lesser extent and display reduced erythropoietic response. By contrast, Andean populations (Aymaras and Quechuas) reveal an exaggerated erythropoietic response with hematocrit values exceeding 50% and an increased risk of dysfunction due to high blood viscosity [23][24][25]. A hypothesis explaining the Tibetan–Andean differences is the longer altitude residence for Tibetans (about 30,000 years), with enough time to adapt genetically than for Andeans (about 10,000 years) [26]. These figures are, however, complicated by the relatively recent massive migration into the Andes in the XVIIth century, as opposed to the relatively conserved population distribution in the Himalayas.
4.3. Ability of High-Altitude Populations to Adapt to Sea Level
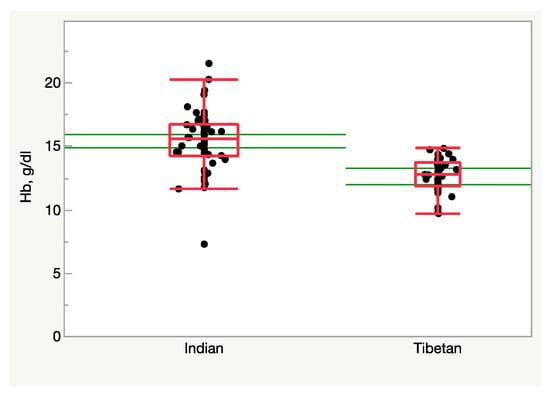
Although uncommon, in some instances altitude-adapted subjects are forced, mostly for political reasons, to flee their native habitats in search of more suitable environments, often at lower altitudes. Several thousand Tibetan refugees born at altitude but residing at sea level provide the unique opportunity to test the reversibility of the processes that may have driven altitude adaptation. In this instance, the hypoxic stimulus is broken, and the subjects are exposed to a condition of relative hyperoxia. Figure 3 (Samaja et al., unpublished observations) shows the blood Hb concentration in individuals born in Tibet who have fled to <500 m/>20.1 %O2, and in Indian-ancestry residents in the same area as a control. Clearly, missing the hypoxic stimulus remarkably depresses erythropoiesis, at least in males, who face the risk of becoming anemic. Another large-scale study revealed a lower RBC count, hematocrit, and Hb levels in Tibetans living long-term at low altitudes compared to their high-altitude counterparts [27]. In a further study, it was found that the Hb concentration was lower in Tibetans living at sea level than in Han Chinese individuals, along with a higher minute ventilation and blunted pulmonary vascular responses to acute (minutes) and sustained (8 h) hypoxia [28]. The same study also shows a lower hypoxic induction of HIF-regulated genes in peripheral blood lymphocytes as well as a significant correlation between EPAS1 and EGLN1 genotypes and induction of EPO by hypoxia in Tibetans compared with Han Chinese, highlighting the less-vigorous response to hypoxic challenge [28]. This evidence converges in indicating the occurrence of outcomes compatible with a response to a relatively hyperoxic environment in subjects adapted to live at altitude. It remains to be established if such a hematological response to relative hyperoxia is harmful.


Figure 3. Hemoglobin concentration in the blood of Tibetan and Indian males (n = 37 and 56, respectively) residing at <500 m/>20.1 %O2. Tibetans display a lower Hb level (p < 0.0001, Student’s t-test). The green lines represent the 95% confidence limits.
References
- Beall, C.M. Adaptation to High Altitude: Phenotypes and Genotypes. Annu. Rev. Anthropol. 2014, 43, 251–272.
- Leon-Velarde, F.; Maggiorini, M.; Reeves, J.T.; Aldashev, A.; Asmus, I.; Bernardi, L.; Ge, R.L.; Hackett, P.; Kobayashi, T.; Moore, L.G.; et al. Consensus statement on chronic and subacute high altitude diseases. High Alt. Med. Biol. 2005, 6, 147–157.
- Guarascio, A.J.; Ray, S.M.; Finch, C.K.; Self, T.H. The clinical and economic burden of chronic obstructive pulmonary disease in the USA. Clin. Outcomes Res. CEOR 2013, 5, 235–245.
- West, J.B. Carl Wilhelm Scheele, the discoverer of oxygen, and a very productive chemist. Am. J. Physiol. Lung Cell. Mol. Physiol. 2014, 307, L811–L816.
- West, J.B. Joseph Priestley, oxygen, and the enlightenment. Am. J. Physiol. Lung Cell. Mol. Physiol. 2014, 306, L111–L119.
- West, J.B. The collaboration of Antoine and Marie-Anne Lavoisier and the first measurements of human oxygen consumption. Am. J. Physiol. Lung Cell. Mol. Physiol. 2013, 305, L775–L785.
- Sternbach, G.L.; Varon, J. The discovery and rediscovery of oxygen. J. Emerg. Med. 2005, 28, 221–224.
- Poole, D.C.; Musch, T.I.; Colburn, T.D. Oxygen flux from capillary to mitochondria: Integration of contemporary discoveries. Eur. J. Appl. Physiol. 2022, 122, 7–28.
- Dominelli, P.B.; Wiggins, C.C.; Roy, T.K.; Secomb, T.W.; Curry, T.B.; Joyner, M.J. The Oxygen Cascade During Exercise in Health and Disease. Mayo Clin. Proc. 2021, 96, 1017–1032.
- Mallet, R.T.; Burtscher, J.; Pialoux, V.; Pasha, Q.; Ahmad, Y.; Millet, G.P.; Burtscher, M. Molecular Mechanisms of High-Altitude Acclimatization. Int. J. Mol. Sci. 2023, 24, 1698.
- Monge, C.; Leon-Velarde, F. Physiological adaptation to high altitude: Oxygen transport in mammals and birds. Physiol. Rev. 1991, 71, 1135–1172.
- Porcelli, S.; Marzorati, M.; Healey, B.; Terraneo, L.; Vezzoli, A.; Bella, S.D.; Dicasillati, R.; Samaja, M. Lack of acclimatization to chronic hypoxia in humans in the Antarctica. Sci. Rep. 2017, 7, 18090.
- Cas, M.D.; Morano, C.; Ottolenghi, S.; Dicasillati, R.; Roda, G.; Samaja, M.; Paroni, R. Inside the Alterations of Circulating Metabolome in Antarctica: The Adaptation to Chronic Hypoxia. Front Physiol. 2022, 13, 819345.
- Mrakic-Sposta, S.; Montorsi, M.; Porcelli, S.; Marzorati, M.; Healey, B.; Dellanoce, C.; Vezzoli, A. Effects of Prolonged Exposure to Hypobaric Hypoxia on Oxidative Stress: Overwintering in Antarctic Concordia Station. Oxidative Med. Cell. Longev. 2022, 2022, 4430032.
- Jiang, C.; Chen, J.; Liu, F.; Luo, Y.; Xu, G.; Shen, H.Y.; Gao, Y.; Gao, W. Chronic mountain sickness in Chinese Han males who migrated to the Qinghai-Tibetan plateau: Application and evaluation of diagnostic criteria for chronic mountain sickness. BMC Public Health 2014, 14, 701.
- Beall, C.M. Two routes to functional adaptation: Tibetan and Andean high-altitude natives. Proc. Natl. Acad. Sci. USA 2007, 104 (Suppl. 1), 8655–8660.
- Monge, C.C.; Arregui, A.; Leon-Velarde, F. Pathophysiology and epidemiology of chronic mountain sickness. Int. J. Sport. Med. 1992, 13 (Suppl. 1), S79–S81.
- Wu, T.Y. Chronic mountain sickness on the Qinghai-Tibetan plateau. Chin. Med. J. 2005, 118, 161–168.
- Sahota, I.S.; Panwar, N.S. Prevalence of Chronic Mountain Sickness in high altitude districts of Himachal Pradesh. Indian J. Occup. Env. Med. 2013, 17, 94–100.
- Cheong, H.I.; Janocha, A.J.; Monocello, L.T.; Garchar, A.C.; Gebremedhin, A.; Erzurum, S.C.; Beall, C.M. Alternative hematological and vascular adaptive responses to high-altitude hypoxia in East African highlanders. Am. J. Physiol. Lung Cell. Mol. Physiol. 2017, 312, L172–L177.
- Aldashev, A.A.; Sarybaev, A.S.; Sydykov, A.S.; Kalmyrzaev, B.B.; Kim, E.V.; Mamanova, L.B.; Maripov, R.; Kojonazarov, B.K.; Mirrakhimov, M.M.; Wilkins, M.R.; et al. Characterization of high-altitude pulmonary hypertension in the Kyrgyz: Association with angiotensin-converting enzyme genotype. Am. J. Respir. Crit. Care Med. 2002, 166, 1396–1402.
- Iranmehr, A.; Stobdan, T.; Zhou, D.; Poulsen, O.; Strohl, K.P.; Aldashev, A.; Telenti, A.; Wong, E.H.M.; Kirkness, E.F.; Venter, J.C.; et al. Novel insight into the genetic basis of high-altitude pulmonary hypertension in Kyrgyz highlanders. Eur. J. Hum. Genet 2018, 27, 150–159.
- Winslow, R.M.; Chapman, K.W.; Gibson, C.C.; Samaja, M.; Monge, C.C.; Goldwasser, E.; Sherpa, M.; Blume, F.D.; Santolaya, R. Different hematologic responses to hypoxia in Sherpas and Quechua Indians. J. Appl. Physiol. (1985) 1989, 66, 1561–1569.
- Santolaya, R.; Lahiri, S.; Alfaro, R.; Schoene, R. Respiratory adaptation in the highest inhabitants and highest Sherpas mountaineers. Respir. Physiol. 1989, 77, 253–262.
- Beall, C.; Brittenham, G.; Macuaga, F.; Barragan, M. Variation in hemoglobin concentration among samples of high-altitude natives in the Andes and the Himalayas. Am. J. Hum. Biol. 1990, 2, 639–651.
- Beall, C.M. Human adaptability studies at high altitude: Research designs and major concepts during fifty years of discovery. Am. J. Hum. Biol. 2013, 25, 141–147.
- Basak, N.; Norboo, T.; Mustak, M.S.; Thangaraj, K. Heterogeneity in Hematological Parameters of High and Low Altitude Tibetan Populations. J. Blood Med. 2021, 12, 287–298.
- Petousi, N.; Croft, Q.P.; Cavalleri, G.L.; Cheng, H.Y.; Formenti, F.; Ishida, K.; Lunn, D.; McCormack, M.; Shianna, K.V.; Talbot, N.P.; et al. Tibetans living at sea level have a hyporesponsive hypoxia-inducible factor system and blunted physiological responses to hypoxia. J. Appl. Physiol. (1985) 2014, 116, 893–904.
More
