The production of hydrogen as both chemical feed and energy carrier using low-carbon technologies is one of the solutions to reach net-zero emissions. The publications on the life-cycle assessment of photovoltaic (PV)-based hydrogen production focused on the carbon footprint are reviewed. The global warming potential (GWP) values of this H2 production process considering the state-of-the-art PV panels for installation in Italy are updated.
- hydrogen
- photovoltaic
- carbon footprint
- electrolysis
1. Introduction
| Category | Color | Process | Source |
|---|---|---|---|
| High environmental footprint (high carbon) | Brown/Black | Gasification | Fossil fuels Coal |
| Grey | Steam reforming | Fossil fuels Natural gas |
|
| Low environmental footprint (low carbon) | Blue | Steam reforming or gasification + CO2 capture and sequestration (CCS) | Fossil fuels Natural gas |
| Turquoise | Pyrolysis | Fossil fuels Natural gas |
|
| Yellow | Electrolysis | Water and electricity from the grid (generic) | |
| Pink/Red | Electrolysis | Water and electricity from nuclear source | |
| Green | Electrolysis (+biomass *) | Water and electricity from renewable sources/biomass * |
2. Hydrogen Production
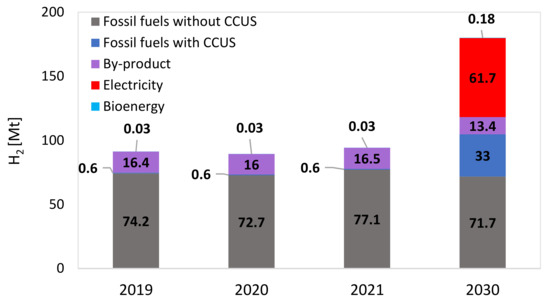
The water electrolysis process to produce hydrogen and oxygen has been known for two centuries, with the advantage of producing extremely pure hydrogen and a relatively straightforward process based on electricity consumption as energy input. Most applications have been limited to small-scale and unique situations in which access to large-scale fossil fuel-based hydrogen production plants—which dominate today’s production, as reported in Figure 1—was not possible or not justified (e.g., electronic industry, food industries as well as medical applications) [11][8]. Recent developments towards a lower cost of electrolyzers and the perspective availability of low-cost renewable electricity are making their application more attractive. The electrolysis processes can be grouped based on the electrolyte, which may feature different pH (alkaline and acid) or physical state (liquid or solid) [12][9]. In the following, the 4 most common types of electrolyzers proposed for hydrogen production are shortly explained.-
Alkaline
-
Proton-exchange membrane
-
Solid oxide electrolyzer cells
-
Anion-exchange membrane
3. Electricity Source—Photovoltaic
Utility-scale photovoltaic (PV) plants include modules, mounting systems, inverters, transformers, cables, electrical protection systems, measurement equipment, and system monitoring [33][24]. The PV modules produce direct current electricity using solar irradiance and then convert it into alternating current in an inverter for further applications. Crystalline silicon PV panels production starts with silica mining, carbothermic/quartz reduction (removing oxygen from silica), metallurgical-grade silicon (MG-Si) purification, solar-grade (SOG) silicon construction, silicon ingot crystallization, wafer slicing, PV module assembly and finishes with module and laminate construction [34][25]. The silicon ore is reduced to metallurgical-grade silicon with silicon purity of around 99% via the use of carbon in a large arc furnace [35][26]. Metallurgical-grade silicon is further refined to 99.999% purity using the modified Siemens process, which is more advanced and less energy-consuming than the original Siemens process [36][27]. To produce high-purity silicon, the modified Siemens process consumes a considerable amount of energy due to the operation of the reaction chamber at a high working temperature (typically between 1100 °C and 1200 °C) [37][28], while over the last decade, the energy and material efficiency of the Siemens process has improved remarkably [38][29]. Single-crystalline and multi-crystalline silicon ingots are obtained by crystallization through the Czochralski process and casting of solar-grade silicon, respectively. These ingots are sliced using a multi-wire saw combined with a slurry of cooling liquid and abrasive particles and then treated by subsequent etching with sodium hydroxide (NaOH) and washing with water and sulfuric acid (H2SO4) [36][27]. PV cells are produced via different steps, surface preparation, dopant diffusion, junction formation, and coating, in which some materials like electric pole printing ribbons, nitrogen, oxygen, and argon are used [35][26]. Finally, solar cells are connected into a string and then encapsulated by two layers of glass and plastics (ethylene-vinyl acetate) to form the PV module [37][28].4. Life-Cycle Assessment
The process-based life-cycle assessment (LCA) method is considered one of the most analytical methods to evaluate the environmental profile of products (goods and services), such as hydrogen. Since then, numerous directives, communications, and recommendations of the European Commission have been referred to LCA. The LCA is an internationally recognized method according to the principles defined in ISO 14040 and 14044 [39,40][30][31]. Italy is one of the 6 European countries with an annual renewable electricity potential capacity higher than 600 TWh [42][32]. The outcomes were calculated using SimaPro 9.4 software [43][33], the ecoinvent 3.5 library cut-off method as the Life Cycle Inventory database [44][34], and the Environmental Footprint (EF) 3.0 as the characterization method [45][35]. The environmental burdens of co-production and end-of-life treatment processes were assessed using the partitioning method in compliance with the ecoinvent library. For modeling the end-of-life scenarios, waste producers bear the burden of waste treatment based on the “polluter pays” principle; consumers of recycled products receive them without charge. The Life Cycle Inventory data (LCI) or foreground data for the alkaline electrolysis system are based on Sundin [46][36], which relies on Koj et al. [18][37]. The functional unit is defined as the hydrogen weight (1 kg) following the proposed harmonized life-cycle global warming impact of renewable hydrogen [47][38]. The boundary system is cradle-to-gate (CTG), in which only the life cycle of hydrogen is considered up to its production. Figure 3 shows the schematic boundary system.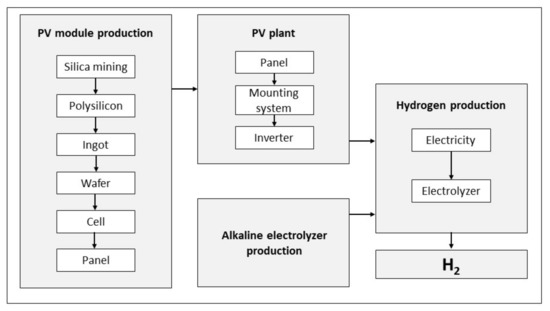
-
For the baseline scenario, the electrolysis system is powered by Italy’s default ground-mounted PV system in the ecoinvent database. The ground-mounted PV system in ecoinvent is equipped with multi-Si panels. To make a comparison, the panel is substituted with the available single-Si module in ecoinvent. Consequently, the relative factors, like the area of the PV panels and the mounting system, are adjusted. Also, a sensitivity analysis was carried out, evaluating the impact of: (i) the PV system lifetime, (ii) electrolyzer operating hours in its lifecycle, (iii) the specific electricity consumption of the electrolyzer, and (iv) the solar irradiance (insolation) for the PV plant equipped with ecoinvent default multi-Si panels. The baseline scenario assumptions and limits of sensitivity analysis are summarized in Table 2.
| Parameter | Description | Sensitivity Analysis Limits |
|---|---|---|
| Location (Insolation [kWh/m2 year]) | Italy (1250) | 1250–2200 |
| PV system lifetime [years] | 30 | 15–30 |
| Annual specific yield [kWh/kWp] | 1033 | |
| Module types | Single-Si, Multi-Si |
| Parameter | Description | |||
|---|---|---|---|---|
| PV system lifetime [years] | 30 | |||
| Annual specific yield—Italy [kWh/kWp] | 1376 [48][39] | |||
| Annual specific yield—Terna, Italy [kWh/kWp] | 1114 | |||
| Module efficiencies | 14%, 13% | |||
| Annual specific yield—Terna, Lombardy [kWh/kWp | 952 | |||
| Annual specific yield—Terna, Lazio [kWh/kWp] | PV system installation | Ground-mounted * | ||
| ] | 1189 | Electrolyzer type | Alkaline | |
| Annual specific yield—Terna, Sicily [kWh/kWp] | 1242 | Electrolyzer lifetime [hours] | ||
| Module types | Single-Si, Multi-Si | 80,000 | 30,000–80,000 | |
| Module efficiency | 20% [51][42], 18% [48][39] | Electrolyzer capacity [MW] | 6 | |
| Electrolyzer specific consumption [kWhel/kg H2] | 50 | 50–65 |
| PV system installation |
| Ground-mounted |
5. Photovoltaic Module Supply Chain
Among the 22 studies, 50% used different versions of the ecoinvent as a background database [59,68,70,73,76,78,79,81–84][45][46][47][48][49][50][51][52][53][54][55]. In five articles, the background data are not introduced [55,56,63,74,80] [56][57][58][59][60]. Only one study is based on Gabi [66][61], while another used both Gabi and ecoinvent [85][62]. Similarly, one study used the GEMIS database [53][63], while another one is based on both GEMIS and GREET [64]. Also, only one study used the Japanese IDEA database [71][65]. Lombardi et al. [62][66] reported SimaPro as a database, whereas SimaPro is a software. Figure 5a shows the library distribution used.
The Life Cycle Inventory or foreground data can play an important role in LCA. The majority of the reviewed studies (80%) are based on available data from literature or reports (secondary data) [55,56,59,63,66,68,70,71,73,74,76,78,79,81–85][45][46][47][48][49][50][51][52][53][54][55][56][57][58][59][61][62][65]. Only two of the studies reported that partially they had access to some primary data [62,80] [60][66]. The remaining two studies did not reveal their inventory data [53,64][63][64]. The distribution of LCI is indicated in Figure 5b.
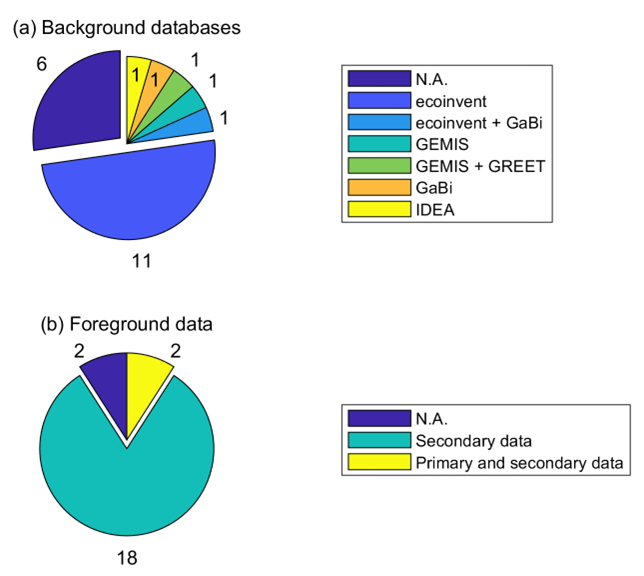
Figure 5.
Distribution of (
a
) background databases and (
b
) foreground data.
The main component of a solar PV system is the module. Among the reviewed studies, 40% did not mention the solar PV panel type considered in their work [53,59,64,66,68,70,71,83,85][45][46][47][54][61][62][63][64][65]. Multi-Si PV modules are assumed in 9 (40%) of the articles [62[48][49][50][51][52][53][55][60][66],73,76,78–82,84], while only one paper considered single-Si panels [74][59]. Three of the studies are based on thin-film panels [55,56,63][56][57][58]. The module efficiency is an important factor related to the nominal power of the panel and its area. Higher panel efficiency means a lower area is needed to reach a specific power output.
Some studies did not specify the panel efficiency. In 10 studies, the panel efficiency was reported or it could be realized. FigureFigure 6 6 shows the trend of PV modules’ efficiency (left axis) and the corresponding GWP values for each kg of H2 (right axis) with respect to the year of the publication. The panel efficiency has increased over time; however, in the case of using the default version of ecoinvent, the increase in efficiency is not applied. The studies [55,56,63][56][57][58] used thin-film PV panels with an efficiency of around 5% according to the reference they have used, i.e., Meier 2002 [57][67]. The multi-Si panels considered in [62,73][48][66] have an efficiency of 12.7% and 14.2%, respectively. The single-Si modules used by Sadeghi et al. [74][59] are 16% efficient. The solar PV farm by Palmer et al. [78][50] is based on multi-Si panels with 16.8% efficiency. Some studies are based on ecoinvent without any further changes for open-ground multi-Si solar plants [76,79,82][49][51][53]. Therefore, they are based on modules with 13% efficiency. The average efficiency of the panels considered in the related literature is only 12.95%. As shown in Figure 6, the GWP value (orange line) does not necessarily decrease with the increase in module efficiency (blue line). Two points can explain this non-trivial behavior. Firstly, the location of the PV site is an important factor in the GWP value of PV-based H2. For example, the value of 4.6 kg CO2 eq./kg H2 shown for multi-Si in 2022 is the average GWP of 6 values for five different locations (Spain = 3.8 kg CO2 eq./kg H2 and Germany = 5.65 kg CO2 eq./kg H2). Secondly, the quality of the LCA analysis depends on the data quality and transparency, which can significantly affect the climate footprint and lead to inconsistency in the result.
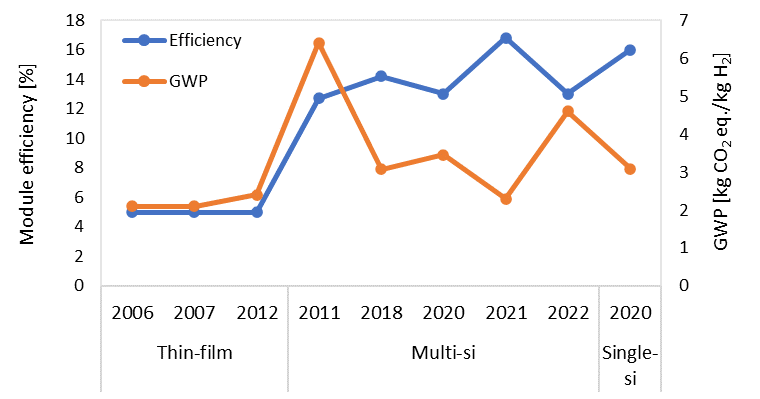
Figure 6.
Efficiency and type of the modules and corresponding GWP value of the produced H
2
with respect to the year of publication.
The GWP values for producing 1 kg of H2 via electrolysis systems powered by PV, extracted from 21 studies, are divided into two groups: Europe and the rest of the world. Among the 22 studies reviewed, only the work of Suleman et al. [68][46] is excluded since their GWP value (0.37 kg CO2 eq./kg H2) is relatively low and is not comparable with other studies. Their electrolytic cell co-produces chlorine and caustic soda in addition to H2, resulting in very low GWP values due to: (i) a different electrolysis system compared to the more common alkaline and PEM electrolyzers and (ii) the allocation approach used, which the authors do not specify.
The GWP values are plotted in Figure 7, providing statistical information (i.e., mean, standard deviations, 25th and 75th percentiles). The first column represents 16 GWP values for PV-based H2 production in Europe. The values fluctuate from 3 to 6.4 kg CO2 eq./kg H2, where the mean is 4.83 kg CO2 eq./kg H2 with a standard deviation equal to 1.05 kg CO2 eq./kg H2. The second column is based on seven studies located outside of Europe (rest of the world), in which exist values as low as 2.1 kg CO2 eq./kg H2 and as high as 9.37 kg CO2 eq./kg H2. The PV-based H2 GWP values for the rest of the world show a mean equal to 3.82 with a standard deviation of 2.17 kg CO2 eq./kg H2. Comparing the two columns suggests that GWP values for the production of H2 via electrolysis powered by PV systems in Europe might be higher with respect to production sites outside of this continent. According to the variation of GWP results in the literature, it can be noted that comparing or interpreting the carbon footprint or, in general, the environmental profile of the PV-based H2 is not trivial. On the one hand, some works’ unclear assumptions or lack of data make comparing the studies even more difficult. On the other hand, different system boundaries and different electrolysis systems can alter environmental footprints. However, this work tried to present the extracted GWP values in a quasi-harmonized manner (in case of possibility compression or liquefaction steps are excluded).
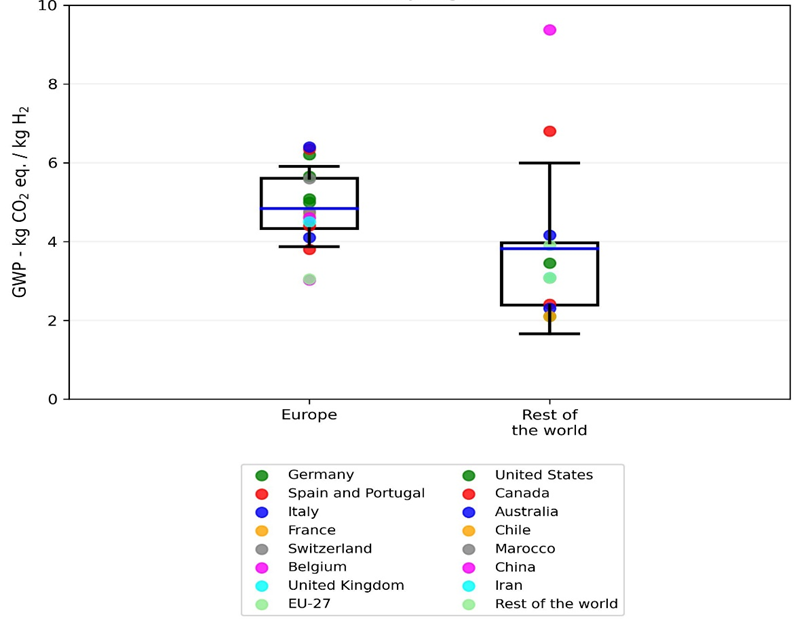
Figure 7.
Distribution of GWP values of solar-PV-powered electrolysis system of each kg of H
2
from the literature.
References
- International Energy Agency (IEA) Hydrogen. 2022. Available online: https://www.iea.org/reports/global-hydrogen-review-2022 (accessed on 15 December 2022).
- International Renewable Energy Agency (IRENA) Hydrogen from Renewable Power: Technology Outlook for the Energy Transition. Available online: https://www.irena.org/publications/2018/sep/hydrogen-from-renewable-power (accessed on 17 November 2022).
- International Energy Agency (IEA) Hydrogen Projects Database. Available online: https://www.iea.org/data-and-statistics/data-product/hydrogen-projects-database (accessed on 20 November 2022).
- EU Commission ANNEX 1 to the Commission Delegated Regulation Supplementing Regulation (EU) 2020/852 of the European Parliament and of the Council: Manufacture of Hydrogen 2021. Available online: https://eur-lex.europa.eu/legal-content/EN/TXT/PDF/?uri=CELEX:32021R2139 (accessed on 20 March 2023).
- Bhandari, R.; Trudewind, C.A.; Zapp, P. Life Cycle Assessment of Hydrogen Production via Electrolysis—A Review. J. Clean. Prod. 2014, 85, 151–163.
- Parkinson, B.; Balcombe, P.; Speirs, J.F.; Hawkes, A.D.; Hellgardt, K. Levelized Cost of CO2 Mitigation from Hydrogen Production Routes. Energy Environ. Sci. 2019, 12, 19–40.
- Nugent, D.; Sovacool, B.K. Assessing the Lifecycle Greenhouse Gas Emissions from Solar PV and Wind Energy: A Critical Meta-Survey. Energy Policy 2014, 65, 229–244.
- Stolten, D.; Emonts, B. Hydrogen Science and Engineering, 2 Volume Set: Materials, Processes, Systems, and Technology; John Wiley & Sons: Hoboken, NJ, USA, 2016; Volume 1, ISBN 3527332383.
- Bodner, M.; Hofer, A.; Hacker, V. H2 Generation from Alkaline Electrolyzer. Wiley Interdiscip. Rev. Energy Environ. 2015, 4, 365–381.
- Koj, J.C.; Schreiber, A.; Zapp, P.; Marcuello, P. Life Cycle Assessment of Improved High Pressure Alkaline Electrolysis. Energy Procedia 2015, 75, 2871–2877.
- Trasatti, S. Water Electrolysis: Who First? J. Electroanal. Chem. 1999, 476, 90–91.
- Ursua, A.; Gandia, L.M.; Sanchis, P. Hydrogen Production from Water Electrolysis: Current Status and Future Trends. Proc. IEEE 2011, 100, 410–426.
- Ajanovic, A.; Sayer, M.; Haas, R. The Economics and the Environmental Benignity of Different Colors of Hydrogen. Int. J. Hydrogen Energy 2022, 47, 24136–24154.
- Bareiß, K.; de la Rua, C.; Möckl, M.; Hamacher, T. Life Cycle Assessment of Hydrogen from Proton Exchange Membrane Water Electrolysis in Future Energy Systems. Appl. Energy 2019, 237, 862–872.
- Zhao, G.; Kraglund, M.R.; Frandsen, H.L.; Wulff, A.C.; Jensen, S.H.; Chen, M.; Graves, C.R. Life Cycle Assessment of H2O Electrolysis Technologies. Int. J. Hydrogen Energy 2020, 45, 23765–23781.
- El-Emam, R.S.; Özcan, H. Comprehensive Review on the Techno-Economics of Sustainable Large-Scale Clean Hydrogen Production. J. Clean. Prod. 2019, 220, 593–609.
- Aricò, A.S.; Siracusano, S.; Briguglio, N.; Baglio, V.; Di Blasi, A.; Antonucci, V. Polymer Electrolyte Membrane Water Electrolysis: Status of Technologies and Potential Applications in Combination with Renewable Power Sources. J. Appl. Electrochem. 2013, 43, 107–118.
- Zakaria, Z.; Kamarudin, S.K. A Review of Alkaline Solid Polymer Membrane in the Application of AEM Electrolyzer: Materials and Characterization. Int. J. Energy Res. 2021, 45, 18337–18354.
- Chatenet, M.; Pollet, B.G.; Dekel, D.R.; Dionigi, F.; Deseure, J.; Millet, P.; Braatz, R.D.; Bazant, M.Z.; Eikerling, M.; Staffell, I.; et al. Water Electrolysis: From Textbook Knowledge to the Latest Scientific Strategies and Industrial Developments. Chem. Soc. Rev. 2022, 51, 4583–4762.
- Posdziech, O.; Schwarze, K.; Brabandt, J. Efficient Hydrogen Production for Industry and Electricity Storage via High-Temperature Electrolysis. Int. J. Hydrogen Energy 2019, 44, 19089–19101.
- Sapountzi, F.M.; Gracia, J.M.; Weststrate, C.J.; Fredriksson, H.O.A.; Niemantsverdriet, J.W. Electrocatalysts for the Generation of Hydrogen, Oxygen and Synthesis Gas. Prog. Energy Combust. Sci. 2017, 58, 1–35.
- Vincent, I.; Bessarabov, D. Low Cost Hydrogen Production by Anion Exchange Membrane Electrolysis: A Review. Renew. Sustain. Energy Rev. 2018, 81, 1690–1704.
- Raja Sulaiman, R.R.; Wong, W.Y.; Loh, K.S. Recent Developments on Transition metal–Based Electrocatalysts for Application in Anion Exchange Membrane Water Electrolysis. Int. J. Energy Res. 2022, 46, 2241–2276.
- Barbón, A.; Bayón-Cueli, C.; Bayón, L.; Carreira-Fontao, V. A Methodology for an Optimal Design of Ground-Mounted Photovoltaic Power Plants. Appl. Energy 2022, 314, 118881.
- Wong, J.H.; Royapoor, M.; Chan, C.W. Review of Life Cycle Analyses and Embodied Energy Requirements of Single-Crystalline and Multi-Crystalline Silicon Photovoltaic Systems. Renew. Sustain. Energy Rev. 2016, 58, 608–618.
- Yang, D.; Liu, J.; Yang, J.; Ding, N. Life-Cycle Assessment of China’s Multi-Crystalline Silicon Photovoltaic Modules Considering International Trade. J. Clean. Prod. 2015, 94, 35–45.
- Mehedi, T.H.; Gemechu, E.; Kumar, A. Life Cycle Greenhouse Gas Emissions and Energy Footprints of Utility-Scale Solar Energy Systems. Appl. Energy 2022, 314, 118918.
- Ludin, N.A.; Mustafa, N.I.; Hanafiah, M.M.; Ibrahim, M.A.; Asri Mat Teridi, M.; Sepeai, S.; Zaharim, A.; Sopian, K. Prospects of Life Cycle Assessment of Renewable Energy from Solar Photovoltaic Technologies: A Review. Renew. Sustain. Energy Rev. 2018, 96, 11–28.
- IEA. Solar PV Global Supply Chains. Available online: https://www.iea.org/reports/solar-pv-global-supply-chains (accessed on 12 February 2023).
- International Organization for Standardization ISO 14040:2006, Environmental Management—Life Cycle Assessment—Principles and Framework. Available online: https://www.iso.org/standard/37456.html (accessed on 5 July 2022).
- International Organization for Standardization ISO 14044:2006, Environmental Management—Life Cycle Assessment—Requirements and Guidelines. Available online: https://www.iso.org/standard/38498.html (accessed on 5 July 2022).
- Kakoulaki, G.; Kougias, I.; Taylor, N.; Dolci, F.; Moya, J.; Jäger-Waldau, A. Green Hydrogen in Europe—A Regional Assessment: Substituting Existing Production with Electrolysis Powered by Renewables. Energy Convers. Manag. 2021, 228, 113649.
- Pr’e Consultants B.V. SimaPro, The World’s Leading LCA Software. Available online: https://simapro.com/ (accessed on 30 January 2023).
- Ecoinvent Ecoinvent Version 3.5, Allocation, Cut-off by Classification System Model 2018. Available online: https://ecoinvent.org/ (accessed on 1 March 2023).
- European Platform on LCA|EPLCA Developer Environmental Footprint (EF). Available online: https://eplca.jrc.ec.europa.eu/LCDN/EF_archive.xhtml (accessed on 5 February 2023).
- Sundin, C. Environmental Assessment of Electrolyzers for Hydrogen Gas Production 2019 . 2019. Available online: http://urn.kb.se/resolve?urn=urn:nbn:se:kth:diva-260069 (accessed on 20 January 2023).
- Koj, J.; Wulf, C.; Schreiber, A.; Zapp, P. Site-Dependent Environmental Impacts of Industrial Hydrogen Production by Alkaline Water Electrolysis. Energies 2017, 10, 860.
- Valente, A.; Iribarren, D.; Dufour, J. Harmonised Life-Cycle Global Warming Impact of Renewable Hydrogen. J. Clean. Prod. 2017, 149, 762–772.
- Frischknecht, R.; Stolz, L.; Krebs, P.; de Wild-Scholten, M.; Sinha, P. Life Cycle Inventories and Life Cycle Assessments of Photovoltaic Systems, Report IEA-PVPS T12-19:2020. Available online: https://iea-pvps.org/wp-content/uploads/2020/12/IEA-PVPS-LCI-report-2020.pdf (accessed on 12 February 2023).
- Fraunhofer Institute for Solar Energy Systems, ISE with support of PSE Projects GmbH. Photovoltaics Report. Available online: https://www.ise.fraunhofer.de/content/dam/ise/de/documents/publications/studies/Photovoltaics-Report.pdf (accessed on 5 March 2023).
- Terna Electricity Data Archives and the Latest Electricity Report. Available online: https://www.terna.it/it/sistema-elettrico/statistiche/pubblicazioni-statistiche (accessed on 10 February 2023).
- Trina Solar TALLMAX 415W DE15M(II). Available online: https://www.trinasolar.com/us/product/tallmax-2 (accessed on 30 January 2023).
- IEA Solar PV Manufacturing Capacity and Production by Country and Region, 2021–2027. Available online: https://www.iea.org/data-and-statistics/charts/solar-pv-manufacturing-capacity-and-production-by-country-and-region-2021-2027 (accessed on 1 February 2023).
- Kanz, O.; Bittkau, K.; Ding, K.; Rau, U.; Reinders, A. Review and Harmonization of the Life-Cycle Global Warming Impact of PV-Powered Hydrogen Production by Electrolysis. Front. Electron. 2021, 2, 711103.
- Simons, A.; Bauer, C. Life Cycle Assessment of Hydrogen Production. In Transition to Hydrogen; Cambridge University Press: Cambridge, UK, 2011; pp. 13–57.
- Suleman, F.; Dincer, I.; Agelin-Chaab, M. Environmental Impact Assessment and Comparison of Some Hydrogen Production Options. Int. J. Hydrogen Energy 2015, 40, 6976–6987.
- Zhang, X.; Bauer, C.; Mutel, C.L.; Volkart, K. Life Cycle Assessment of Power-to-Gas: Approaches, System Variations and Their Environmental Implications. Appl. Energy 2017, 190, 326–338.
- Schmidt Rivera, X.C.; Topriska, E.; Kolokotroni, M.; Azapagic, A. Environmental Sustainability of Renewable Hydrogen in Comparison with Conventional Cooking Fuels. J. Clean. Prod. 2018, 196, 863–879.
- Al-Qahtani, A.; Parkinson, B.; Hellgardt, K.; Shah, N.; Guillen-Gosalbez, G. Uncovering the True Cost of Hydrogen Production Routes Using Life Cycle Monetisation. Appl. Energy 2021, 281, 115958.
- Palmer, G.; Roberts, A.; Hoadley, A.; Dargaville, R.; Honnery, D. Life-Cycle Greenhouse Gas Emissions and Net Energy Assessment of Large-Scale Hydrogen Production via Electrolysis and Solar PV. Energy Environ. Sci. 2021, 14, 5113–5131.
- Hermesmann, M.; Müller, T.E. Green, Turquoise, Blue, or Grey? Environmentally Friendly Hydrogen Production in Transforming Energy Systems. Prog. Energy Combust. Sci. 2022, 90, 100996.
- Kolb, S.; Müller, J.; Luna-Jaspe, N.; Karl, J. Renewable Hydrogen Imports for the German Energy Transition—A Comparative Life Cycle Assessment. J. Clean. Prod. 2022, 373, 133289.
- Freire Ordóñez, D.; Halfdanarson, T.; Ganzer, C.; Shah, N.; Dowell, N.M.; Guillén-Gosálbez, G. Evaluation of the Potential Use of E-Fuels in the European Aviation Sector: A Comprehensive Economic and Environmental Assessment Including Externalities. Sustain. Energy Fuels 2022, 6, 4749–4764.
- Aydin, M.I.; Dincer, I. A Life Cycle Impact Analysis of Various Hydrogen Production Methods for Public Transportation Sector. Int. J. Hydrogen Energy 2022, 47, 39666–39677.
- Weidner, T.; Tulus, V.; Guillén-Gosálbez, G. Environmental Sustainability Assessment of Large-Scale Hydrogen Production Using Prospective Life Cycle Analysis. Int. J. Hydrogen Energy 2023, 48, 8310–8327.
- Granovskii, M.; Dincer, I.; Rosen, M. Life Cycle Assessment of Hydrogen Fuel Cell and Gasoline Vehicles. Int. J. Hydrogen Energy 2006, 31, 337–352.
- Granovskii, M.; Dincer, I.; Rosen, M.A. Exergetic Life Cycle Assessment of Hydrogen Production from Renewables. J Power Sources 2007, 167, 461–471.
- Cetinkaya, E.; Dincer, I.; Naterer, G.F. Life Cycle Assessment of Various Hydrogen Production Methods. Int. J. Hydrogen Energy 2012, 37, 2071–2080.
- Sadeghi, S.; Ghandehariun, S.; Rosen, M.A. Comparative Economic and Life Cycle Assessment of Solar-Based Hydrogen Production for Oil and Gas Industries. Energy 2020, 208, 118347.
- Zhang, J.; Ling, B.; He, Y.; Zhu, Y.; Wang, Z. Life Cycle Assessment of Three Types of Hydrogen Production Methods Using Solar Energy. Int. J. Hydrogen Energy 2022, 47, 14158–14168.
- Reiter, G.; Lindorfer, J. Global Warming Potential of Hydrogen and Methane Production from Renewable Electricity via Power-to-Gas Technology. Int. J. Life Cycle Assess. 2015, 20, 477–489.
- Vilbergsson, K.V.; Dillman, K.; Emami, N.; Ásbjörnsson, E.J.; Heinonen, J.; Finger, D.C. Can Remote Green Hydrogen Production Play a Key Role in Decarbonizing Europe in the Future? A Cradle-to-Gate LCA of Hydrogen Production in Austria, Belgium, and Iceland. Int. J. Hydrogen Energy 2023, 48, 17711–17728.
- Koroneos, C. Life Cycle Assessment of Hydrogen Fuel Production Processes. Int. J. Hydrogen Energy 2004, 29, 1443–1450.
- Pereira, S.R.; Coelho, M.C. Life Cycle Analysis of Hydrogen—A Well-to-Wheels Analysis for Portugal. Int. J. Hydrogen Energy 2013, 38, 2029–2038.
- Ozawa, A.; Inoue, M.; Kitagawa, N.; Muramatsu, R.; Anzai, Y.; Genchi, Y.; Kudoh, Y. Assessing Uncertainties of Well-To-Tank Greenhouse Gas Emissions from Hydrogen Supply Chains. Sustainability 2017, 9, 1101.
- Lombardi, L.; Carnevale, E.; Corti, A. Life Cycle Assessment of Different Hypotheses of Hydrogen Production for Vehicle Fuel Cells Fuelling. Int. J. Energy Environ. Eng. 2011, 2, 63–78.
- Meier, P.J. Life-Cycle Assessment of Electricity Generation Systems and Applications for Climate Change Policy Analysis; The University of Wisconsin-Madison: Madison, WI, USA, 2002; ISBN 0493760695.