The production of hydrogen as both chemical feed and energy carrier using low-carbon technologies is one of the solutions to reach net-zero emissions. The publications on the life-cycle assessment of photovoltaic (PV)-based hydrogen production focused on the carbon footprint are reviewed. The global warming potential (GWP) values of this H2 production process considering the state-of-the-art PV panels for installation in Italy are updated.
- hydrogen
- photovoltaic
- carbon footprint
- electrolysis
1. Introduction
| Category | Color | Process | Source |
|---|
-
For the baseline scenario, the electrolysis system is powered by Italy’s default ground-mounted PV system in the ecoinvent database. The ground-mounted PV system in ecoinvent is equipped with multi-Si panels. To make a comparison, the panel is substituted with the available single-Si module in ecoinvent. Consequently, the relative factors, like the area of the PV panels and the mounting system, are adjusted. Also, a sensitivity analysis was carried out, evaluating the impact of: (i) the PV system lifetime, (ii) electrolyzer operating hours in its lifecycle, (iii) the specific electricity consumption of the electrolyzer, and (iv) the solar irradiance (insolation) for the PV plant equipped with ecoinvent default multi-Si panels. The baseline scenario assumptions and limits of sensitivity analysis are summarized in Table 2.
| High environmental footprint (high carbon) | Brown/Black |
- In the updated scenario, the market supply chain and the main parameters in LCI of PV modules are based on the International Energy Agency special report on solar PV global supply chains and the Task 12 PV sustainability LCI report, respectively [38
| Gasification |
- ,
| Fossil fuels | |
| Coal |
- ].
| Parameter | Description | Sensitivity Analysis Limits | |
|---|---|---|---|
| Grey | Steam reforming | Fossil fuels Natural gas |
|
| Low environmental footprint (low carbon) | Blue | Steam reforming or gasification + CO2 capture and sequestration (CCS) | Fossil fuels Natural gas |
| Turquoise | Pyrolysis | Fossil fuels Natural gas |
|
| Yellow | Electrolysis | Water and electricity from the grid (generic) | |
| Pink/Red | Electrolysis | Water and electricity from nuclear source | |
| Green | Electrolysis (+biomass *) | Water and electricity from renewable sources/biomass * |
2. Hydrogen Production
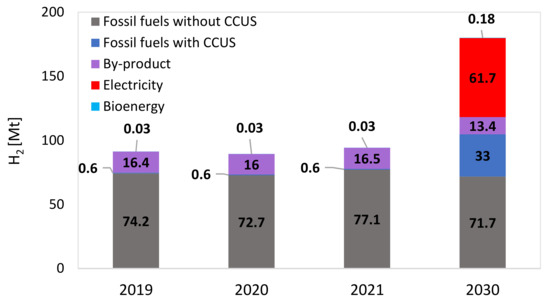
The water electrolysis process to produce hydrogen and oxygen has been known for two centuries, with the advantage of producing extremely pure hydrogen and a relatively straightforward process based on electricity consumption as energy input. Most applications have been limited to small-scale and unique situations in which access to large-scale fossil fuel-based hydrogen production plants—which dominate today’s production, as reported in Figure 1—was not possible or not justified (e.g., electronic industry, food industries as well as medical applications) [11]. Recent developments towards a lower cost of electrolyzers and the perspective availability of low-cost renewable electricity are making their application more attractive. The electrolysis processes can be grouped based on the electrolyte, which may feature different pH (alkaline and acid) or physical state (liquid or solid) [12]. In the following, the 4 most common types of electrolyzers proposed for hydrogen production are shortly explained.-
Alkaline
-
Proton-exchange membrane
| Location (Insolation [kWh/m2 year]) | Italy (1250) | 1250–2200 |
| PV system lifetime [years] | 30 | 15–30 |
-
Solid oxide electrolyzer cells
-
Anion-exchange membrane
3. Electricity Source—Photovoltaic
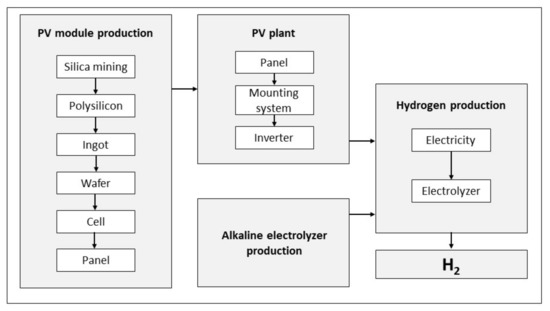
Utility-scale photovoltaic (PV) plants include modules, mounting systems, inverters, transformers, cables, electrical protection systems, measurement equipment, and system monitoring [33]. The PV modules produce direct current electricity using solar irradiance and then convert it into alternating current in an inverter for further applications. Crystalline silicon PV panels production starts with silica mining, carbothermic/quartz reduction (removing oxygen from silica), metallurgical-grade silicon (MG-Si) purification, solar-grade (SOG) silicon construction, silicon ingot crystallization, wafer slicing, PV module assembly and finishes with module and laminate construction [34]. The silicon ore is reduced to metallurgical-grade silicon with silicon purity of around 99% via the use of carbon in a large arc furnace [35]. Metallurgical-grade silicon is further refined to 99.999% purity using the modified Siemens process, which is more advanced and less energy-consuming than the original Siemens process [36]. To produce high-purity silicon, the modified Siemens process consumes a considerable amount of energy due to the operation of the reaction chamber at a high working temperature (typically between 1100 °C and 1200 °C) [37], while over the last decade, the energy and material efficiency of the Siemens process has improved remarkably [38]. Single-crystalline and multi-crystalline silicon ingots are obtained by crystallization through the Czochralski process and casting of solar-grade silicon, respectively. These ingots are sliced using a multi-wire saw combined with a slurry of cooling liquid and abrasive particles and then treated by subsequent etching with sodium hydroxide (NaOH) and washing with water and sulfuric acid (H2SO4) [36]. PV cells are produced via different steps, surface preparation, dopant diffusion, junction formation, and coating, in which some materials like electric pole printing ribbons, nitrogen, oxygen, and argon are used [35]. Finally, solar cells are connected into a string and then encapsulated by two layers of glass and plastics (ethylene-vinyl acetate) to form the PV module [37].4. Life-Cycle Assessment
The process-based life-cycle assessment (LCA) method is considered one of the most analytical methods to evaluate the environmental profile of products (goods and services), such as hydrogen. Since then, numerous directives, communications, and recommendations of the European Commission have been referred to LCA. The LCA is an internationally recognized method according to the principles defined in ISO 14040 and 14044 [39,40]. Italy is one of the 6 European countries with an annual renewable electricity potential capacity higher than 600 TWh [42]. The outcomes were calculated using SimaPro 9.4 software [43], the ecoinvent 3.5 library cut-off method as the Life Cycle Inventory database [| Annual specific yield [kWh/kW |
| p] |
| Parameter | Description | |||
|---|---|---|---|---|
| PV system lifetime [years] | 30 | |||
| Annual specific yield—Italy [kWh/kWp] | 1376 [48] | |||
| 1033 | ||||
| Annual specific yield—Terna, Italy [kWh/kWp] | 1114 | Module types | Single-Si, Multi-Si | |
| Annual specific yield—Terna, Lombardy [kWh/kWp] | 952 | Module efficiencies | 14%, 13% | |
| Annual specific yield—Terna, Lazio [kWh/kW | ||||
| p] | 1189 | PV system installation | Ground-mounted * | |
| Annual specific yield—Terna, Sicily [kWh/kWp] | 1242 | Electrolyzer type | Alkaline | |
| Module types | Single-Si, Multi-Si | Electrolyzer lifetime [hours] | 80,000 | 30,000–80,000 |
| Module efficiency | 20% [51], 18% [48] | Electrolyzer capacity [MW] | 6 | |
| Electrolyzer specific consumption [kWhel/kg H2] | 50 | 50–65 |
| PV system installation |
| Ground-mounted |
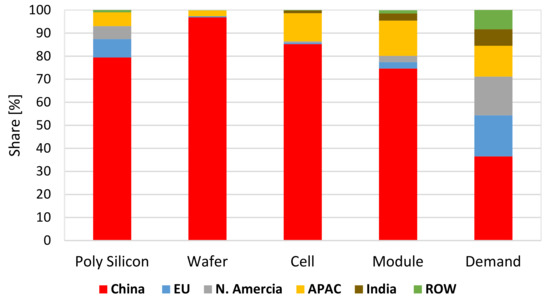
5. Photovoltaic Module Supply Chain
6. Literature Review Results
Among the 22 studies, 50% used different versions of the ecoinvent as a background database [59,68,70,73,76,78,79,81–84]. In five articles, the background data are not introduced [55,56,63,74,80]. Only one study is based on Gabi [66], while another used both Gabi and ecoinvent [85]. Similarly, one study used the GEMIS database [53], while another one is based on both GEMIS and GREET [64]. Also, only one study used the Japanese IDEA database [71]. Lombardi et al. [62] reported SimaPro as a database, whereas SimaPro is a software. Figure 5a shows the library distribution used.
The Life Cycle Inventory or foreground data can play an important role in LCA. The majority of the reviewed studies (80%) are based on available data from literature or reports (secondary data) [55,56,59,63,66,68,70,71,73,74,76,78,79,81–85]. Only two of the studies reported that partially they had access to some primary data [62,80]. The remaining two studies did not reveal their inventory data [53,64]. The distribution of LCI is indicated in Figure 5b.
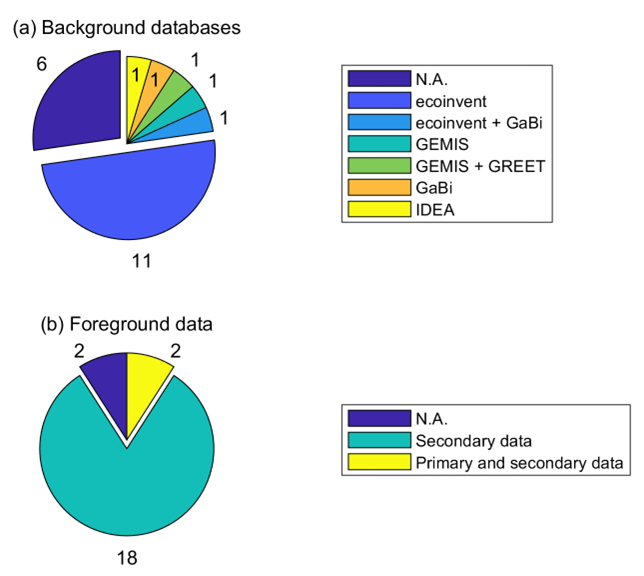
Figure 5. Distribution of (a) background databases and (b) foreground data.
The main component of a solar PV system is the module. Among the reviewed studies, 40% did not mention the solar PV panel type considered in their work [53,59,64,66,68,70,71,83,85]. Multi-Si PV modules are assumed in 9 (40%) of the articles [62,73,76,78–82,84], while only one paper considered single-Si panels [74]. Three of the studies are based on thin-film panels [55,56,63]. The module efficiency is an important factor related to the nominal power of the panel and its area. Higher panel efficiency means a lower area is needed to reach a specific power output.
Some studies did not specify the panel efficiency. In 10 studies, the panel efficiency was reported or it could be realized. Figure 6 Figure 6 shows the trend of PV modules’ efficiency (left axis) and the corresponding GWP values for each kg of H2 (right axis) with respect to the year of the publication. The panel efficiency has increased over time; however, in the case of using the default version of ecoinvent, the increase in efficiency is not applied. The studies [55,56,63] used thin-film PV panels with an efficiency of around 5% according to the reference they have used, i.e., Meier 2002 [57]. The multi-Si panels considered in [62,73] have an efficiency of 12.7% and 14.2%, respectively. The single-Si modules used by Sadeghi et al. [74] are 16% efficient. The solar PV farm by Palmer et al. [78] is based on multi-Si panels with 16.8% efficiency. Some studies are based on ecoinvent without any further changes for open-ground multi-Si solar plants [76,79,82]. Therefore, they are based on modules with 13% efficiency. The average efficiency of the panels considered in the related literature is only 12.95%. As shown in Figure 6, the GWP value (orange line) does not necessarily decrease with the increase in module efficiency (blue line). Two points can explain this non-trivial behavior. Firstly, the location of the PV site is an important factor in the GWP value of PV-based H2. For example, the value of 4.6 kg CO2 eq./kg H2 shown for multi-Si in 2022 is the average GWP of 6 values for five different locations (Spain = 3.8 kg CO2 eq./kg H2 and Germany = 5.65 kg CO2 eq./kg H2). Secondly, the quality of the LCA analysis depends on the data quality and transparency, which can significantly affect the climate footprint and lead to inconsistency in the result.
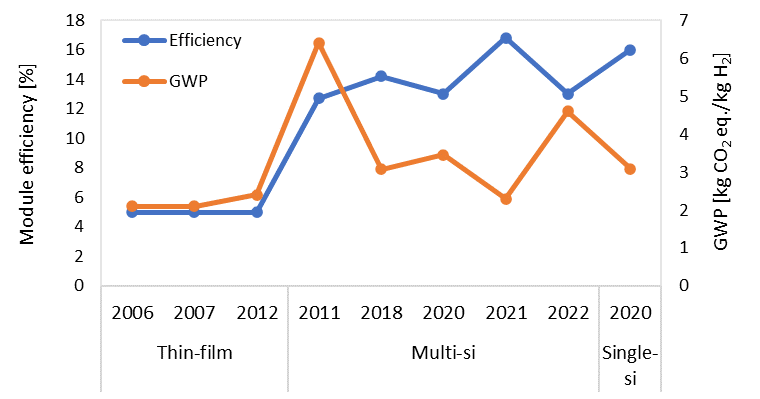
Figure 6. Efficiency and type of the modules and corresponding GWP value of the produced H2 with respect to the year of publication.
The GWP values for producing 1 kg of H2 via electrolysis systems powered by PV, extracted from 21 studies, are divided into two groups: Europe and the rest of the world. Among the 22 studies reviewed, only the work of Suleman et al. [68] is excluded since their GWP value (0.37 kg CO2 eq./kg H2) is relatively low and is not comparable with other studies. Their electrolytic cell co-produces chlorine and caustic soda in addition to H2, resulting in very low GWP values due to: (i) a different electrolysis system compared to the more common alkaline and PEM electrolyzers and (ii) the allocation approach used, which the authors do not specify.
The GWP values are plotted in Figure 7, providing statistical information (i.e., mean, standard deviations, 25th and 75th percentiles). The first column represents 16 GWP values for PV-based H2 production in Europe. The values fluctuate from 3 to 6.4 kg CO2 eq./kg H2, where the mean is 4.83 kg CO2 eq./kg H2 with a standard deviation equal to 1.05 kg CO2 eq./kg H2. The second column is based on seven studies located outside of Europe (rest of the world), in which exist values as low as 2.1 kg CO2 eq./kg H2 and as high as 9.37 kg CO2 eq./kg H2. The PV-based H2 GWP values for the rest of the world show a mean equal to 3.82 with a standard deviation of 2.17 kg CO2 eq./kg H2. Comparing the two columns suggests that GWP values for the production of H2 via electrolysis powered by PV systems in Europe might be higher with respect to production sites outside of this continent. According to the variation of GWP results in the literature, it can be noted that comparing or interpreting the carbon footprint or, in general, the environmental profile of the PV-based H2 is not trivial. On the one hand, some works’ unclear assumptions or lack of data make comparing the studies even more difficult. On the other hand, different system boundaries and different electrolysis systems can alter environmental footprints. However, this work tried to present the extracted GWP values in a quasi-harmonized manner (in case of possibility compression or liquefaction steps are excluded).
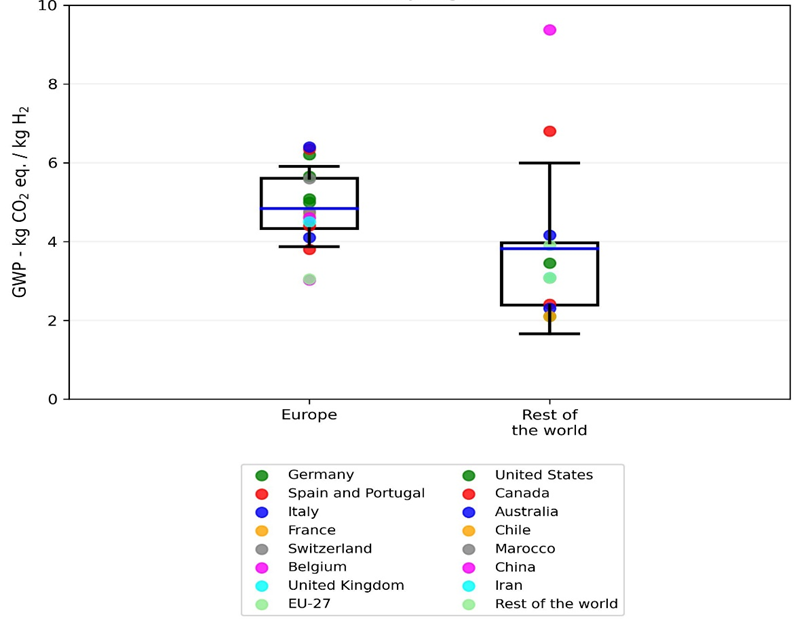
Figure 7. Distribution of GWP values of solar-PV-powered electrolysis system of each kg of H2 from the literature.