In this present study, the influence of isothermal aging temperature and duration on microstructural and mechanical properties of a hot-deformed UNS S32750 Super Duplex Stainless Steel (SDSS) alloy was investigated by SEM-EBSD (Scanning Electron Microscopy-Electron Backscatter Diffraction) and tensile testing techniques. An isothermal aging treatment, at temperatures between (400 - 600)°C and treatment duration between (3 - 120)h, was applied to a commercial UNS S32750 SDSS alloy. Microstructural characteristics of all thermo-mechanical (TM) processed states, such as distribution and morphology of constituent phases, grain’s modal orientation (MO) and, obtained mechanical properties were analysed correlated with the TM processing conditions. Obtained experimental results show that the constituent phases, in all TM processed states, are represented by delta- and gamma-phases. SEM-EBSD analysis revealed microstructural modifications induced by TM processing, showing elongated gamma-phase grains within delta-phase matrix. Within the delta-phase matrix, dynamically recrystallized grains were identified as a result of applying hot deformation and isothermal aging treatments. Also, it was observed that aging treatment parameters can significantly influence the mechanical behaviour exhibited by the UNS S32750 SDSS alloy, in terms of elongation to fracture and absorbed energy during impact testing.
- Super-Duplex Stainless Steel (SDSS)
- gamma-Fe (austenite)
- delta-Fe (ferrite)
- sigma-phase
- microstructure
- mechanical properties
[1][2][3][4][5][6][7][8][9][10][11][12][13][14][15][16][13][17][18][19][20][21][22][23][24][25][26][27][28][29][30][31][32][33][34][35][36][37][38][39][40]
Materials and Methods
The investigated UNS S32750 super duplex stainless steel (SDSS) alloy was thermo-mechanically (TM) processed according to the processing route presented in Figure 1. The as-received (AR) UNS S32750 alloy was hot deformed by rolling (hot-rolled—HR), at a temperature of 1100 °C, using six rolling steps, up to a total deformation degree (thickness reduction) of approximately ε
total≈ 65%. For each rolling step, a constant deformation degree (ε
partial ≈ 11%) was used. After each rolling step, the rolled samples were re-heated up to the nominal deformation temperature (1100 °C) in order to perform the next rolling step.≈ 11%) was used. After each rolling step, the rolled samples were re-heated up to the nominal deformation temperature (1100 °C) in order to perform the next rolling step.
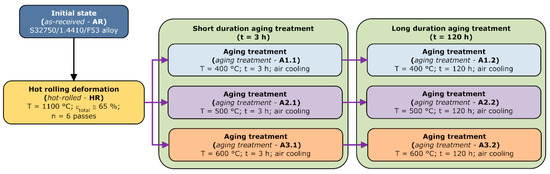 Figure 1. Schematic representation of the applied thermomechanical processing route.
 Schematic representation of the applied thermomechanical processing route.
After hot rolling, the samples were aged using different temperatures and durations. The first set of samples was subjected to
Schematic representation of the applied thermomechanical processing route.
After hot rolling, the samples were aged using different temperatures and durations. The first set of samples was subjected to
short-duration aging treatments, at the following temperatures: 400 °C (
aging treatment-A1.1), 500 °C (
aging treatment-A2.1), and 600 °C (
aging treatment-A3.1), with a duration of 3 h (180 min). The second set of samples was subjected to
long-duration aging treatments, at the following temperatures: 400 °C (
aging treatment-A1.2), 500 °C (
aging treatment-A2.2), and 600 °C (
aging treatment-A3.2), with a duration of 120 h (five days).
All TM processed specimens were investigated from the point of view of microstructural and mechanical properties. Considering the TM processing specific features, the samples´ reference frame, indicated in Figure 2a, assumes the following main directions: ), with a duration of 120 h (five days).
), with a duration of 120 h (five days).
All TM processed specimens were investigated from the point of view of microstructural and mechanical properties. Considering the TM processing specific features, the samples´ reference frame, indicated in Figure 2a, assumes the following main directions:
RD—rolling direction,
TD—transverse direction, and
ND—normal direction. The sample’s microstructure was analysed in the plane defined by the RD–ND directions, while all mechanical properties were analysed along the RD direction (Figure 2b).. The sample’s microstructure was analysed in the plane defined by the RD–ND directions, while all mechanical properties were analysed along the RD direction (Figure 2b).
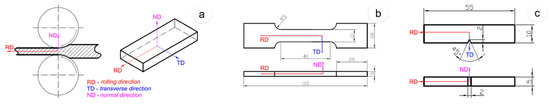 Figure 2.
 Samples reference system (
a), geometrical configuration for tensile testing (
b), and Charpy testing specimens (
c).).
The metallographic preparation procedure applied to all the samples collected from all TM processed states is presented and detailed elsewhere [19,20,21]. The microstructure was investigated by SEM techniques, with the purpose of observing the microstructural constituent phases and the changes occurred during TM processing. A SEM-TESCAN Vega II-XMU (TESCAN, Brno, Czech Republic) microscope was used to perform microstructural analysis.
Microstructural constituent phases and changes occurred during TM processing were analysed using the SEM coupled with a BRUKER Quantax e-Flash EBSD detector. The following parameters were used: 250× magnification, 320 × 240 pixels resolution, 10 ms acquisition time/pixel, 1 × 1 binning size, and less than 3% zero solutions. During the SEM-EBSD analysis, the identified phases were indexed as follows: δ-phase indexed in body-centred cubic (BCC) system, with a lattice parameter of a = 2.86 Å; γ-phase indexed in face-centred cubic (FCC) system, with a lattice parameter of a = 3.66 Å; and R-phase (Fe(Cr)NiMo) indexed in the trigonal system, with a lattice parameter of a = 10.85 Å and c = 19.71 Å. No other secondary phases (i.e., χ-phase, σ-phase, nitrides, carbides) were detected during SEM-EBSD analysis.
All TM processed specimens were also tensile tested in order to determine the following mechanical properties: ultimate tensile strength (σ
Samples reference system (
a), geometrical configuration for tensile testing (
b), and Charpy testing specimens (
c).).
The metallographic preparation procedure applied to all the samples collected from all TM processed states is presented and detailed elsewhere [1][2][3]. The microstructure was investigated by SEM techniques, with the purpose of observing the microstructural constituent phases and the changes occurred during TM processing. A SEM-TESCAN Vega II-XMU (TESCAN, Brno, Czech Republic) microscope was used to perform microstructural analysis.
Microstructural constituent phases and changes occurred during TM processing were analysed using the SEM coupled with a BRUKER Quantax e-Flash EBSD detector. The following parameters were used: 250× magnification, 320 × 240 pixels resolution, 10 ms acquisition time/pixel, 1 × 1 binning size, and less than 3% zero solutions. During the SEM-EBSD analysis, the identified phases were indexed as follows: δ-phase indexed in body-centred cubic (BCC) system, with a lattice parameter of a = 2.86 Å; γ-phase indexed in face-centred cubic (FCC) system, with a lattice parameter of a = 3.66 Å; and R-phase (Fe(Cr)NiMo) indexed in the trigonal system, with a lattice parameter of a = 10.85 Å and c = 19.71 Å. No other secondary phases (i.e., χ-phase, σ-phase, nitrides, carbides) were detected during SEM-EBSD analysis.
All TM processed specimens were also tensile tested in order to determine the following mechanical properties: ultimate tensile strength (σ
UTS), 0.2 yield strength (σ
0.2), and elongation to fracture (ε
f). For tensile testing, the dog-bone shaped samples were used (Figure 2b), with a calibrated section of 40 mm × 10 mm × 3 mm. Further, during testing, a 12.5 mm displacement extensometer was used. Tensile testing measurements were performed using an INSTRON 3382 (INSTRON, Norwood, MA, USA) universal testing equipment. Besides tensile testing, an impact Charpy testing was performed using V-notch 55 mm × 10 mm × 5 mm samples (Figure 2c). The Charpy testing measurements were performed using an INSTRON 450 MPX-v2-J1 (INSTRON, Norwood, MA, USA) testing equipment. In order to compute the average values for all investigated mechanical properties, the following procedure was applied: for each TM processed specimen, six arbitrary samples were tested in identical conditions; computed data were statistically analysed and the standard deviation was determined for each investigated mechanical property. All data were rounded to the nearest whole number, in MPa and J (for strength and impact properties), while the elongation was rounded to 0.5% (i.e., according to EN 10002-1).). For tensile testing, the dog-bone shaped samples were used (Figure 2b), with a calibrated section of 40 mm × 10 mm × 3 mm. Further, during testing, a 12.5 mm displacement extensometer was used. Tensile testing measurements were performed using an INSTRON 3382 (INSTRON, Norwood, MA, USA) universal testing equipment. Besides tensile testing, an impact Charpy testing was performed using V-notch 55 mm × 10 mm × 5 mm samples (Figure 2c). The Charpy testing measurements were performed using an INSTRON 450 MPX-v2-J1 (INSTRON, Norwood, MA, USA) testing equipment. In order to compute the average values for all investigated mechanical properties, the following procedure was applied: for each TM processed specimen, six arbitrary samples were tested in identical conditions; computed data were statistically analysed and the standard deviation was determined for each investigated mechanical property. All data were rounded to the nearest whole number, in MPa and J (for strength and impact properties), while the elongation was rounded to 0.5% (i.e., according to EN 10002-1).
Results
Microstructural Evolution During TM Processing of UNS S32750 SDSS Alloy
Figure 3a shows the SEM-EBSD image of phase map distribution for the UNS S32750 SDSS alloy in the as-received (AR) state. One can observe that the identified phases were as follows: δ-phase (coloured in blue) and γ-phase (coloured in red). One can also observe that the γ-phase presents an islands-like morphology within the δ-phase matrix. On the basis of SEM-EBSD analysis, the constituent phase ratio was computed. The computation algorithm assumed 10 measurements of 403.4 × 403.4 (μm × μm) fields and statistical analysis of obtained phase ratios. It was determined that the F53 SDSS alloy in AR condition showed the presence of 49.1% ± 2.3% δ-phase and 50.9% ± 2.1% γ-phase. Figure 3b shows the grains’ orientation distribution for both the δ-phase and γ-phase. A closer look at the γ-phase grains’ orientation distribution shows the presence of annealing twins. Similar observations were also made by other researchers, showing that the annealing twins belong to the {111} <112> system [22,23,24].
Figure 3a shows the SEM-EBSD image of phase map distribution for the UNS S32750 SDSS alloy in the as-received (AR) state. One can observe that the identified phases were as follows: δ-phase (coloured in blue) and γ-phase (coloured in red). One can also observe that the γ-phase presents an islands-like morphology within the δ-phase matrix. On the basis of SEM-EBSD analysis, the constituent phase ratio was computed. The computation algorithm assumed 10 measurements of 403.4 × 403.4 (μm × μm) fields and statistical analysis of obtained phase ratios. It was determined that the F53 SDSS alloy in AR condition showed the presence of 49.1% ± 2.3% δ-phase and 50.9% ± 2.1% γ-phase. Figure 3b shows the grains’ orientation distribution for both the δ-phase and γ-phase. A closer look at the γ-phase grains’ orientation distribution shows the presence of annealing twins. Similar observations were also made by other researchers, showing that the annealing twins belong to the {111} <112> system [4][5][6].
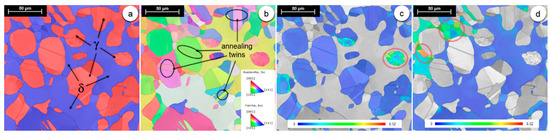 Figure 3.
 Distribution map of the γ- and δ-phases (
a), inverse pole figure (IPF) (
b), grain reference orientation deviation (GROD) map of γ-phase (
c) and δ-phase (
d) for the
as-received (
AR) state.) state.
The grain reference orientation deviation (GROD) map can be used as a visualisation tool to assess the accumulated deformation/strain at microstructural level [25,26]. GROD is based on the misorientation (MO) between a reference point of that grain and the other points. The reference point can be the mean orientation of the grain or the point of the grain where the KAM (kernel average misorientation) is the lowest [27,28]. In the present work, the GROD map provides the orientation field referenced to a fixed point, which is the mean orientation of the grain. As shown, the GROD map shows grains exhibiting deviations from the average grain orientation, deviations due to accumulated strain resulting as a consequence of, firstly, grains’ deformations by slip/twinning and/or rotations and, secondly, other induced strain hardening effects during applied TM processing. Figure 3c,d show the GROD maps for the γ-phase and δ-phase, respectively. One can observe that the maximum MO reaches a value close to 6.52° and is recorded in the case of the δ-phase (Figure 3d). The γ-phase shows grains with a level of accumulated strain inferior to δ-phase, and in both phases, the maximum level of MO is recorded in small-size grains (Figure 3c,d).
The grain reference orientation deviation (GROD) map can be used as a visualisation tool to assess the accumulated deformation/strain at microstructural level [7][8]. GROD is based on the misorientation (MO) between a reference point of that grain and the other points. The reference point can be the mean orientation of the grain or the point of the grain where the KAM (kernel average misorientation) is the lowest [9][10]. In the present work, the GROD map provides the orientation field referenced to a fixed point, which is the mean orientation of the grain. As shown, the GROD map shows grains exhibiting deviations from the average grain orientation, deviations due to accumulated strain resulting as a consequence of, firstly, grains’ deformations by slip/twinning and/or rotations and, secondly, other induced strain hardening effects during applied TM processing. Figure 3c,d show the GROD maps for the γ-phase and δ-phase, respectively. One can observe that the maximum MO reaches a value close to 6.52° and is recorded in the case of the δ-phase (Figure 3d). The γ-phase shows grains with a level of accumulated strain inferior to δ-phase, and in both phases, the maximum level of MO is recorded in small-size grains (Figure 3c,d).
Figure 4a shows the phase map distribution for the hot-rolled (HR) state. The microstructure consists of the δ-phase (coloured in blue) and γ-phase (coloured in red). It can be observed that the γ-phase shows a modified morphology, from an islands-like to a typical roll-deformed one, with high-elongated grains, along the RD direction, within the δ-phase matrix. Analysing the grains’ orientation distribution for both the δ-phase and γ-phase (Figure 4b), one can observe that the γ-phase grains accommodate better induced intense deformation, during the hot-deformation processing, when compared with the δ-phase grains and, furthermore, the observed annealing γ-phase twins show signs of deformation. Figure 4c,d show the GROD maps for the γ-phase and δ-phase, respectively. One can observe that the maximum MO reaches a value close to 31.62° (an increase of approximately 485%, compared with the AR state) and is recorded in the case of the δ-phase (Figure 4d). Besides intensely deformed grains, the δ-phase shows the presence of new dynamically recrystallized grains, which show uniform GROD distribution, with an average MO close to 0°, and an average grain-size close to 30 μm (Figure 4d). No new dynamically recrystallized grains were observed in the case of the γ-phase.
Figure 4a shows the phase map distribution for the hot-rolled (HR) state. The microstructure consists of the δ-phase (coloured in blue) and γ-phase (coloured in red). It can be observed that the γ-phase shows a modified morphology, from an islands-like to a typical roll-deformed one, with high-elongated grains, along the RD direction, within the δ-phase matrix. Analysing the grains’ orientation distribution for both the δ-phase and γ-phase (Figure 4b), one can observe that the γ-phase grains accommodate better induced intense deformation, during the hot-deformation processing, when compared with the δ-phase grains and, furthermore, the observed annealing γ-phase twins show signs of deformation. Figure 4c,d show the GROD maps for the γ-phase and δ-phase, respectively. One can observe that the maximum MO reaches a value close to 31.62° (an increase of approximately 485%, compared with the AR state) and is recorded in the case of the δ-phase (Figure 4d). Besides intensely deformed grains, the δ-phase shows the presence of new dynamically recrystallized grains, which show uniform GROD distribution, with an average MO close to 0°, and an average grain-size close to 30 μm (Figure 4d). No new dynamically recrystallized grains were observed in the case of the γ-phase.
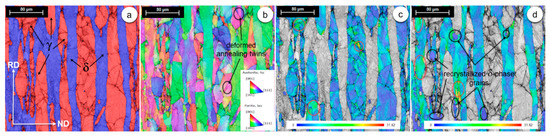 Figure 4.
 Distribution maps of both the γ- and δ-phases (
a), inverse pole figure (IPF) (
b), GROD map of the γ-phase (
c) and δ-phase (
d) for the
hot-rolled (
HR) state.) state.
In all aging treatments states, short-duration aging treatments—A1.1, A2.1, and A3.1 states—and long-duration aging treatments—A1.2, A2.2, and A3.2 states—the observed morphology of both the δ-phase and γ-phase shows the same typical roll-deformed features, with highly-elongated, along the RD direction, γ-phase grains within the δ-phase matrix (Figure 5a,e, Figure 6a,e, Figure 7a,e). Only in the case of long-duration aging treatment A2.3, besides the δ-phase and γ-phase, a precipitated secondary phase was detected, namely the R-phase (Fe(Cr)NiMo) (Figure 7e), showing a fine and almost uniform distribution within the δ-phase matrix. The computed R-phase weight fraction, based on EBSD data, is situated close to 6.5%. In all cases, grains’ orientation distribution, for the δ-phase and γ-phase, shows that the γ-phase grains accommodate better the intense deformation compared with the δ-phase grains and the annealing γ-phase twins are still present (Figure 5b,f, Figure 6b,f, Figure 7b,f). Significant differences were observed in the case of GROD maps. One can see that the maximum GROD decreases continuously with the increasing aging treatment temperature and duration. In all cases, the maximum MO is recorded for the δ-phase. In the case of short-duration aging treatment states, the maximum MO continuously decreases to 20.40° for the A1.1 state (Figure 5d) (a decrease of approximately 35.5% compared with the HR state), to 17.80° for the A2.1 state (Figure 6d) (a decrease of approximately 43.7% compared with the HR state), and finally to 15.11° for the A3.1 state (Figure 7d) (a decrease of approximately 52.2% compared with the HR state). Analysing the case of long-duration aging treatment states, it can be observed that the GROD maps suffers further decreasing owing to increased treatment duration (120 h). Recorded maximum MO values are continuously decreasing, to 18.50° for the A1.2 state (Figure 5h) (a decrease of approximately 9.3% compared with the A1.1 state), to 16.20° for the A2.2 state (Figure 6h) (a decrease of approximately 8.9% compared with the A2.1 state), and finally to 13.8° for the A3.2 state (Figure 7h) (a decrease of approximately 8.6% compared with the A3.1 state). The observed decrease suggests that an important effect induced by the aging treatments is represented by the stress relieving phenomena within the microstructure. The main characteristics of stress relieving are represented by the removal of unwanted effects induced by plastic deformation. Owing to stress relieving, the crystal imperfections density and high elastic strains and residual stress fields can be significantly lowered, improving the material’s exhibited properties.
In all aging treatments states, short-duration aging treatments—A1.1, A2.1, and A3.1 states—and long-duration aging treatments—A1.2, A2.2, and A3.2 states—the observed morphology of both the δ-phase and γ-phase shows the same typical roll-deformed features, with highly-elongated, along the RD direction, γ-phase grains within the δ-phase matrix (Figure 5a,e, Figure 6a,e, Figure 7a,e). Only in the case of long-duration aging treatment A2.3, besides the δ-phase and γ-phase, a precipitated secondary phase was detected, namely the R-phase (Fe(Cr)NiMo) (Figure 7e), showing a fine and almost uniform distribution within the δ-phase matrix. The computed R-phase weight fraction, based on EBSD data, is situated close to 6.5%. In all cases, grains’ orientation distribution, for the δ-phase and γ-phase, shows that the γ-phase grains accommodate better the intense deformation compared with the δ-phase grains and the annealing γ-phase twins are still present (Figure 5b,f, Figure 6b,f, Figure 7b,f). Significant differences were observed in the case of GROD maps. One can see that the maximum GROD decreases continuously with the increasing aging treatment temperature and duration. In all cases, the maximum MO is recorded for the δ-phase. In the case of short-duration aging treatment states, the maximum MO continuously decreases to 20.40° for the A1.1 state (Figure 5d) (a decrease of approximately 35.5% compared with the HR state), to 17.80° for the A2.1 state (Figure 6d) (a decrease of approximately 43.7% compared with the HR state), and finally to 15.11° for the A3.1 state (Figure 7d) (a decrease of approximately 52.2% compared with the HR state). Analysing the case of long-duration aging treatment states, it can be observed that the GROD maps suffers further decreasing owing to increased treatment duration (120 h). Recorded maximum MO values are continuously decreasing, to 18.50° for the A1.2 state (Figure 5h) (a decrease of approximately 9.3% compared with the A1.1 state), to 16.20° for the A2.2 state (Figure 6h) (a decrease of approximately 8.9% compared with the A2.1 state), and finally to 13.8° for the A3.2 state (Figure 7h) (a decrease of approximately 8.6% compared with the A3.1 state). The observed decrease suggests that an important effect induced by the aging treatments is represented by the stress relieving phenomena within the microstructure. The main characteristics of stress relieving are represented by the removal of unwanted effects induced by plastic deformation. Owing to stress relieving, the crystal imperfections density and high elastic strains and residual stress fields can be significantly lowered, improving the material’s exhibited properties.
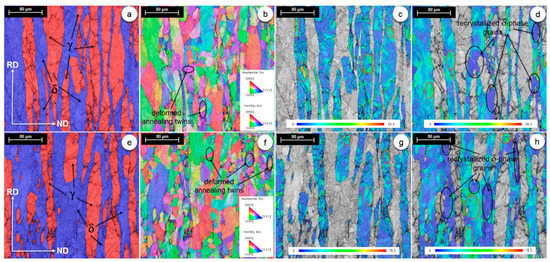 Figure 5.
 Distribution maps of both the γ- and δ-phases (
a), inverse pole figure (IPF) (
b), GROD map of the γ-phase (
c) and δ-phase (
d) for the
short-duration aging treatment (
A1.1) state; distribution maps of both the γ- and δ-phases (
e), inverse pole figure (IPF) (
f), GROD map of the γ-phase (
g) and δ-phase (
h) for the
long-duration aging treatment (
A1.2) state.) state.
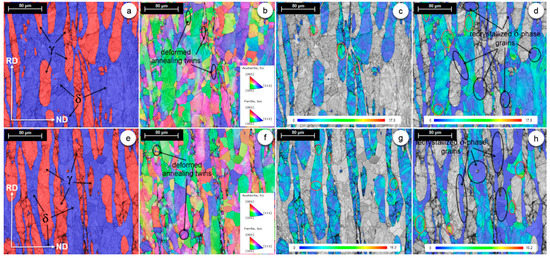 Figure 6.
 Distribution maps of both the γ- and δ-phases (
a), inverse pole figure (IPF) (
b), GROD map of the γ-phase (
c) and δ-phase (
d) for the
short-duration aging treatment (
A2.1) state; distribution maps of both the γ- and δ-phases (
e), inverse pole figure (IPF) (
f), GROD map of the γ-phase (
g) and δ-phase (
h) for the
long-duration aging treatment (
A2.2) state.
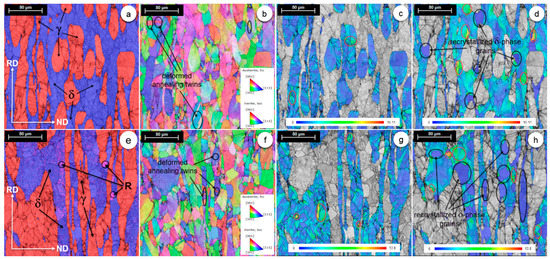 Figure 7.
 Distribution maps of both the γ- and δ-phases (
a), inverse pole figure (IPF) (
b), GROD map of the γ-phase (
c) and δ-phase (
d) for the
short-duration aging treatment (
A3.1) state; distribution maps of both the γ- and δ-phases (
e), inverse pole figure (IPF) (
f), GROD map of the γ-phase (
g) and δ-phase (
h) for the
long-duration aging treatment (
A3.2) state.
) state.
In both short-duration aging treatment and long-duration aging treatment states, one can observe the presence of new, dynamically recrystallized δ-phase grains. If one compares the observed number of recrystallized δ-phase grains in the case of HR (Figure 4d) with ones obtained after aging performed at 400 °C for 3 h (A1.1 state—Figure 5d) and 120 h (A1.2 state—Figure 5h), they will notice that the highest number of recrystallized δ-phase grains is observed in the case of the A1.2 state, followed by the A1.1 state, and finally the HR state, suggesting that the aging treatment duration influences the recrystallization of new δ-phase grains. Similar observations can also be made in the case of aging performed at 500 °C for 3 h (A2.1 state—Figure 6d) and 120 h (A2.2 state—Figure 6h), and in the case of aging performed at 600 °C for 3 h (A3.1 state—Figure 7d) and 120 h (A3.2 state—Figure 7h). Generally, an intensely deformed phase behaves better as the number of new recrystallized grains, from the parent phase, is increasing (i.e., if one considers δ-phase ductility, it is expected that a higher ductility will be obtained as the number of recrystallized grains is increasing).
In both short-duration aging treatment and long-duration aging treatment states, one can observe the presence of new, dynamically recrystallized δ-phase grains. If one compares the observed number of recrystallized δ-phase grains in the case of HR (Figure 4d) with ones obtained after aging performed at 400 °C for 3 h (A1.1 state—Figure 5d) and 120 h (A1.2 state—Figure 5h), they will notice that the highest number of recrystallized δ-phase grains is observed in the case of the A1.2 state, followed by the A1.1 state, and finally the HR state, suggesting that the aging treatment duration influences the recrystallization of new δ-phase grains. Similar observations can also be made in the case of aging performed at 500 °C for 3 h (A2.1 state—Figure 6d) and 120 h (A2.2 state—Figure 6h), and in the case of aging performed at 600 °C for 3 h (A3.1 state—Figure 7d) and 120 h (A3.2 state—Figure 7h). Generally, an intensely deformed phase behaves better as the number of new recrystallized grains, from the parent phase, is increasing (i.e., if one considers δ-phase ductility, it is expected that a higher ductility will be obtained as the number of recrystallized grains is increasing).
The decrease in GROD and the increased number of recrystallized δ-phase grains are proving that aging treatments, at temperatures between 400 and 600 °C and durations between 3 and 120 h, can influence the properties exhibited by the UNS S32750 SDSS alloy.
- Schayes, C.; Bouquerel, J.; Vogt, J.B.; Palleschi, F.; Zaefferer, S. A comparison of EBSD based strain indicators for the study of Fe-3Si steel subjected to cyclic loading. Mater. Charact. 2016, 115, 61–70. [Google Scholar] [CrossRef]
- Kamaya, M. Characterization of microstructural damage due to low-cycle-fatigue by EBSD observation. Mater. Charact. 2009, 160, 1454–1462. [Google Scholar] [CrossRef]
- Wright, S.I.; Nowell, M.M.; Field, D.P. A review of strain analysis using electron backscatter diffraction. Microsc. Microanal. 2011, 17, 316–329. [Google Scholar] [CrossRef]
- Kamaya, M. Assessment of local deformation using EBSD: Quantification of local damage at grain boundaries. Mater. Charact. 2012, 66, 56–67. [Google Scholar] [CrossRef]
The decrease in GROD and the increased number of recrystallized δ-phase grains are proving that aging treatments, at temperatures between 400 and 600 °C and durations between 3 and 120 h, can influence the properties exhibited by the UNS S32750 SDSS alloy.
Microstructural Evolution During TM Processing of UNS S32750 SDSS Alloy
Figure 3a shows the SEM-EBSD image of phase map distribution for the UNS S32750 SDSS alloy in the as-received (AR) state. One can observe that the identified phases were as follows: δ-phase (coloured in blue) and γ-phase (coloured in red). One can also observe that the γ-phase presents an islands-like morphology within the δ-phase matrix. On the basis of SEM-EBSD analysis, the constituent phase ratio was computed. The computation algorithm assumed 10 measurements of 403.4 × 403.4 (μm × μm) fields and statistical analysis of obtained phase ratios. It was determined that the F53 SDSS alloy in AR condition showed the presence of 49.1% ± 2.3% δ-phase and 50.9% ± 2.1% γ-phase. Figure 3b shows the grains’ orientation distribution for both the δ-phase and γ-phase. A closer look at the γ-phase grains’ orientation distribution shows the presence of annealing twins. Similar observations were also made by other researchers, showing that the annealing twins belong to the {111} <112> system [4][5][6].
Distribution map of the γ- and δ-phases (
a), inverse pole figure (IPF) (
b), grain reference orientation deviation (GROD) map of γ-phase (
c) and δ-phase (
d) for the
as-received(
AR) state.) state.
The grain reference orientation deviation (GROD) map can be used as a visualisation tool to assess the accumulated deformation/strain at microstructural level [7][8]. GROD is based on the misorientation (MO) between a reference point of that grain and the other points. The reference point can be the mean orientation of the grain or the point of the grain where the KAM (kernel average misorientation) is the lowest [9][10]. In the present work, the GROD map provides the orientation field referenced to a fixed point, which is the mean orientation of the grain. As shown, the GROD map shows grains exhibiting deviations from the average grain orientation, deviations due to accumulated strain resulting as a consequence of, firstly, grains’ deformations by slip/twinning and/or rotations and, secondly, other induced strain hardening effects during applied TM processing. Figure 3c,d show the GROD maps for the γ-phase and δ-phase, respectively. One can observe that the maximum MO reaches a value close to 6.52° and is recorded in the case of the δ-phase (Figure 3d). The γ-phase shows grains with a level of accumulated strain inferior to δ-phase, and in both phases, the maximum level of MO is recorded in small-size grains (Figure 3c,d).
Figure 4a shows the phase map distribution for the hot-rolled (HR) state. The microstructure consists of the δ-phase (coloured in blue) and γ-phase (coloured in red). It can be observed that the γ-phase shows a modified morphology, from an islands-like to a typical roll-deformed one, with high-elongated grains, along the RD direction, within the δ-phase matrix. Analysing the grains’ orientation distribution for both the δ-phase and γ-phase (Figure 4b), one can observe that the γ-phase grains accommodate better induced intense deformation, during the hot-deformation processing, when compared with the δ-phase grains and, furthermore, the observed annealing γ-phase twins show signs of deformation. Figure 4c,d show the GROD maps for the γ-phase and δ-phase, respectively. One can observe that the maximum MO reaches a value close to 31.62° (an increase of approximately 485%, compared with the AR state) and is recorded in the case of the δ-phase (Figure 4d). Besides intensely deformed grains, the δ-phase shows the presence of new dynamically recrystallized grains, which show uniform GROD distribution, with an average MO close to 0°, and an average grain-size close to 30 μm (Figure 4d). No new dynamically recrystallized grains were observed in the case of the γ-phase.
Distribution maps of both the γ- and δ-phases (
a), inverse pole figure (IPF) (
b), GROD map of the γ-phase (
c) and δ-phase (
d) for the
hot-rolled(
HR) state.) state.
In all aging treatments states, short-duration aging treatments—A1.1, A2.1, and A3.1 states—and long-duration aging treatments—A1.2, A2.2, and A3.2 states—the observed morphology of both the δ-phase and γ-phase shows the same typical roll-deformed features, with highly-elongated, along the RD direction, γ-phase grains within the δ-phase matrix (Figure 5a,e, Figure 6a,e, Figure 7a,e). Only in the case of long-duration aging treatment A2.3, besides the δ-phase and γ-phase, a precipitated secondary phase was detected, namely the R-phase (Fe(Cr)NiMo) (Figure 7e), showing a fine and almost uniform distribution within the δ-phase matrix. The computed R-phase weight fraction, based on EBSD data, is situated close to 6.5%. In all cases, grains’ orientation distribution, for the δ-phase and γ-phase, shows that the γ-phase grains accommodate better the intense deformation compared with the δ-phase grains and the annealing γ-phase twins are still present (Figure 5b,f, Figure 6b,f, Figure 7b,f). Significant differences were observed in the case of GROD maps. One can see that the maximum GROD decreases continuously with the increasing aging treatment temperature and duration. In all cases, the maximum MO is recorded for the δ-phase. In the case of short-duration aging treatment states, the maximum MO continuously decreases to 20.40° for the A1.1 state (Figure 5d) (a decrease of approximately 35.5% compared with the HR state), to 17.80° for the A2.1 state (Figure 6d) (a decrease of approximately 43.7% compared with the HR state), and finally to 15.11° for the A3.1 state (Figure 7d) (a decrease of approximately 52.2% compared with the HR state). Analysing the case of long-duration aging treatment states, it can be observed that the GROD maps suffers further decreasing owing to increased treatment duration (120 h). Recorded maximum MO values are continuously decreasing, to 18.50° for the A1.2 state (Figure 5h) (a decrease of approximately 9.3% compared with the A1.1 state), to 16.20° for the A2.2 state (Figure 6h) (a decrease of approximately 8.9% compared with the A2.1 state), and finally to 13.8° for the A3.2 state (Figure 7h) (a decrease of approximately 8.6% compared with the A3.1 state). The observed decrease suggests that an important effect induced by the aging treatments is represented by the stress relieving phenomena within the microstructure. The main characteristics of stress relieving are represented by the removal of unwanted effects induced by plastic deformation. Owing to stress relieving, the crystal imperfections density and high elastic strains and residual stress fields can be significantly lowered, improving the material’s exhibited properties.
Distribution maps of both the γ- and δ-phases (
a), inverse pole figure (IPF) (
b), GROD map of the γ-phase (
c) and δ-phase (
d) for the
short-duration aging treatment(
A1.1) state; distribution maps of both the γ- and δ-phases (
e), inverse pole figure (IPF) (
f), GROD map of the γ-phase (
g) and δ-phase (
h) for the
long-duration aging treatment(
A1.2) state.) state.
Distribution maps of both the γ- and δ-phases (
), inverse pole figure (IPF) (
), GROD map of the γ-phase (
) and δ-phase (
) for the
(
) state; distribution maps of both the γ- and δ-phases (
), inverse pole figure (IPF) (
), GROD map of the γ-phase (
) and δ-phase (
) for the
(
) state.
Distribution maps of both the γ- and δ-phases (
a), inverse pole figure (IPF) (
b), GROD map of the γ-phase (
c) and δ-phase (
d) for the
short-duration aging treatment(
A3.1) state; distribution maps of both the γ- and δ-phases (
e), inverse pole figure (IPF) (
f), GROD map of the γ-phase (
g) and δ-phase (
h) for the
long-duration aging treatment(
A3.2) state.) state.
In both short-duration aging treatment and long-duration aging treatment states, one can observe the presence of new, dynamically recrystallized δ-phase grains. If one compares the observed number of recrystallized δ-phase grains in the case of HR (Figure 4d) with ones obtained after aging performed at 400 °C for 3 h (A1.1 state—Figure 5d) and 120 h (A1.2 state—Figure 5h), they will notice that the highest number of recrystallized δ-phase grains is observed in the case of the A1.2 state, followed by the A1.1 state, and finally the HR state, suggesting that the aging treatment duration influences the recrystallization of new δ-phase grains. Similar observations can also be made in the case of aging performed at 500 °C for 3 h (A2.1 state—Figure 6d) and 120 h (A2.2 state—Figure 6h), and in the case of aging performed at 600 °C for 3 h (A3.1 state—Figure 7d) and 120 h (A3.2 state—Figure 7h). Generally, an intensely deformed phase behaves better as the number of new recrystallized grains, from the parent phase, is increasing (i.e., if one considers δ-phase ductility, it is expected that a higher ductility will be obtained as the number of recrystallized grains is increasing).
- Schayes, C.; Bouquerel, J.; Vogt, J.B.; Palleschi, F.; Zaefferer, S. A comparison of EBSD based strain indicators for the study of Fe-3Si steel subjected to cyclic loading. Mater. Charact. 2016, 115, 61–70. [Google Scholar] [CrossRef]
- Kamaya, M. Characterization of microstructural damage due to low-cycle-fatigue by EBSD observation. Mater. Charact. 2009, 160, 1454–1462. [Google Scholar] [CrossRef]
- Wright, S.I.; Nowell, M.M.; Field, D.P. A review of strain analysis using electron backscatter diffraction. Microsc. Microanal. 2011, 17, 316–329. [Google Scholar] [CrossRef]
- Kamaya, M. Assessment of local deformation using EBSD: Quantification of local damage at grain boundaries. Mater. Charact. 2012, 66, 56–67. [Google Scholar] [CrossRef]
The decrease in GROD and the increased number of recrystallized δ-phase grains are proving that aging treatments, at temperatures between 400 and 600 °C and durations between 3 and 120 h, can influence the properties exhibited by the UNS S32750 SDSS alloy.
References
- Leif Karlsson; Welding duplex and super duplex stainless steels. Anti-Corrosion Methods and Materials 1995, 42, 30-35, 10.1108/eb007380.Cerenis Therapeutics, S. Cer-001 Therapy as a Novel Approach to Treat Genetic Orphan Diseases (TANGO). Available online: ClinicalTrials.gov/ct2/show/NCT02697136 (accessed on 11 February 2019).
- A. Weisbrodt-Reisch; M. Brummer; B. Hadler; B. Wolbank; E.A. Werner; Influence of temperature, cold deformation and a constant mechanical load on the microstructural stability of a nitrogen alloyed duplex stainless steel. MDavid O. Osei-Hwedieh; Marcelo Amar; Dmitri Sviridov; Alan T Remaley; Apolipoprotein mimetic peptides: Mechanisms of action as anti-atherogenic agents. Phaterials Science and Engineering: A macology & Therapeutics 20106, 4, 16, 1-10, 10.1016/j.msea.2005.09.117.30, 83-91, 10.1016/j.pharmthera.2010.12.003.
- Bhadeshia, H.K.D.H.; Honeycombe, R. 12 - Stainless Steel. In Steels - Microstructure and Properties (Third Edition); Butterworth-Heinemann: Oxford, UK, 2006; 259-286.Shuo Yang; Marina G. Damiano; Heng Zhang; Sushant Tripathy; Andrea J. Luthi; Jonathan S. Rink; Andrey V. Ugolkov; Amareshwar T. K. Singh; Sandeep S. Dave; Leo I. Gordon; Chad A. Mirkin; Biomimetic, synthetic HDL nanostructures for lymphoma. Proceedings of the National Academy of Sciences 2013, 110, 2511-2516, 10.1073/pnas.1213657110.
- H. Luo; Chaofang Dong; K. Xiao; Xiaogang Li; Characterization of passive film on 2205 duplex stainless steel in sodium thiosulphate solution. AppYue Yuan; Jian Wen; Jie Tang; Qiming Kan; Rose Ackermann; Karl Olsen; Anna Schwendeman; Synthetic high-density lipoproteins for delivery of 10-hydroxycamptothecin. Internationalied Surface SciencJournal of Nanomedicine 2011, 258, 631-639, 10.1016/j.apsusc.2011.06.077.6, 11, 6229, 10.2147/IJN.S112835.
- Jianyu Xiong; Mike Yongjun Tan; Maria Forsyth; The corrosion behaviors of stainless steel weldments in sodium chloride solution observed using a novel electrochemical measurement approach. DChitra Subramanian; Rui Kuai; Qing Zhu; Peter White; James J. Moon; Anna Schwendeman; Mark S. Cohen; Synthetic high-density lipoprotein nanoparticles: A novel therapeutic strategy for adrenocortical carcinomas.. Surgesalination ry 2013, 327, 39-45, 10.1016/j.desal.2013.08.006.6, 159, 284-294, 10.1016/j.surg.2015.08.023.
- Mohammad Yousefieh; Morteza Shamanian; A. Saatchi; Optimization of the pulsed current gas tungsten arc welding (PCGTAW) parameters for corrosion resistance of super duplex stainless steel (UNS S32760) welds using the Taguchi method. Rui Kuai; Chitra Subramanian; Peter T White; Barbara N Timmermann; James J. Moon; Mark S Cohen; Anna Schwendeman; Synthetic high-density lipoprotein nanodisks for targeted withalongolide delivery to adrenocortical carcinoma. International Journal of Alloys Nand Compounds omedicine 2011, 509, 782-788, 10.1016/j.jallcom.2010.09.087.7, 12, 6581, 10.2147/IJN.S140591.
- S.S.M Tavares; V.G. Silva; J.M. Pardal; J.S. Corte; Investigation of stress corrosion cracks in a UNS S32750 superduplex stainless steel. EEmily E. Morin; Xiang-An Li; Anna Schwendeman; HDL in Endocrine Carcinomas: Biomarker, Drug Carrier, and Potential Therapeutic. Frongtineering Failure Analers in Endocrinologysis 2013, 35, 88-94, 10.1016/j.engfailanal.2012.12.013.8, 9, 715, 10.3389/fendo.2018.00715.
- F. Zanotto; V. Grassi; Andrea Balbo; Cecilia Monticelli; F. Zucchi; Stress corrosion cracking of LDX 2101® duplex stainless steel in chloride solutions in the presence of thiosulphate. CoJi Wang; Junting Jia; Jianping Liu; Hongliang He; Wenli Zhang; Zhenghua Li; Tumor targeting effects of a novel modified paclitaxel-loaded discoidal mimic high density lipoproteins. Drrosionug Science Delivery 2014, 83, 20, 205-212, 10.1016/j.corsci.2013.11.028., 356-363, 10.3109/10717544.2013.834418.
- Mats Hättestrand; Petter Larsson; Guocai Chai; Jan-Olof Nilsson; Joakim Odqvist; Study of decomposition of ferrite in a duplex stainless steel cold worked and aged at 450–500°C. MJose Medina-Echeverz; Marcos Vasquez; Celia Gomar; Nuria Ardaiz; Pedro Berraondo; Overexpression of apolipoprotein A-I fused to an anti-transforming growth factor beta peptide modulates the tumorigenicity and immunogenicity of mouse colon cancer cells. Caterials Science and Engineering: A r Immunology, Immunotherapy 2009, 15, 6499, 489-492, 10.1016/j.msea.2008.09.021., 717-725, 10.1007/s00262-015-1681-9.
- Shilei Li; Yanli Wang; Shuxiao Li; Hailong Zhang; Fei Xue; Xitao Wang; Microstructures and mechanical properties of cast austenite stainless steels after long-term thermal aging at low temperature. MateLinda K. Mooberry; Maya Nair; Sulabha Paranjape; Walter J. McConathy; Andras G Lacko; Receptor mediated uptake of paclitaxel from a synthetic high density lipoprotein nanocarrier. Jourinals & Desi of Drug Targetingn 2013, 50, 886-892, 10.1016/j.matdes.2013.02.061.0, 18, 53–58, 10.1080/10611860903156419.
- Gorka Argandoña; Jose Fernandez-Palacio; Carlos Berlanga; María V. Biezma; Pedro Rivero; Julio Peña; Rafael J. Rodríguez; Effect of the Temperature in the Mechanical Properties of Austenite, Ferrite and Sigma Phases of Duplex Stainless Steels Using Hardness, Microhardness and Nanoindentation Techniques. Metals 2017, 7, 219, 10.3390/met7060219.
- P. D. Southwick; R. W. K. Honeycombe; Precipitation of M23C6at austenite/ferrite interfaces in duplex stainless steel. Metal Science 1982, 16, 475-482, 10.1179/msc.1982.16.10.475.
- K. Unnikrishnan; A.K. Mallik; Aging behaviour of a duplex stainless steel. Materials Science and Engineering 1987, 95, 259-265, 10.1016/0025-5416(87)90517-9.
- Lode Duprez; Bruno De Cooman; Nuri Akdut; Microstructure evolution during isothermal annealing of a standard duplex stainless steel type 1.4462. Steel Research 2000, 71, 417-422, 10.1002/srin.200001338.
- Jerzy Nowacki; Aleksander Łukojc; Microstructural transformations of heat affected zones in duplex steel welded joints. Materials Characterization 2006, 56, 436-441, 10.1016/j.matchar.2006.02.007.
- Hae-Woo Lee; Seong Han Bae; Effect of intermetallic precipitation on the properties of multi passed duplex stainless steel weldment. Korean Journal of Metals and Materials 2014, 52, 631-636, 10.3365/KJMM.2014.52.8.631.
- Jean-Yves Maetz; Sophie Cazottes; Catherine Verdu; Xavier Kleber; Precipitation and Phase Transformations in 2101 Lean Duplex Stainless Steel During Isothermal Aging. Metallurgical and Materials Transactions B 2015, 47, 239-253, 10.1007/s11661-015-3215-7.
- A.F. Armas; S. Hereñú; I. Alvarez-Armas; S. Degallaix; A. Condo; F. Lovey; The influence of temperature on the cyclic behavior of aged and unaged super duplex stainless steels. Materials Science and Engineering: A 2008, 491, 434-439, 10.1016/j.msea.2008.02.028.
- Vasile Dănuţ Cojocaru; Nicolae Serban; Mariana Angelescu; Cosmin M. Cotruț; Elisabeta Cojocaru; Adrian Vintila; Influence of Solution Treatment Temperature on Microstructural Properties of an Industrially Forged UNS S32750/1.4410/F53 Super Duplex Stainless Steel (SDSS) Alloy. Metals 2017, 7, 210, 10.3390/met7060210.
- Mariana Angelescu; Vasile Dănuţ Cojocaru; Nicolae Serban; Elisabeta Cojocaru; Evaluation of Optimal Forging Temperature Range for an Industrial UNS S32750 SDSS Alloy Using SEM-EBSD Analysis. Metals 2018, 8, 496, 10.3390/met8070496.
- Vasile Dănuţ Cojocaru; Doina Răducanu; Mariana Angelescu; Adrian Nicolae Vintilă; Nicolae Serban; Ioan Dan; Ion Cinca; Influence of Solution Treatment Duration on Microstructural Features of an Industrial Forged UNS S32750/1.4410/F53 Super Duplex Stainless Steel (SDSS) Alloy. JOM 2017, 69, 1439-1445, 10.1007/s11837-017-2372-0.
- W. L. Grube; S. R. Rouze; The Origin, Growth and Annihilation of Annealing Twins in Austenite. Canadian Metallurgical Quarterly 1963, 2, 31-52, 10.1179/cmq.1963.2.1.31.
- Gleiter, H. The formation of annealing twins (Formation des macles de recuit/Die bildung von anazwillingen). Acta Metall. 1969, 17, 1421–1428.
- Marc A. Meyers; Lawrence Murr; A model for the formation of annealing twins in F.C.C. metals and alloys. Acta Metallurgica 1978, 26, 951-962, 10.1016/0001-6160(78)90046-9.
- Peng Chen; F.X. Wang; Jamie Ombogo; Bin Li; Formation of 60° 〈011̅0〉 boundaries between {101̅2} twin variants in deformation of a magnesium alloy. Materials Science and Engineering: A 2019, 739, 173-185, 10.1016/j.msea.2018.10.029.
- Z.Y. Liang; M.X. Huang; Deformation twinning in small-sized face-centred cubic single crystals: Experiments and modelling. Journal of the Mechanics and Physics of Solids 2015, 85, 128-142, 10.1016/j.jmps.2015.09.004.
- Zhiyong Chen; Hongnian Cai; Saiyi Li; Xinming Zhang; Fuchi Wang; Chengwen Tan; Analysis of crystallographic twinning and slip in fcc crystals under plane strain compression. Materials Science and Engineering: A 2007, 464, 101-109, 10.1016/j.msea.2007.03.081.
- Nan Li; Jian Wang; A. Misra; X. Zhang; J.Y. Huang; J.P. Hirth; Twinning dislocation multiplication at a coherent twin boundary. Acta Materialia 2011, 59, 5989-5996, 10.1016/j.actamat.2011.06.007.
- Maria-Cecilia Marinelli; Ahmed El Bartali; Javier W. Signorelli; Pierre Evrard; Véronique Aubin; Iris Alvarez-Armas; Suzanne Degallaix-Moreuil; Activated slip systems and microcrack path in LCF of a duplex stainless steel. Materials Science and Engineering: A 2009, 509, 81-88, 10.1016/j.msea.2009.01.012.
- Tibor Šmida; Jan Bosansky; Deformation twinning and its possible influence on the ductile brittle transition temperature of ferritic steels. Materials Science and Engineering: A 2000, 287, 107-115, 10.1016/s0921-5093(00)00828-5.
- Y.Y. Wang; Xin Sun; Y.D. Wang; X.H. Hu; H.M. Zbib; A mechanism-based model for deformation twinning in polycrystalline FCC steel. Materials Science and Engineering: A 2014, 607, 206-218, 10.1016/j.msea.2014.04.010.
- Z.Q Sun; W.Y Yang; J.J Qi; A.M Hu; Deformation enhanced transformation and dynamic recrystallization of ferrite in a low carbon steel during multipass hot deformation. Materials Science and Engineering: A 2002, 334, 201-206, 10.1016/s0921-5093(01)01806-8.
- Janusz Ryś; Grzegorz Cempura; Microstructure and deformation behavior of metastable duplex stainless steel at high rolling reductions. Materials Science and Engineering: A 2017, 700, 656-666, 10.1016/j.msea.2017.06.022.
- Y. Wang; Y.H. Yao; Z.P. Wang; Y.H. Jin; Xiliang Zhang; J.N. Liu; Thermal ageing on the deformation and fracture mechanisms of a duplex stainless steel by quasi in-situ tensile test under OM and SEM. Materials Science and Engineering: A 2016, 666, 184-190, 10.1016/j.msea.2016.04.051.
- Williams, R.O. Further studies of the iron-chromium system. Trans. TMS-AIME. 1958, 212, 497-502.
- T. J. Marrow; N. Bury; THE BRITTLE FRACTURE OF 475°C EMBRITTLED CAST DUPLEX STAINLESS STEEL. Fatigue Fracture of Engineering Materials and Structures 1997, 20, 565-571, 10.1111/j.1460-2695.1997.tb00288.x.
- Niklas Pettersson; Sten Wessman; Mattias Thuvander; Peter Hedström; Joakim Odqvist; Rachel F.A. Pettersson; Staffan Hertzman; Nanostructure evolution and mechanical property changes during aging of a super duplex stainless steel at 300 °C. Materials Science and Engineering: A 2015, 647, 241-248, 10.1016/j.msea.2015.09.009.
- Mogra Natesh; V. Shamanth; K.S. Ravishankar; Effect of Reversion Heat Treatment on the Mechanical Properties of Thermally Embrittled UNS S32760 Duplex Stainless Steel. Materials Science Forum 2015, 830, 127-130, 10.4028/www.scientific.net/msf.830-831.127.
- P. Auger; Frédéric Danoix; A. Menand; S. Bonnet; J. Bourgoin; M. Guttmann; Atom probe and transmission electron microscopy study of aging of cast duplex stainless steels. Materials Science and Technology 1990, 6, 301-313, 10.1179/mst.1990.6.3.301.
- Johan Johansson; Magnus Odén; Load sharing between austenite and ferrite in a duplex stainless steel during cyclic loading. Metallurgical and Materials Transactions B 2000, 31, 1557-1570, 10.1007/s11661-000-0166-3.