1. Introduction
In recent years, immersive technologies have become increasingly popular in various industries, including tourism. Augmented reality (AR) and virtual reality (VR) are being implemented in various tourist and hospitality areas, such as theme parks, museums, historical sites, etc.
[1]. These technologies have gained significant attention from researchers and practitioners, due to their capability to enhance tourists’ satisfaction, by delivering unforgettable experiences
[2].
AR technology, a variant of virtual environments (VE) that allows users to see the real world with virtual objects overlaid in real time
[3], has emerged as a transformative tool that can revolutionize various sectors, offering enhanced and immersive experiences. Researchers and tourism practitioners have recognized AR’s potential in tourism since 2000
[4]. Pioneering studies, such as that by Vlahakis et al.
[5], have introduced novel systems that offer personalized AR tours and 3D reconstructions of ruined historical sites. Additionally, advancements in AR technology, as highlighted by Höllerer and Feiner in their study
[6], have enabled tourists to easily discover destinations, access background information, and explore countless possibilities, limited only by the capabilities of the AR device, and the available information. Since then, AR has been increasingly adopted to provide tourists with relevant information about the sites they visit, improve navigation, and create highly dynamic experiences at tourist attractions
[7]. The growing interest in AR applications for tourism requires a comprehensive understanding of AR technology’s evolution, contexts, and design elements in this field.
Moreover, tourism is facing numerous challenges related to technology, economics, and sustainability
[8]. The COVID-19 pandemic has further intensified these challenges, causing significant socio-cultural and economic impacts on various stakeholders in the industry, with some effects expected to persist for years to come
[9]. In addition, with the rapid development of mobile technology, and the emergence of groundbreaking AR applications, such as the Pokémon Go craze
[10], tourists are showing an increasing demand for AR-based solutions to enhance their travel experiences
[11].
2. Research Progress of Augmented Reality in Tourism Industry
2.1. Annual and Regional Distribution of Scientific Production
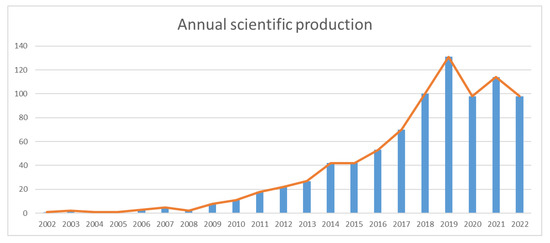
The growth of research in the field of AR for tourism can be assessed by analyzing the annual distribution of published papers. The timeline of the number of research papers published per year is demonstrated in Figure 12, which reveals three distinct periods of productivity, each characterized by specific underlying factors.
Figure 12.
Annual scientific production.
The first period, spanning from 2002 to 2008, marks the nascent stage of AR tourism research, with a minimal output of 1 to 5 publications per year. The limited productivity can be attributed to the novelty of the technology, the scarcity of practical applications, and the lack of widespread awareness about the potential benefits of AR in tourism. This period is characterized by the pioneering efforts of researchers to investigate the potential of AR technology in the tourism industry.
The second period, covering 2009 to 2019, exhibits a steady increase in research output, with annual publication numbers ranging from 8 to 131. This growth can be attributed to the maturation of AR technology, increased accessibility, and a growing recognition of its potential application in the tourism sector. During this period, researchers began to explore a wider range of topics, such as design, development, gamification, user experience, satisfaction, and behavior intention, demonstrating an expanding interest in the field
(see Section 4.2).
The third period, extending from 2020 to 2022, features consistent annual publication numbers, stabilizing at around 98 in both 2020 and 2022. This period, known as the post-COVID-19 era, commences in 2021, after a decline in research productivity during 2020 due to the pandemic. This phase is characterized by a renewed interest in AR tourism research, as the tourism industry pursued innovative approaches, such as artificial intelligence and machine learning, to adapt to novel challenges and shifting consumer behaviors resulting from the pandemic.
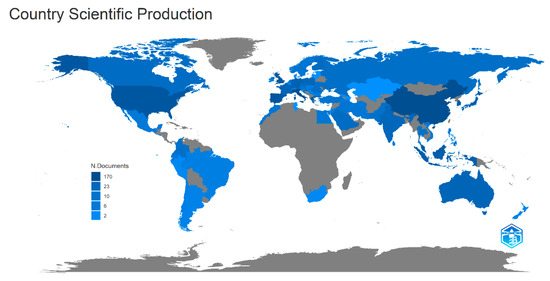
Figure 23 demonstrates the world map of regional scientific production. Delving deeper into the productivity of countries in the realm of AR tourism research, Italy emerges as a frontrunner, with an impressive 170 publications (20% of the total publications), followed closely by China at 142 (17%), and the UK with 87 (10%). When juxtaposed, these countries exemplify the varied regional and economic contexts that contribute to the field’s diversity and growth.
Figure 23.
Geographical distribution of scientific production.
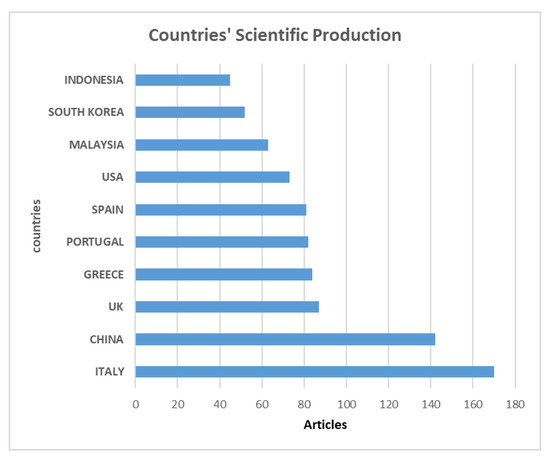
As shown in Figure 34, Europe is strongly involved, with countries such as Italy, the UK, Greece, Portugal, and Spain contributing significantly to AR tourism research. Concurrently, Asian nations such as China, Malaysia, South Korea, and Indonesia reveal considerable dedication to the field. The United States of America (USA), as the leading contributor from North America, further highlights the global scope of AR tourism research.
Figure 34.
Top 10 most productive countries.
A nuanced examination of the economic classification of countries involved in AR tourism research unveils a heterogeneous landscape. Advanced economies such as Italy, the UK, and the USA are undoubtedly prominent players; however, the substantial contributions from emerging economies such as China, Malaysia, and Indonesia underscore the inclusive nature of the field. This observation suggests that AR tourism research transcends economic boundaries, fostering participation from nations across a broad spectrum of income levels and developmental stages.
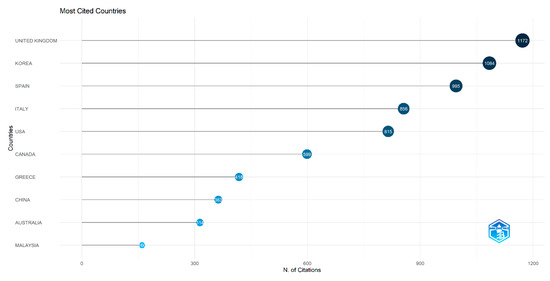
A thorough analysis of the most cited countries in AR tourism research, as depicted in Figure 45, highlights a diverse landscape that transcends geographic borders. The United Kingdom’s leading with 1172 citations demonstrates the nation’s commitment to producing high-quality research in AR tourism. South Korea having 1084 citations reflects the country’s rapid technological advancements, and its keen interest in the development of innovative applications for AR in tourism. Spain and Italy contributing 995 and 856 citations, respectively, underscores the importance of AR in preserving and promoting cultural heritage within the tourism sector. Both countries have a rich history and a plethora of tourist attractions, which has driven the need for groundbreaking research in AR, to enhance visitor experiences and boost tourism. The USA having 815 citations displays the nation’s status as a global leader in technology and innovation. The significant citation count is a testament to the quality of research produced by excellent universities and research centers across the country.
Figure 45.
Top 10 most cited countries.
2.2. Emerging Topics of AR in Tourism
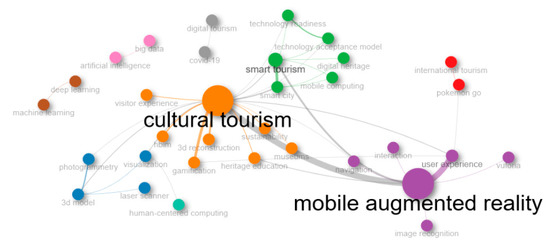
Figure 56 provides a network visualization of the conceptual structure of the most commonly occurring concepts in AR research within the tourism industry. Each node in the network diagram represents a specific keyword, while the links between nodes illustrate the frequency of co-occurrence of these keywords. The size of each node corresponds to the frequency of occurrence of the respective keyword, while the thickness of the links represents the strength of the association between the keywords. To facilitate interpretation, each thematic cluster in the network is color-coded, highlighting the most salient topics (nodes) and their interrelationships (links). As a result, a minimum node size was maintained, to ensure visual clarity, regardless of variation in the frequencies of keyword occurrence.
Figure 56.
Keyword co-occurrence network based on author’s keywords.
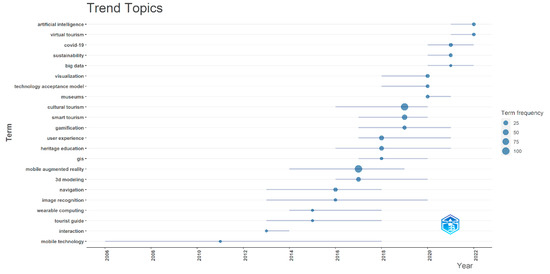
Figure 67 illustrates the evolution of AR research themes in tourism over time. Together with Figure 12, which displays the annual distribution of published papers, the 2002–2022 timeframe has been divided into five distinct phases.
The first phase, known as the Pioneering Phase (2002–2006), saw a small group of early visionaries exploring the potential of AR in the tourism industry, with a particular focus on mobile technology that would become increasingly important in subsequent years
[12][31]. The second phase, referred to as the Mobile Engagement Era (2006–2013), emphasizes the growing importance of mobile technology, which facilitated tourists’ access to augmented reality experiences, using handheld devices. During this phase, a focus was placed on developing engaging and interactive AR experiences for tourists
[13][32]. The third phase, known as the Technological Convergence Period (2014–2017), is characterized by the emergence of wearable devices such as smart glasses, and the integration of AR with advanced navigation technologies such as GIS, as well as image-processing techniques such as 3D modeling and image recognition
[14][33]. Heritage education and museums also gained prominence during this phase
[15][34], coinciding with the growth of MAR, allowing visitors to better understand and appreciate cultural tourism experiences. The fourth phase is the User Experience Optimization Stage (2017–2019). At this stage, the focus shifted to enhancing the user experience, often through gamification techniques, and to developing the smart tourism concept
[16][35]. Studies also investigated user acceptance of AR in tourism, seeking to understand the factors that influence user adoption and satisfaction
[17][36]. Visualization techniques were further explored, to improve the overall user experience
[18][37]. As a result, cultural tourism experienced significant growth in 2019, as shown in
Figure 67. The final phase is the Adaptation and Integration Stage (2020–2022). The most recent stage in the development of AR in tourism is characterized by the use of big data to enhance AR experiences
[19][38], and the growing importance of sustainability in the industry
[8]. The COVID-19 pandemic led to an acceleration in the adoption of AR for virtual tourism
[20][39], offering new possibilities for survival and recovery in the sector
[21][40]. Furthermore, artificial intelligence has increasingly been integrated into AR applications, creating more personalized and dynamic experiences for tourists
[22][41].
Figure 67.
The occurrence of keywords and their frequency over time (years) based on the authors’ keywords.
2.3. Most Utilized AR Design Components in Tourism Settings
A content analysis of the 57 articles revealed a variety of AR systems being researched in the context of tourism.
2.3.1. Tracking Systems
As shown in
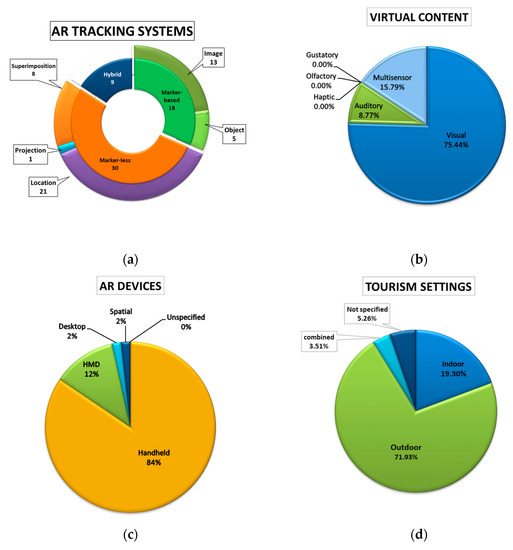
Figure 7a, marker-based systems, which rely on specific visual cues, such as art gallery paintings [23], food menus [24], and museum artifacts [25] for the accurate tracking and rendering of virtual information, account for 18 articles, with 13 focused on image-based systems, and 5 on object-based systems.
8a, marker-based systems, which rely on specific visual cues, such as art gallery paintings [42], food menus [43], and museum artifacts [44] for the accurate tracking and rendering of virtual information, account for 18 articles, with 13 focused on image-based systems, and 5 on object-based systems.
AR design elements. () AR tracking systems. () Virtual content overlaid by AR devices. () AR devices used to deploy AR experiences. () Tourism settings supported by AR technology.
2.3.2. AR Devices
Figure 7c demonstrates the range of devices that researchers and practitioners have been exploring to deliver AR experiences in the tourism industry. Handheld devices, especially smartphones and tablets, were the most commonly used, featuring in 49 of the articles (84%). This prevalence can be attributed to the widespread accessibility and portability of mobile devices, making them a popular choice for implementing AR experiences in tourism. Head-mounted displays (HMDs), particularly smart glasses and headsets, were utilized in 7 articles (12%), offering a more immersive experience for users. Desktop systems were employed in just 1 study (2%), while spatial devices, which enable users to interact with their surroundings using video projectors [26], also appeared in 1 article (2%).
8c demonstrates the range of devices that researchers and practitioners have been exploring to deliver AR experiences in the tourism industry. Handheld devices, especially smartphones and tablets, were the most commonly used, featuring in 49 of the articles (84%). This prevalence can be attributed to the widespread accessibility and portability of mobile devices, making them a popular choice for implementing AR experiences in tourism. Head-mounted displays (HMDs), particularly smart glasses and headsets, were utilized in 7 articles (12%), offering a more immersive experience for users. Desktop systems were employed in just 1 study (2%), while spatial devices, which enable users to interact with their surroundings using video projectors [47], also appeared in 1 article (2%).
2.3.3. Tourism Settings
Figure 78d reveals the different tourism settings in which AR is being applied. The majority of the studies, with 41 articles (71.93%), focus on outdoor settings, highlighting the potential of AR to enhance the experience of tourists visiting natural and urban environments
[27][49]. In contrast, 11 articles (19.30%) explore indoor settings, such as museums, galleries, and historical buildings, demonstrating the value of augmented reality in providing immersive experiences within confined spaces (e.g.,
[28][50]).
2.3.4. Virtual Content
The content analysis of the 57 articles, as shown in
Figure 78b, reveals the various virtual content types employed in AR experiences for tourism. The most predominant type of content is visual, featured in 43 articles (75.44%), which aligns with the primary objective of augmented reality, to overlay digital information onto the physical world. Auditory content, although less common, was employed in 5 articles (8.77%), providing an additional layer of sensory experience for users. It is intriguing to observe that none of the papers focus on haptic, olfactory, or gustatory content individually. However, 9 studies (15.79%) have developed systems that incorporate these sensory experiences simultaneously, through multi-sensor systems.
2.3.5. Links between AR Tracking Systems and Tourism Settings
Table 16 presents the matrix of relationships between AR systems (rows) and tourism settings (columns), where they were employed to improve the tourist experience. Noticeable preferences for particular systems can be seen, depending on the environment. It is important to note that the total sum of articles exceeds 57, as numerous studies employ more than one system to accommodate various tourism settings. The values in parentheses correspond to the instances of the matrix.
Table 16.
Interrelationships between AR tracking systems and tourism settings.
| |
Indoor |
Outdoor |
Combined Settings |
Not Specified |
| Marker-based image |
5
[23][29][30] |
2.3.6. Links between AR Devices and Virtual Content
Table 27 illustrates the matrix of relations between AR devices (rows) and the virtual content (columns) they produce, examining how these elements work together to improve user experience. It is important to note that the total sum of rows and columns is 59, as some projects have utilized multiple tools to provide multisensory content. For instance, ref.
[65][85] presented two location-based AR systems that employed both smartphones and smart glasses, enabling users to access audio and visual information when arriving at a point of interest.
Table 27.
Interrelationships between AR devices and virtual content.
| |
Visual |
Auditory |
Haptic |
Olfactory |
Gustatory |
Multisensory |
| [ |
| Handheld |
39
[24][27][28]31][32][42,55,64,65,[66] |
29][30][31][33][34][35][36][39][40][41][43][44][45][46][47][48][49][52][53][54][55][57][59][60][61][63][64][66][67][68][69][70][75][76][77][78][28,43,45,48,49,50,51,53,54,55,58,59,61,62,63,64,65,67,68,71,72,73,74,75,76,79,80,81,83,84,86,87,88,89,90,93,94,95,96]8
[33][34][35][][40][62,63,6736 |
2]
[16][56][[3537][38,68],69[,7039,71,72] |
,60]2
[41][42][51,52] |
3
[24][43][44] |
0[43,53,54] |
| 0 |
0 |
8 |
| [ | 25 | ][37][38][42][50][65][73][74][44,46,52,69,70,77,85,92] |
Marker-based object |
1
[25][44] |
6
[45][46][47][48][49][50][48,73,74,75,76,77] |
1
[41][51] |
| HMD |
3
[23 | 0 |
| ] | [32][71][42,57,66] |
3
[51][58][62][56,78,82] |
0 |
0 |
0 |
2
[65][72][85,91] |
Marker-less location |
2
[28][51][50,56] |
24
[16][27][38][40][4869][70][28 |
| Desktop |
1
[60][80] | ],35[,45,4952,58][,5953][,6054][55][56][57][58][59][60][61][62][63][64][65][66],61[67],70[68],72[,75,78,79,80,81,82,83,84,85,86,87,88,89,90] |
1
|
0[42][ |
052] |
0 |
| 0 |
0 |
Marker-less projection |
1
[26][47] |
0 |
0 |
0 |
| 0 |
| Spatial |
1
[26][47] |
0 |
0 |
0 |
0 |
0 |
Marker-less superimposition |
2
[71][72][57,91] |
10
[27][33][45][57][73][74][75][76][77][78][46,48,49,61,62,92,93,94,95,96] |
0 |
0 |
The matrix indicates that users are primarily attracted to handheld devices, such as smartphones, tablets, or even portable telescopes, as demonstrated by [60][80], for creating various types of virtual content. A substantial emphasis is placed on visual (39) and multisensory (8) content.
HMDs, on the other hand, are predominantly utilized for visual content (3), with smart glasses enabling users to interact with 3D animations [71][57], or enhance learning experiences at art galleries [32][66]. Similarly, HMDs are employed for auditory content (3), with headsets serving as audio AR tour guides in indoor museums [51][56] and outdoor environments [58][62][78,82]. HMDs have also been used for multisensory content (2), incorporating smart glasses with audio output, to facilitate exploration and navigation of historic sites [65][85].
Regarding desktop and spatial devices, both have a very limited representation, with each being used only once for generating visual content. This could be attributed to the fact that desktop and spatial devices, such as AR projectors, are less practical, and have limited sensor capacities for AR application in tourism. As a result, researchers and practitioners may be less inclined to explore these devices in the context of AR tourism for enhancing user experiences, instead focusing on more portable and versatile options such as handheld devices and HMDs.