Your browser does not fully support modern features. Please upgrade for a smoother experience.
Please note this is a comparison between Version 2 by Catherine Yang and Version 1 by Solmaz Abdolrahimzadeh.
The choroid is the most vascularized structure of the eye and it is fundamental for the trophism of the outer retina. Its proper functioning and homeostasis represent key points in maintaining normal retinal physiology. Choroidal alterations may be implicated in the development and progression of numerous pathologies; therefore, in-depth studies using imaging techniques can be of crucial relevance to understanding the pathophysiology of retinal-choroidal diseases. Various choroidal parameters, including the choroidal vascularity index (CVI), were found to show alterations in intermediate age-related macular degeneration (AMD).
- choroidal vascularity index
- optical coherence tomography angiography
- age-related macular degeneration
1. Anatomy of Choroid
The choroid is the most vascularized structure of the eye; compared to other tissues in the body, it has the highest blood flow per unit weight [1]. It is the posterior portion of the uvea and the most extensive portion of the vascular tissue interposed between the deep face of the sclera and the deepest layer of the retina [6][2]. The thickness of the choroid is not uniform and is highly variable, depending on the blood flow of the choroidal vessels, increasing when there is a state of filling and decreasing when there is a state of relative emptying [7][3]. The inner face of the choroid is tightly connected to the retina; indeed, its adhesion with the outermost layer of the retina is so strong that spontaneous separation between the choroid and the retina is impossible.
The close anatomical proximity of the choroid and the retina underscores the crucial function of the choroid. It serves as a vital source for retinal nourishment and maintaining balance, ensuring a supply of oxygen and nutrients to the RPE cells and outer retinal layers while eliminating metabolites [8][4]. The choroid is structurally categorized into five layers, arranged from innermost to outermost: Bruch’s membrane, choriocapillaris (CC), Sattler’s layer, Haller’s layer, and the suprachoroidal space. The CC consists of a monolayer vascular layer, divided into functional units arranged in a mosaic pattern; the capillaries are small in diameter and fenestrated in the posterior pole of the retina, ensuring a high blood flow in the macular area and becoming progressively larger towards the periphery [9,10][5][6]. Sattler’s layer is composed of small-caliber arteries and veins, and Haller’s layer is constituted of large-caliber arteries and veins. The suprachoroidal space contains collagen fibers, melanocytes, and fibroblasts [11][7].
2. SDOCT
The introduction of SDOCT has allowed for images to be obtained with an improved axial resolution (about 3–5 μm) and higher acquisition speed (20,000–100,000 A-scans/s), with respect to previous time domain technology [12[8][9],13], allowing for the visualization of retinal structures with a histological-like resolution [14][10]. SDOCT is routinely used in the management of a variety of ocular diseases [12,13,15,16][8][9][11][12]. SDOCT technology, with multiple A-scans, generates images corresponding to the frontal sections of retinal layers, called “en face” scans, and transverse and sagittal sections, called “B-scans” [17,18][13][14]. Enhanced depth imaging (EDI) technology has been incorporated into the framework of some commercially available SDOCT instruments. This technology allows for a high-resolution visualization of deeper structures such as the choroid and the sclera [19][15]. In recent times, a new technology called swept-source OCT (SSOCT) has been introduced, utilizing a longer wavelength (1050 nm). This advancement enables enhanced signal penetration through the RPE, pigment deposits, drusen, and various other structures. Consequently, the SSOCT offers an improved visualization of the choroidal layers [20,21,22,23][16][17][18][19].
3. Choroidal Thickness
Choroidal thickness (CT) was one of the first parameters used to study the state of choroidal health. The first evidence dates back to the 70s, when this parameter was calculated from ultrasound images [24][20]. The evolution of ocular imaging technologies and the introduction of SDOCT with EDI technology has allowed for the standardization of the measuring method of CT and made it one of the main research methods in choroidal-retinal diseases [25,26,27][21][22][23]. CT can be calculated with manual or semi-automatic measurements on EDI scans from the inner choroidal boundary, corresponding to the RPE to the outer choroidal boundary, corresponding to the choroid–scleral junction [28,29][24][25] (Figure 1). Measurements can be performed under the fovea or at various distances from the fovea, producing even CT maps of the whole zone of interest. For example, measurements are commonly made on EDI scans with the manual caliper tool at the fovea and at variable intervals of 500 μm or 750 μm nasally and temporally, with respect to the fovea, to analyze up to 1500 or 2500 μm from the fovea [30][26]. This parameter has been and is now widely used in clinical practice and research to recognize, diagnose, and manage a range of ocular conditions [31][27]. Nevertheless, it is a parameter that is burdened by several limitations. It has a great variability and depends on numerous factors, including age, axial length, intraocular pressure, and time of day [32][28]. It does not provide information on other important aspects, such as vascularization, which is also critical for understanding various diseases [27][23].
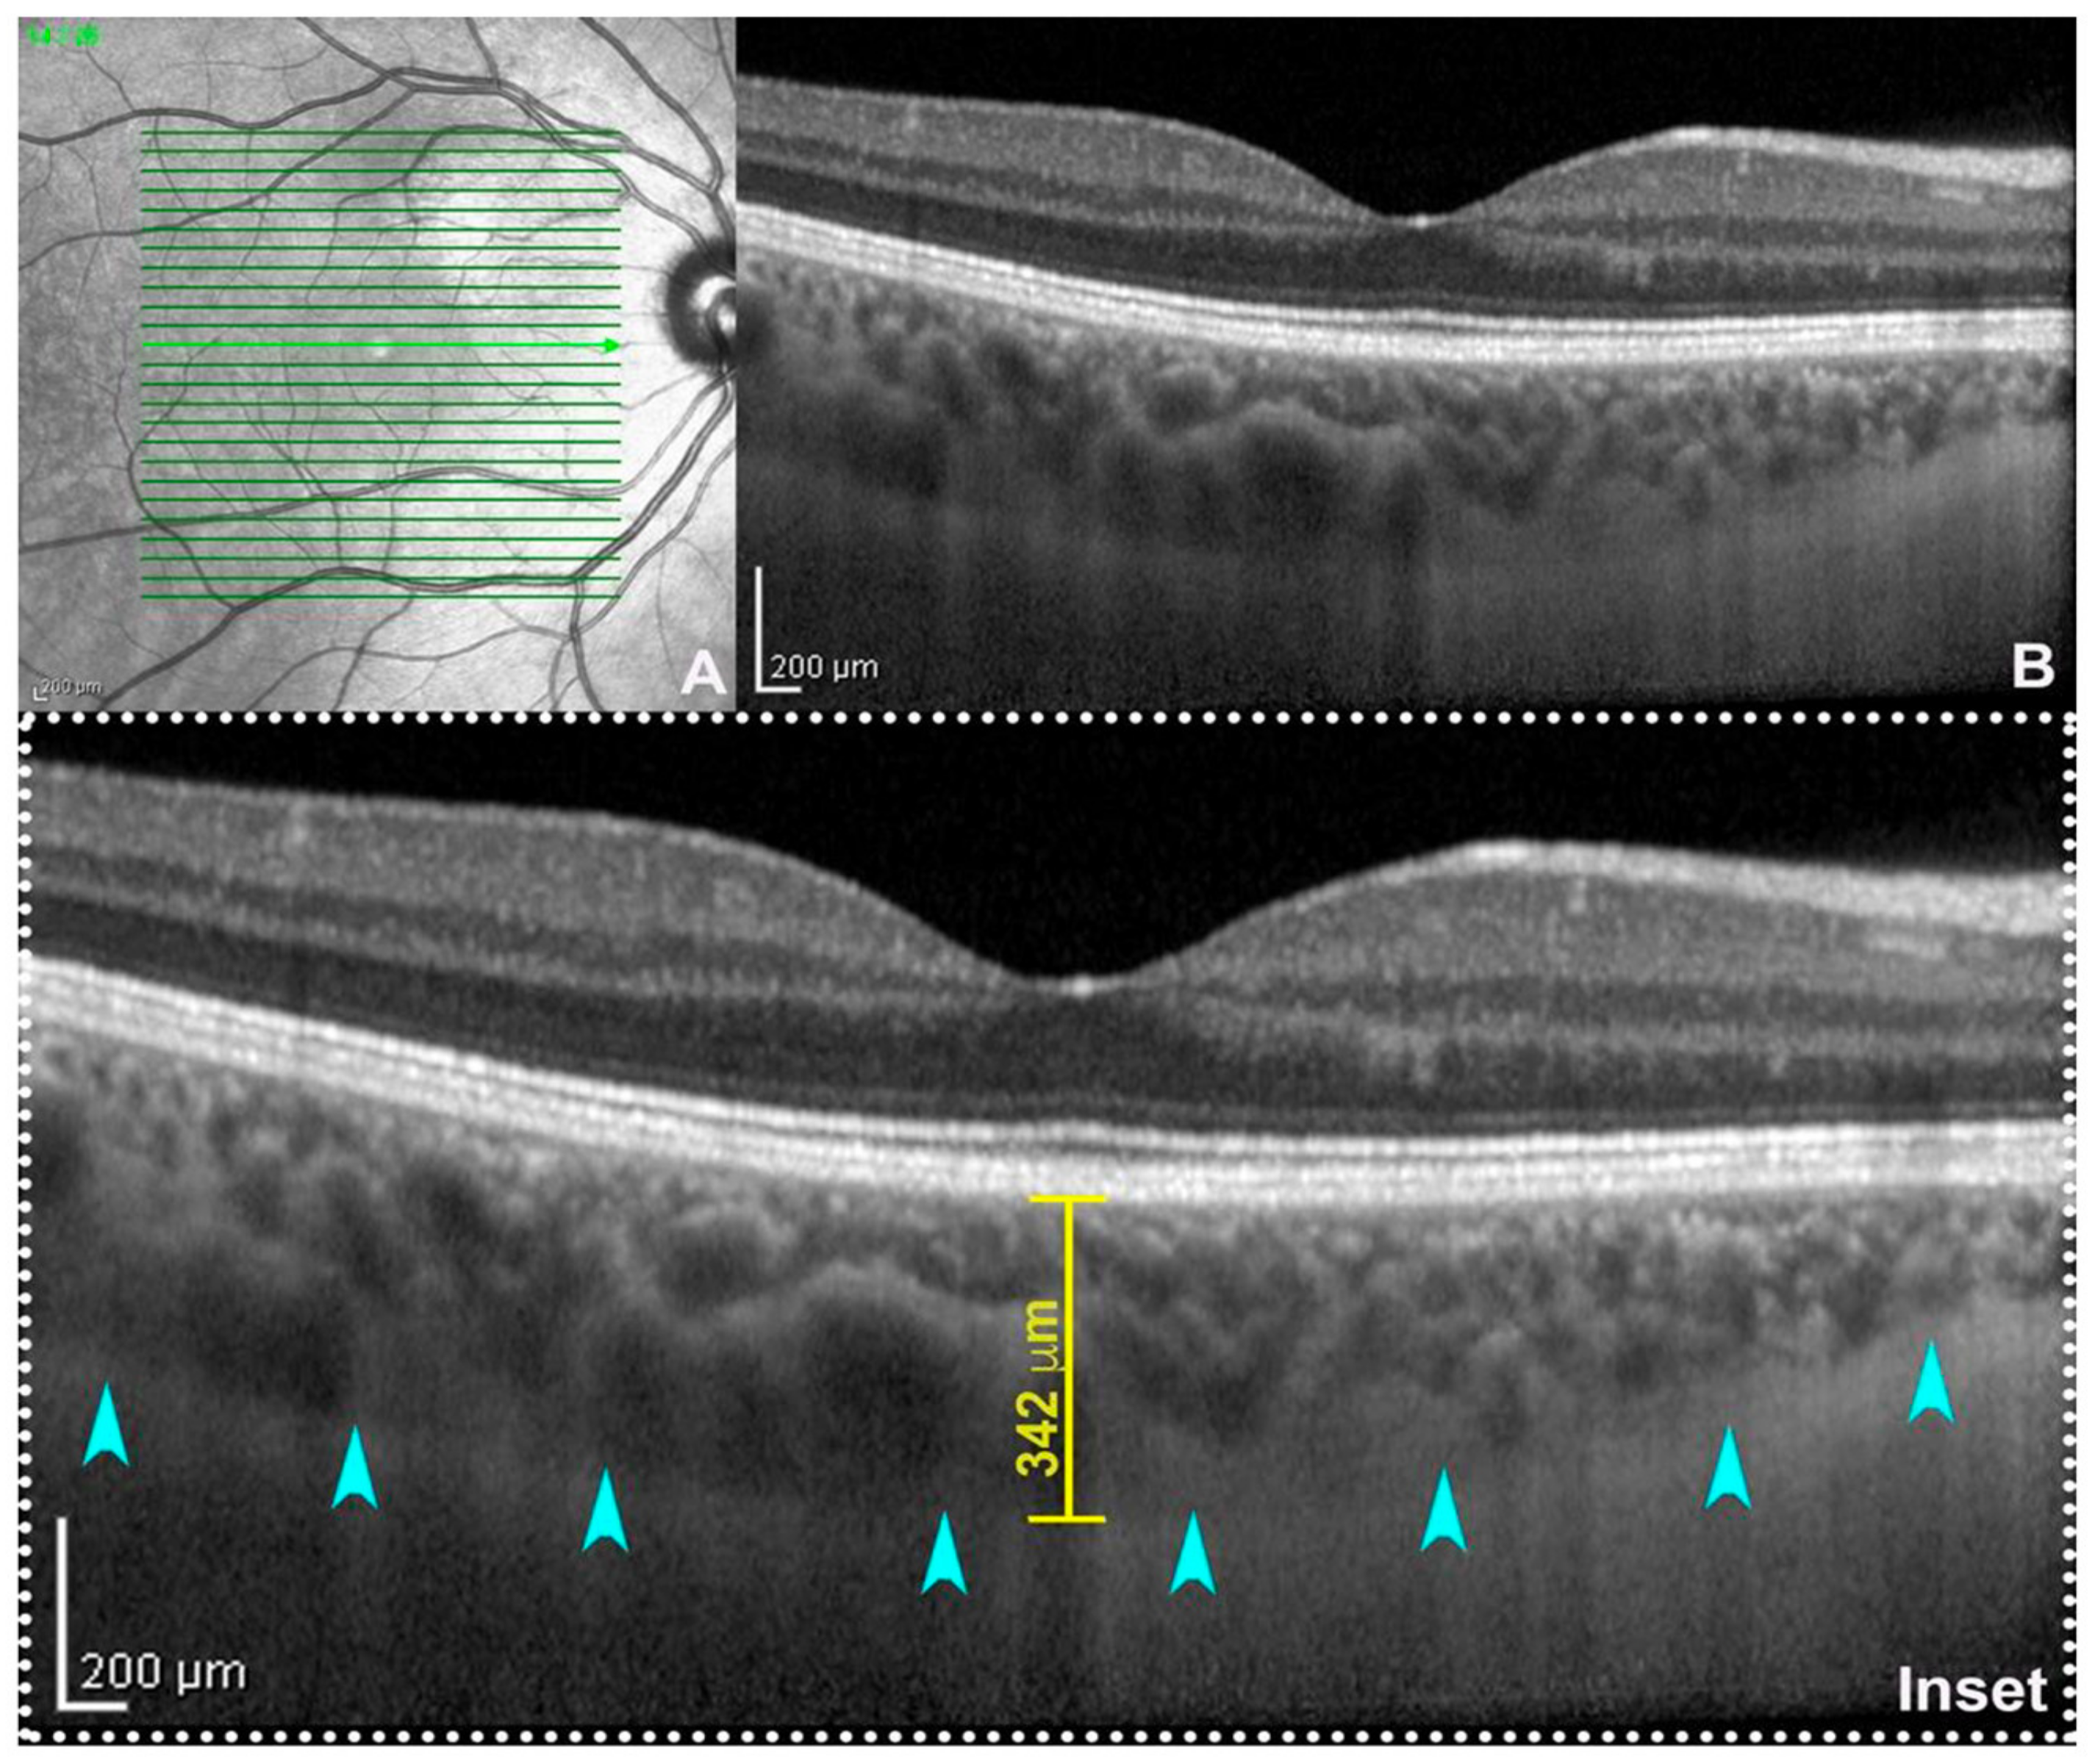
Figure 1. Enhanced depth imaging (EDI: (A) near-infrared reflectance; (B) spectral-domain optical coherence tomography (SD-OCT, Heidelberg Engineering, Heidelberg, Germany) subfoveal B-scan acquired using EDI-mode. On magnification (inset), the choroid–scleral junction is clearly detectable (teal arrowheads) allowing the calculation of subfoveal choroidal thickness traced between the outer border of the retinal pigment epithelium and the inner surface of the choroid–scleral junction through a digital caliper. From :Fragiotta, S.; Scuderi, L.; Iodice, C.M.; Rullo, D.; Di Pippo, M.; Maugliani, E.; Abdolrahimzadeh, S. Choroidal Vasculature Changes in Age-Related Macular Degeneration: From a Molecular to a Clinical Perspective. Int. J. Mol. Sci. 2022, 23, 12010.
Fragiotta, S.; Scuderi, L.; Iodice, C.M.; Rullo, D.; Di Pippo, M.; Maugliani, E.; Abdolrahimzadeh, S. Choroidal Vasculature Changes in Age-Related Macular Degeneration: From a Molecular to a Clinical Perspective. Int. J. Mol. Sci. 2022, 23, 12010.
Fragiotta, S.; Scuderi, L.; Iodice, C.M.; Rullo, D.; Di Pippo, M.; Maugliani, E.; Abdolrahimzadeh, S. Choroidal Vasculature Changes in Age-Related Macular Degeneration: From a Molecular to a Clinical Perspective. Int. J. Mol. Sci. 2022, 23, 12010.
4. Choroidal Vascularity Index
The CVI is a recently introduced parameter, which allows for in-depth analyses of choroidal vascularization. This technique was developed owing to the major limitations of CT measurements, such as their inability to differentiate the stromal from the vascular component of the choroid, and the CT variability [34,35][29][30]. Hence, there was a need for a parameter that is less variable, more repeatable, and that allows for the study of the choroid in toto, considering both its stromal and vascular components. The quantitative parameter of the CVI was introduced by Agrawal et al., and is defined as the ratio of the luminal choroidal area (LCA) over the total choroidal area (TCA) [5][31]. The authors introduced this parameter with the specific intent of assessing the vascular status of the choroid, using a segmentation and binarization technique initially proposed by Sonoda et al., with some differences [5,36][31][32]. In greater detail, Sonoda et al. presented a method of assessing the subfoveal LCA and stromal choroidal area (SCA). This involved an image binarization process of the EDI SDOCT foveal scan, utilizing the freely available ImageJ software (vers. 1.5, National Institutes of Health, Bethesda, MD, USA) [36,37][32][33].
The methodology proposed by the authors involves the analysis of 1500 µm wide EDI SDOCT scans after selecting a region of interest (ROI) corresponding to the choroid, with its upper margin at the RPE level and the lower margin at the choroid–scleral interface (CSI). Three choroidal vessels with a diameter greater than 100 µm are randomly selected and the average reflectivity of these areas is calculated by the software. Then, using Niblack’s autolocal threshold tool, the image is binarized to obtain a clear view of the CSI. The image is then converted into RGB (red, green, and blue) colors to allow the color threshold tool to select dark pixels. Then, the TCA and area of dark pixels, which is the LCA, are calculated [36,37][32][33] (Figure 2). Agrawal et al., introduced some innovations to the CVI measurement technique and proposed the selection of the subfoveal choroidal area only after the image was binarized, in order to obtain a better definition of the CSI and a more precise image selection [5][31].
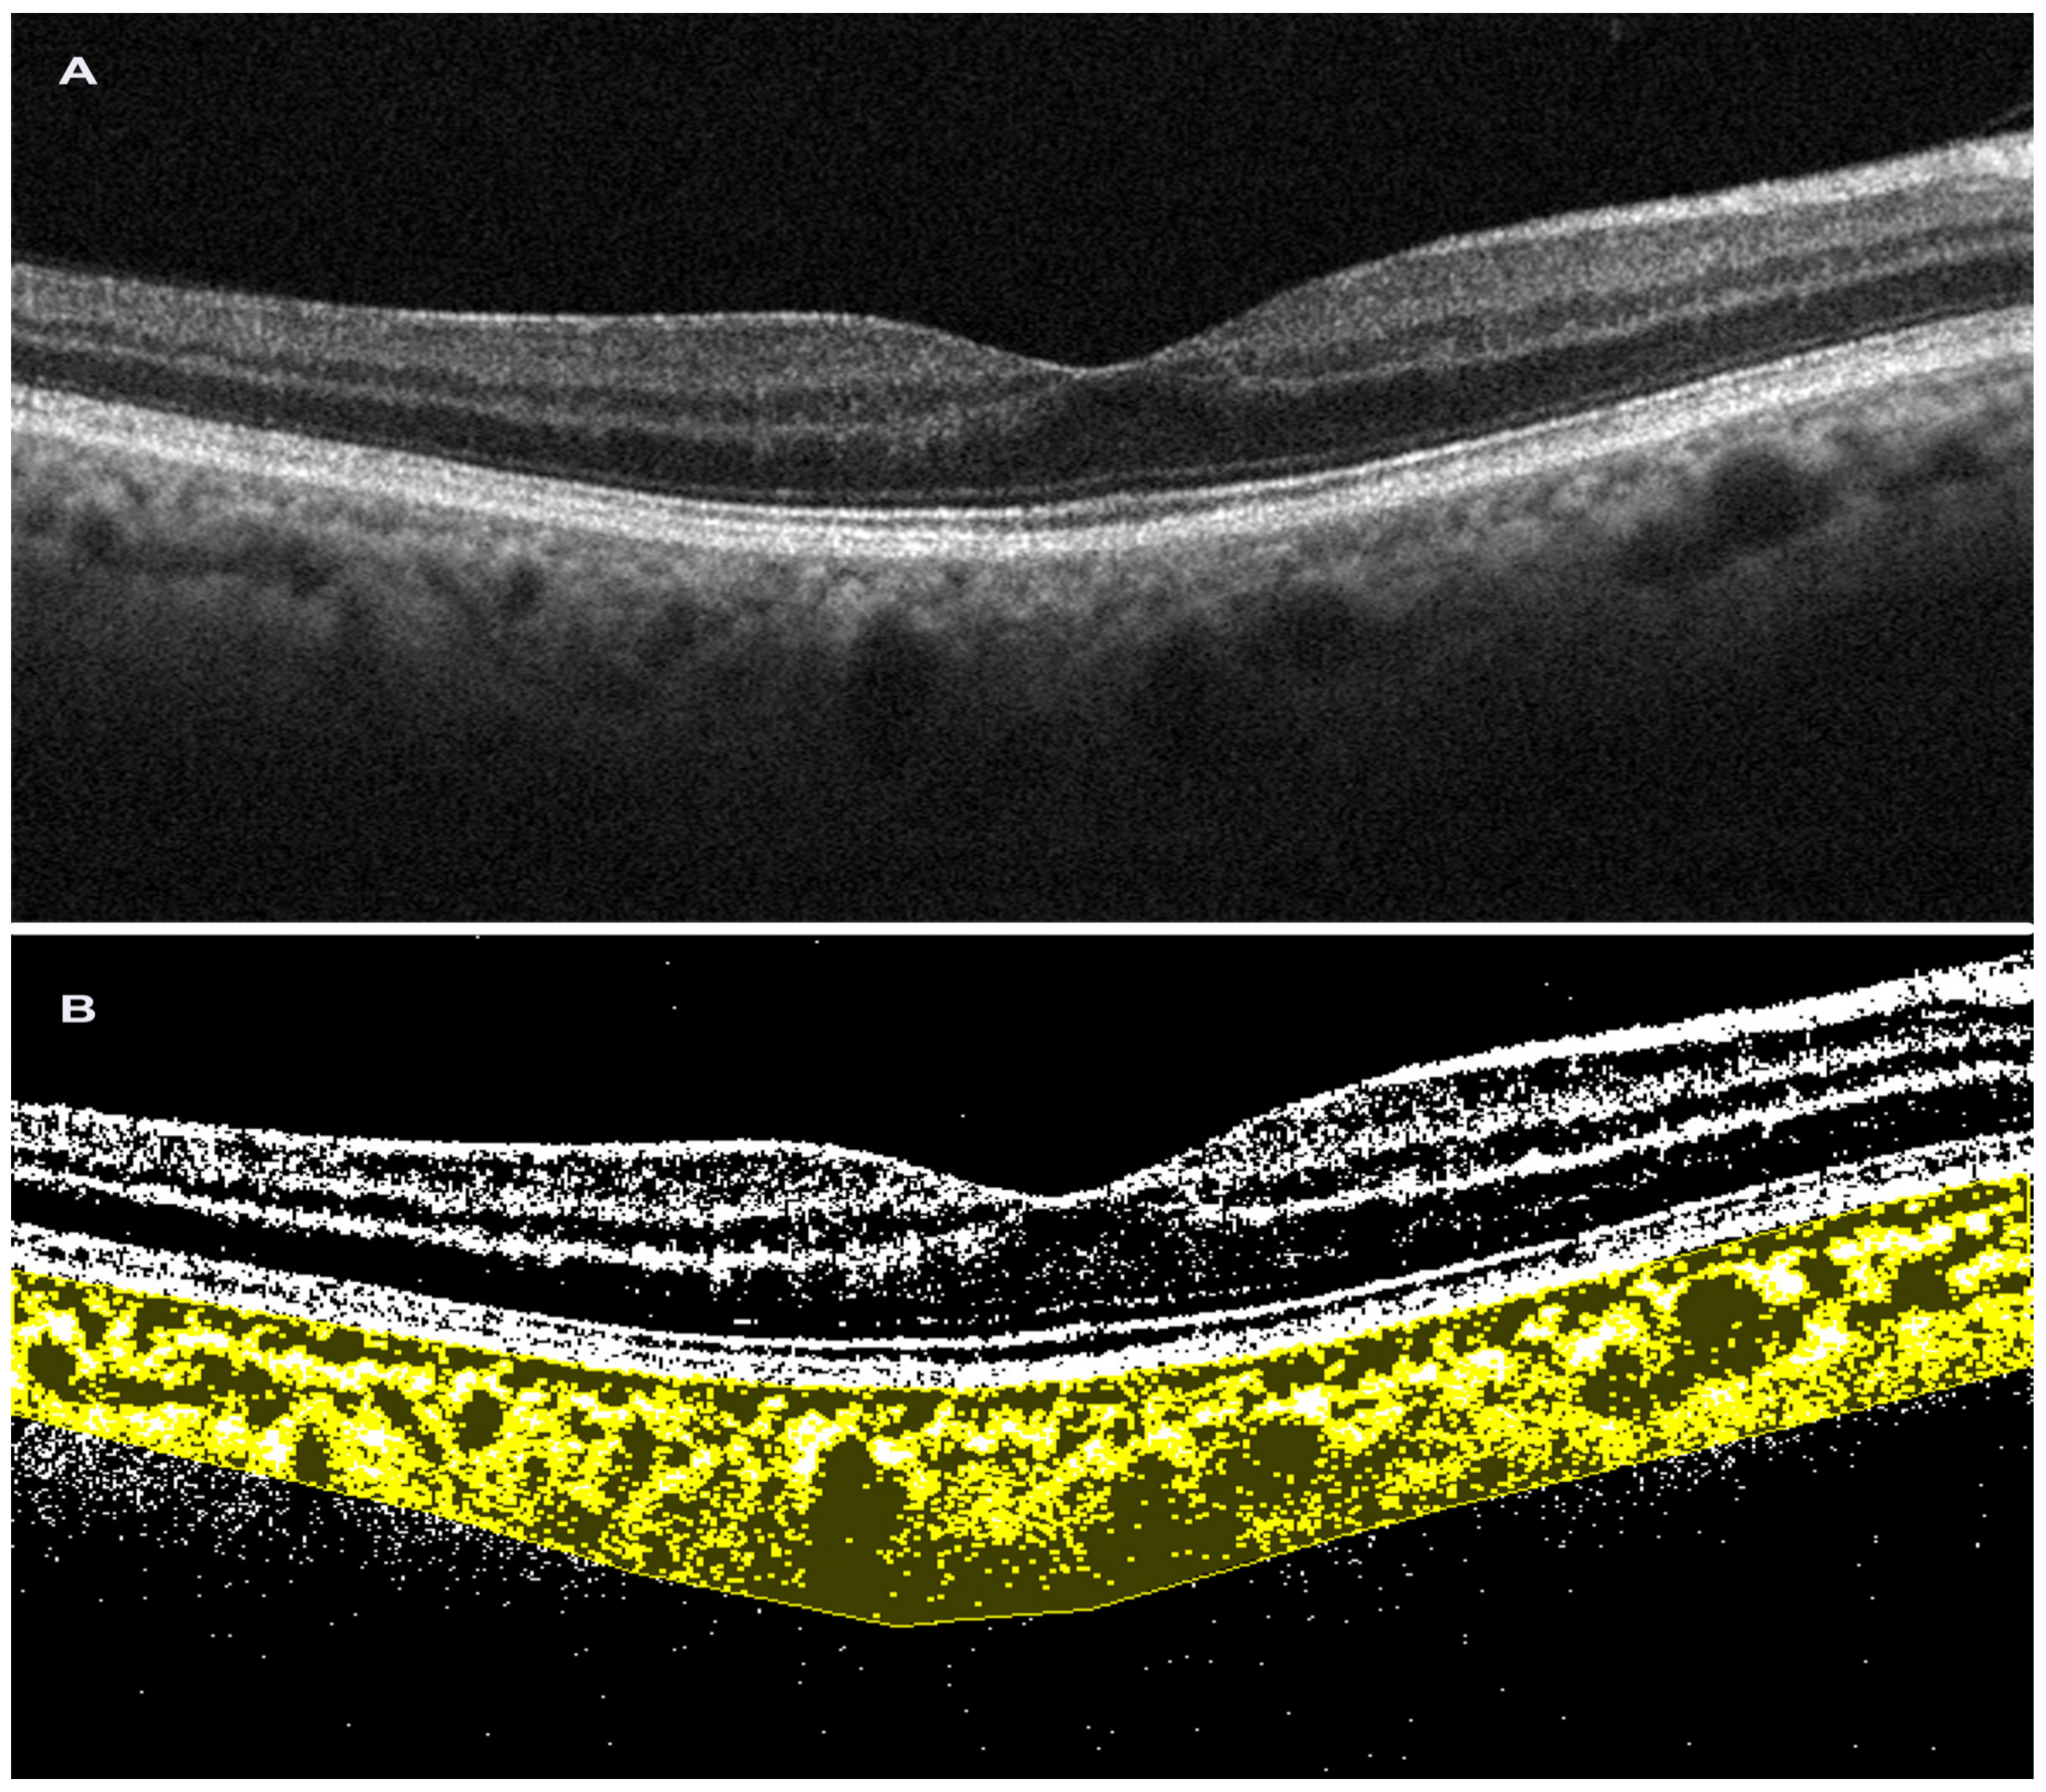
Figure 2. Choroidal vascularity index performed on spectral-domain optical coherence tomography scan. (A). Horizontal b-scan SD OCT image (Solix, Optovue Inc, Freemont, CA, USA); (B). Image after binarization in choroidal vascularity index processing (Image J, Fiji).
As the choroid is primarily a vascular structure, the characterization of this novel vascular index may help to further clarify the role of the vascular processes within the choroid and assess the development and progression of disease [38][34]. Since its introduction, many studies have sought to characterize the baseline values in the healthy choroid. Agrawal et al., in 2016, estimated that a normal CVI was about 65.6 ± 2.3% in healthy individuals, suggesting that vascular tissue represents approximately two thirds of normal subfoveal choroidal volume [5][31]. The CVI is considered to be a more stable choroidal assessment index than CT, because it is not affected by several physiological factors, such as intraocular pressure (IOP), axial length, refraction, and age [39,40][35][36]. Ruiz-Medrano et al. found that the CVI is higher under 18 years of age; they justified this result by observing that the LCA is higher in young people, decreasing with aging, while the SCA remains stable [41][37]. Diurnal changes in the CVI in healthy individuals were studied in an observational study with a small sample, which found no significant variation in the subfoveal CVI during daytime [42][38]. Repeatable results have also been obtained from groups calculating the CVI in various ocular and systemic vision-threatening diseases [43][39]. An additional plus for CVI accuracy and repeatability is that no significant instrument-related differences are found (swept-source vs. spectral-domain), but it is dependent on the SDOCT image quality, because if the CSI cannot be defined, then the CVI is unreliable [44][40]. In this regard, a shadow compensation visualization technique is suggested in order to remove the retinal blood vessels projection shadows that could interfere with the choroid visualization during SDOCT imaging. Overall, the advantages of the CVI parameter are its stability and reduced variability compared to CT, being influenced by fewer physiological factors [40][36]. Multiple studies have evaluated its effectiveness as a tool for evaluating the prognosis and progression of eye and systemic diseases, with promising results [46,47][41][42]. To date, a limitation is that the CVI is used only for research purposes, as it is a parameter that requires long calculation times using specific software, thus constituting a restriction in clinical practice.
5. Optical Coherence Tomography Angiography
OCTA technology is based on the concept of motion detection. Basically, vascular flow is identified using the movement of erythrocytes as an intrinsic contrast agent. Therefore, no intravenous dye is used [48][43]. In brief, B-scan images are acquired in rapid succession and built-in OCTA software enables motion detection based on a differential analysis of the sequential scans. The movement of flow or blood cells creates contrast, and the motion contrast is measured by the emission of a decorrelation signal, which appears on the OCTA scan as white. Multiple B-scans are automatically performed at the same site, and the structural images are compared pixel by pixel to detect signal changes that occur due to erythrocyte sliding. The alterations observed between consecutive B-scans are represented as a motion contrast image. These B-scans can be compared either in pairs or through various combinations employing diverse algorithms [48,49][43][44]. OCTA produces three-dimensional flow images that require appropriate segmentation to evaluate vascular abnormalities. This segmentation is performed by built-in instrumental software, which selects reference planes or surfaces. In healthy eyes, the segmentation algorithm determines these layers very accurately. In contrast, in pathological conditions, where there are retinal abnormalities, it is often necessary to perform manual segmentation to correct for errors. OCTA allows for the segmentation of choroid-retinal vascularization into slabs: the superficial capillary plexus, the deep capillary plexus, the outer retina, and the CC [50][45].
To obtain volumetric OCTA data covering a specific area of the retina, repeated B-scans are conducted at various points using a raster scan pattern. The resulting OCTA volume allows for a three-dimensional visualization of the retinal microvasculature, and this is commonly presented by segmenting different retinal layers and displaying an en-face view similar to dye-based imaging techniques such as fluorescein angiography (FA) or indocyanine green angiography (ICGA) [48][43]. The most dependable approach for visualizing and interpreting OCTA images involves assessing both the en-face OCTA image and the B-scan with flux overlay, alongside the corresponding en-face structural OCT image [51][46]. The introduction of this new imaging technique has enabled the study of the CC without the need for invasive imaging techniques that require the use of dye, such as ICGA.
OCTA demonstrates a lateral resolution similar to structural SDOCT and can identify CC blood flow by creating contrast between the RPE and CC [52,53,54,55][47][48][49][50]. This flow signal generates a distinctive image of the CC, showing a granular pattern with light and dark areas of varying sizes (Figure 3). The dark areas indicate relative decreases in the local flow signal and are referred to as signal voids [56][51]. Analyzing the number and size of these signal voids establishes a relationship linked to the CC flow, which may undergo changes during aging, disease, and potentially in the progression to late stages of AMD [57][52].
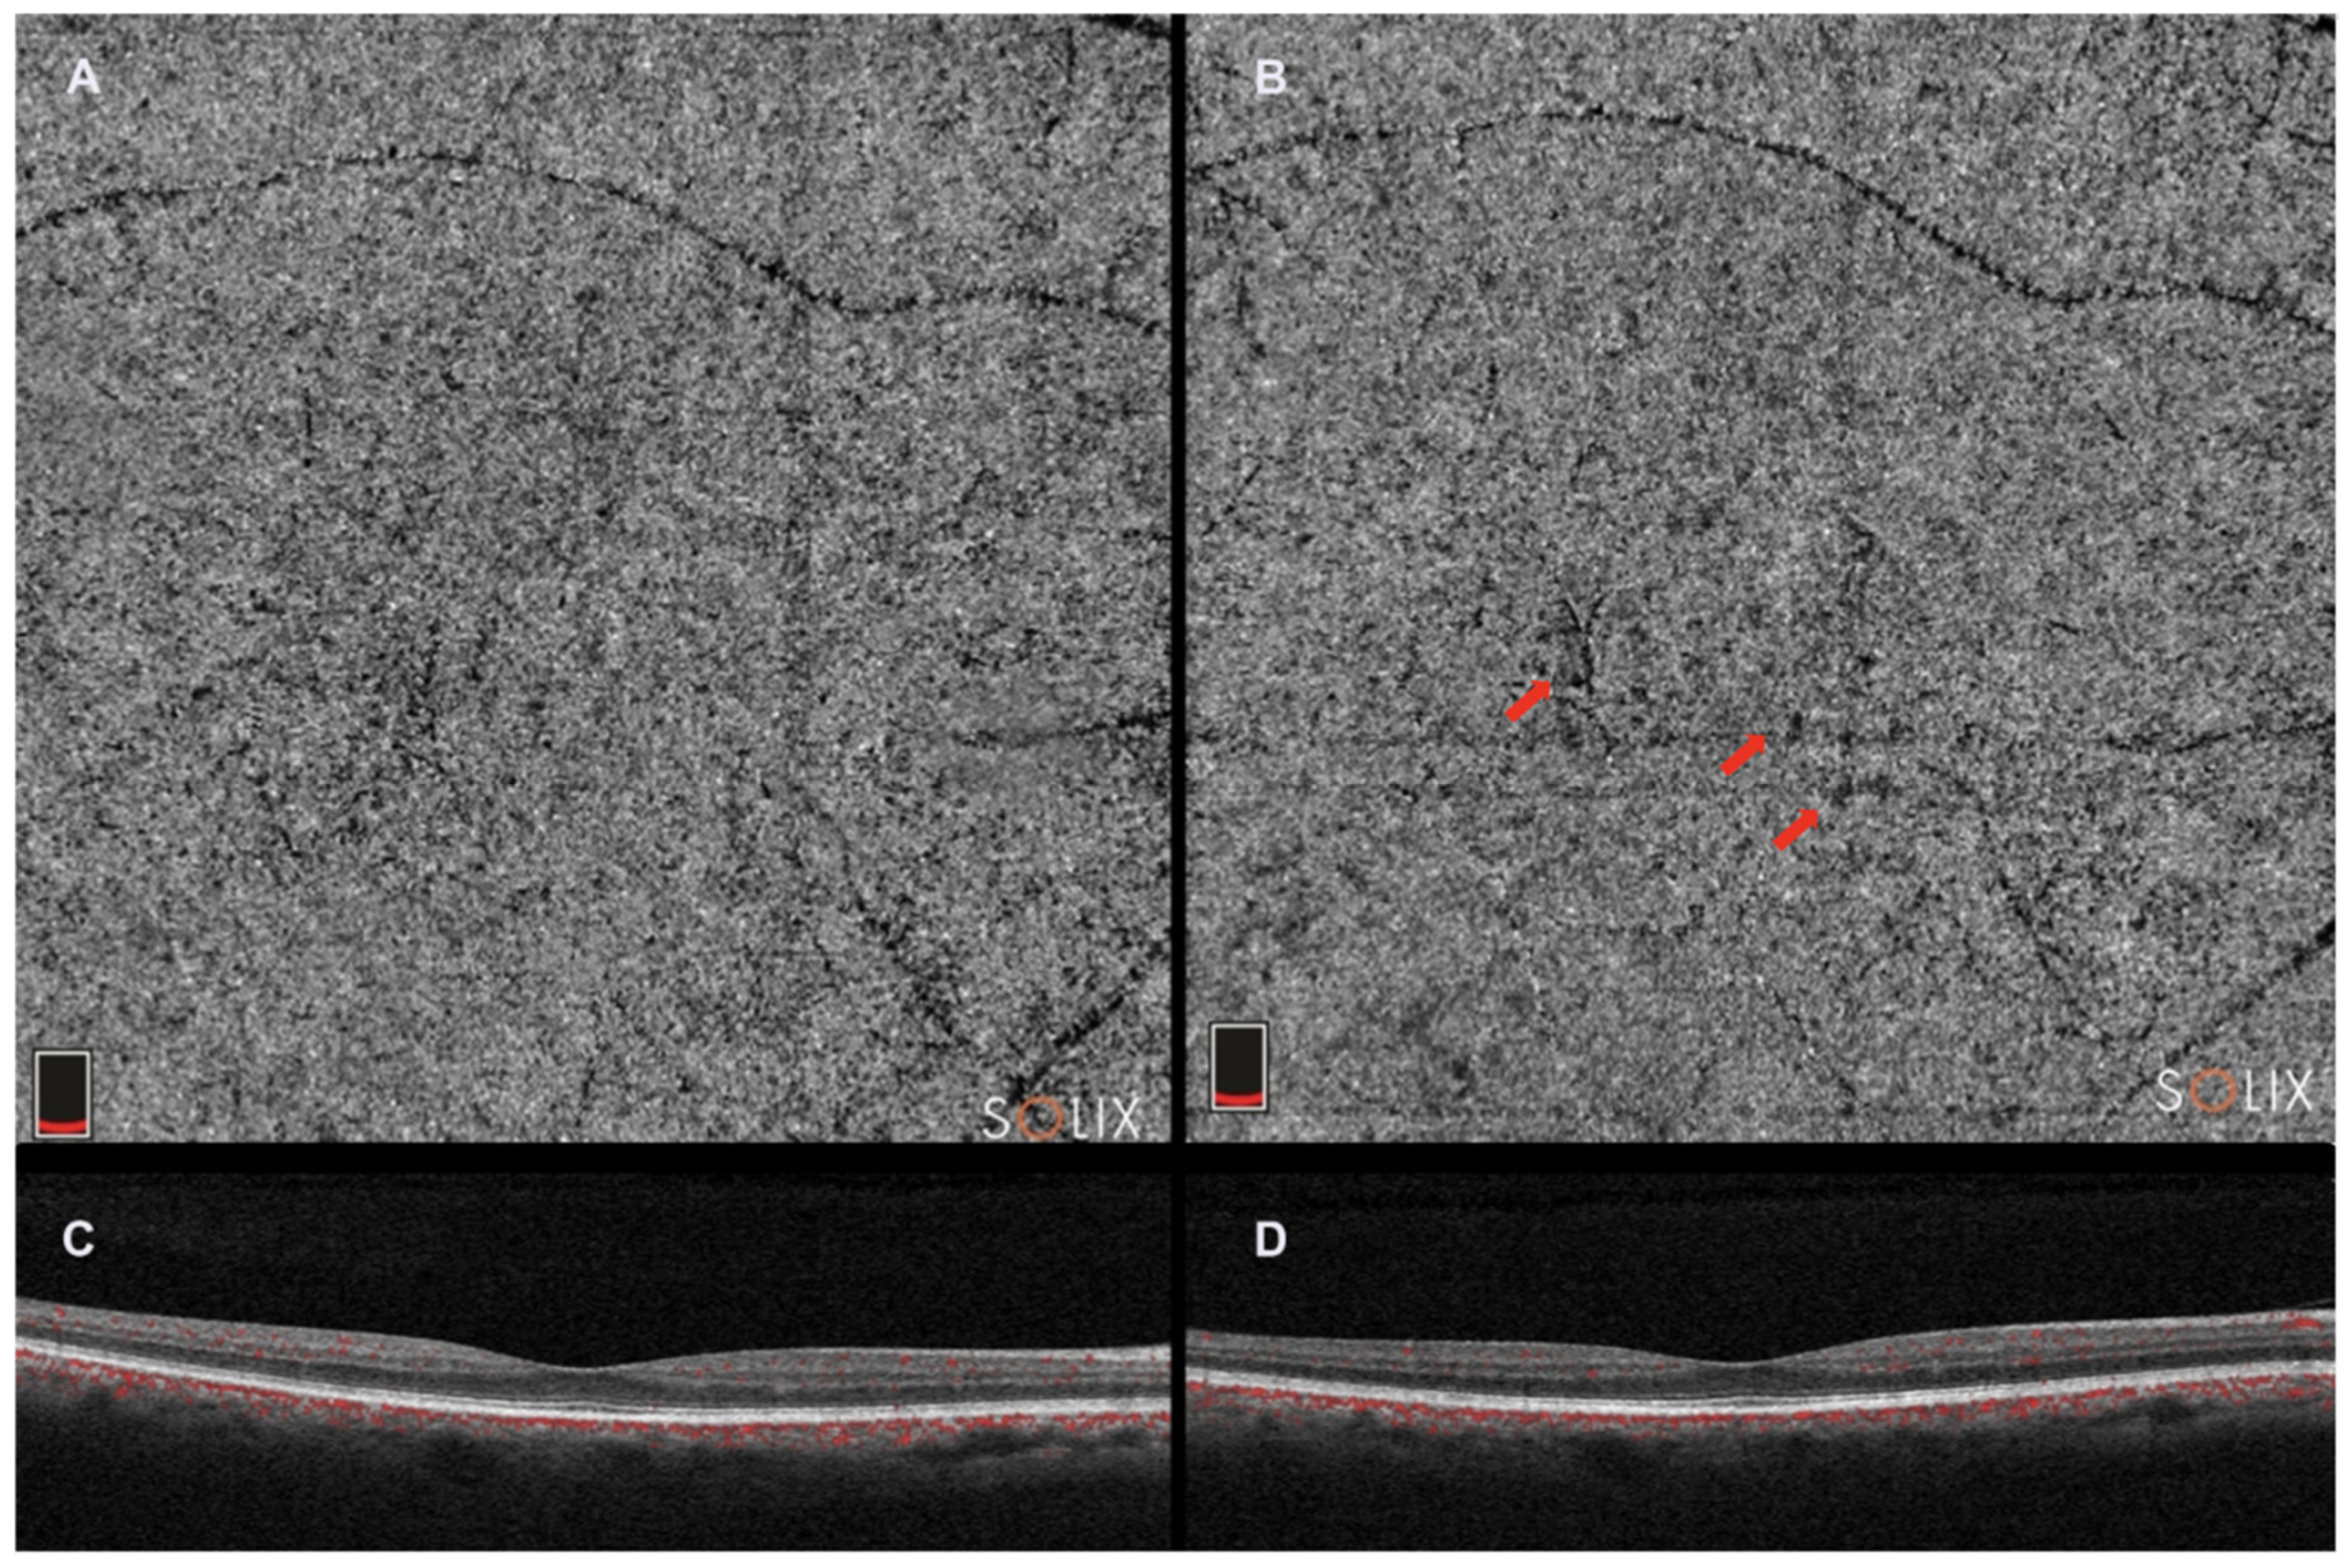
Figure 3. Optical coherence tomography angiography (Solix, Optovue Inc., Freemont, CA, USA). (A). choriocapillaris slab; (C). horizontal b-scan image; and (B,D). choriocapillaris slab and horizontal b-scan image in the same patient 2 years after. Red arrows indicate choriocapillaris flow deficits in the choricocapillaris angio slab.
The interscan time is a crucial factor in OCTA motion contrast detection [58,59,60][53][54][55]. When other parameters remain constant, longer interscan times enhance motion sensitivity as more time elapses between repeated B-scans. However, this might lead to increased mass eye movements that can overpower the blood flow signal [61][56]. On the other hand, shorter interscan times reduce motion sensitivity, but also minimize the adverse impact of mass eye movements. Additionally, shorter interscan times are more effective in detecting flow impairment [48][43]. Commercial instruments have interscan times of 4–5 ms, while high-speed research instruments may have interscan times of 1.5 ms or less.
Another limitation of OCTA is its reliance on motion contrast to visualize the microvasculature, necessitating multiple re-scans of the same retinal location in its imaging protocols. As a result, OCTA demands higher imaging speeds or longer acquisition times compared to structural SDOCT. Moreover, OCTA lacks the ability to assess permeability changes or vascular leakage, which are commonly visualized through FA or ICGA. The appearance of OCTA image data is heavily influenced by various factors, including the specifics of the SDOCT instrument, scanning protocols, signal processing, and methods employed to derive the OCTA information from the structural SDOCT data. Algorithms can vary significantly between different types of OCT instruments. Therefore, particular care should be taken when comparing the results between different instruments. Finally, OCTA images may have many more types of artifacts than structural images and thus may be vulnerable to misinterpretation [49,62,63][44][57][58].
References
- Nickla, D.L.; Wallman, J. The Multifunctional Choroid. Prog. Retin. Eye Res. 2010, 29, 144–168.
- Lejoyeux, R.; Benillouche, J.; Ong, J.; Errera, M.-H.; Rossi, E.A.; Singh, S.R.; Dansingani, K.K.; da Silva, S.; Sinha, D.; Sahel, J.-A.; et al. Choriocapillaris: Fundamentals and Advancements. Prog. Retin. Eye Res. 2022, 87, 100997.
- Pichi, F.; Aggarwal, K.; Neri, P.; Salvetti, P.; Lembo, A.; Nucci, P.; Gemmy Cheung, C.M.; Gupta, V. Choroidal Biomarkers. Indian J. Ophthalmol. 2018, 66, 1716–1726.
- Bill, A.; Sperber, G.; Ujiie, K. Physiology of the Choroidal Vascular Bed. Int. Ophthalmol. 1983, 6, 101–107.
- Olver, J.M. Functional Anatomy of the Choroidal Circulation: Methyl Methacrylate Casting of Human Choroid. Eye 1990, 4 Pt 2, 262–272.
- Fryczkowski, A.W.; Sherman, M.D. Scanning Electron Microscopy of Human Ocular Vascular Casts: The Submacular Choriocapillaris. Acta Anat. 1988, 132, 265–269.
- Krebs, W.; Krebs, I.P. Ultrastructural Evidence for Lymphatic Capillaries in the Primate Choroid. Arch. Ophthalmol. 1988, 106, 1615–1616.
- Formisano, M.; di Pippo, M.C.; Scuderi, L.; Abdolrahimzadeh, S. Current Concepts on Diffuse Choroidal Hemangioma in Sturge Weber Syndrome. Ophthalmic Genet. 2021, 42, 375–382.
- Di Pippo, M.; Ciancimino, C.; Scuderi, L.; Perdicchi, A. An Iconic Case of Pigmentary Glaucoma: Brief Review of the Literature. Case Rep. Ophthalmol. 2020, 11, 377–384.
- Ko, T.H.; Fujimoto, J.G.; Schuman, J.S.; Paunescu, L.A.; Kowalevicz, A.M.; Hartl, I.; Drexler, W.; Wollstein, G.; Ishikawa, H.; Duker, J.S. Comparison of Ultrahigh- and Standard-Resolution Optical Coherence Tomography for Imaging Macular Pathology. Ophthalmology 2005, 112, 1922.e1–1922.e15.
- Schuman, S.G.; Koreishi, A.F.; Farsiu, S.; Jung, S.; Izatt, J.A.; Toth, C.A. Photoreceptor Layer Thinning over Drusen in Eyes with Age-Related Macular Degeneration Imaged In Vivo with Spectral Domain Optical Coherence Tomography. Ophthalmology 2009, 116, 488–496.e2.
- Eandi, C.M.; De Geronimo, D.; Giannini, D.; Polito, M.S.; Tosi, G.M.; Neri, G.; Le Mer, Y.; Varano, M.; Parravano, M. Baseline SD-OCT Characteristics of Diabetic Macular Oedema Patterns Can Predict Morphological Features and Timing of Recurrence in Patients Treated with Dexamethasone Intravitreal Implants. Acta Diabetol. 2020, 57, 867–874.
- De Bats, F.; Wolff, B.; Mauget-Faÿsse, M.; Scemama, C.; Kodjikian, L. B-Scan and “En-Face” Spectral-Domain Optical Coherence Tomography Imaging for the Diagnosis and Followup of Acute Retinal Pigment Epitheliitis. Case Rep. Med. 2013, 2013, e260237.
- Wolff, B.; Matet, A.; Vasseur, V.; Sahel, J.-A.; Mauget-Faÿsse, M. En Face OCT Imaging for the Diagnosis of Outer Retinal Tubulations in Age-Related Macular Degeneration. J. Ophthalmol. 2012, 2012, 542417.
- Spaide, R.F.; Koizumi, H.; Pozzoni, M.C. Enhanced Depth Imaging Spectral-Domain Optical Coherence Tomography. Am. J. Ophthalmol. 2008, 146, 496–500.
- Moult, E.; Choi, W.; Waheed, N.K.; Adhi, M.; Lee, B.; Lu, C.D.; Jayaraman, V.; Potsaid, B.; Rosenfeld, P.J.; Duker, J.S.; et al. Ultrahigh-Speed Swept-Source OCT Angiography in Exudative AMD. Ophthalmic. Surg. Lasers Imaging Retin. 2014, 45, 496–505.
- Corvi, F.; Pellegrini, M.; Erba, S.; Cozzi, M.; Staurenghi, G.; Giani, A. Reproducibility of Vessel Density, Fractal Dimension, and Foveal Avascular Zone Using 7 Different Optical Coherence Tomography Angiography Devices. Am. J. Ophthalmol. 2018, 186, 25–31.
- Zhang, Q.; Chen, C.-L.; Chu, Z.; Zheng, F.; Miller, A.; Roisman, L.; Rafael de Oliveira Dias, J.; Yehoshua, Z.; Schaal, K.B.; Feuer, W.; et al. Automated Quantitation of Choroidal Neovascularization: A Comparison Study between Spectral-Domain and Swept-Source OCT Angiograms. Investig. Ophthalmol. Vis. Sci. 2017, 58, 1506–1513.
- Corvi, F.; Cozzi, M.; Barbolini, E.; Nizza, D.; Belotti, M.; Staurenghi, G.; Giani, A. Comparison between several optical coherence tomography angiography devices and indocyanine green angiography of choroidal neovascularization. Retina 2020, 40, 873–880.
- Coleman, D.J.; Lizzi, F.L. In Vivo Choroidal Thickness Measurement. Am. J. Ophthalmol. 1979, 88, 369–375.
- Abdolrahimzadeh, S.; Scavella, V.; Battaglia, D.; Recupero, S.M. Spectral Domain Optical Coherence Tomography of Choroidal and Outer Retinal Layer Thickness in the Sturge Weber Syndrome. Curr. Eye Res. 2016, 41, 1614–1617.
- Abdolrahimzadeh, S.; Di Pippo, M.; Ciancimino, C.; Di Staso, F.; Lotery, A.J. Choroidal Vascularity Index and Choroidal Thickness: Potential Biomarkers in Retinitis Pigmentosa. Eye 2022, 37, 1766–1773.
- Kim, Y.H.; Oh, J. Choroidal Thickness Profile in Chorioretinal Diseases: Beyond the Macula. Front. Med. 2021, 8, 797428.
- Mrejen, S.; Spaide, R.F. Optical Coherence Tomography: Imaging of the Choroid and Beyond. Surv. Ophthalmol. 2013, 58, 387–429.
- Abdolrahimzadeh, S.; Parisi, F.; Scavella, V.; Recupero, S.M. Optical coherence tomography evidence on the correlation of choroidal thickness and age with vascularized retinal layers in normal eyes. Retina 2016, 36, 2329–2338.
- Margolis, R.; Spaide, R.F. A Pilot Study of Enhanced Depth Imaging Optical Coherence Tomography of the Choroid in Normal Eyes. Am. J. Ophthalmol. 2009, 147, 811–815.
- Gharbiya, M.; Giustolisi, R.; Marchiori, J.; Bruscolini, A.; Mallone, F.; Fameli, V.; Nebbioso, M.; Abdolrahimzadeh, S. Comparison of Short-Term Choroidal Thickness and Retinal Morphological Changes after Intravitreal Anti-VEGF Therapy with Ranibizumab or Aflibercept in Treatment-Naive Eyes. Curr. Eye Res. 2018, 43, 391–396.
- Jiang, X.; Xiao, P.; Tan, Q.; Zhu, Y. Variation of Choroidal Thickness during the Waking Period over Three Consecutive Days in Different Degrees of Myopia and Emmetropia Using Optical Coherence Tomography. PeerJ 2023, 11, e15317.
- Tan, K.-A.; Gupta, P.; Agarwal, A.; Chhablani, J.; Cheng, C.-Y.; Keane, P.A.; Agrawal, R. State of Science: Choroidal Thickness and Systemic Health. Surv. Ophthalmol. 2016, 61, 566–581.
- Keenan, T.D.; Klein, B.; Agrón, E.; Chew, E.Y.; Cukras, C.A.; Wong, W.T. Choroidal thickness and vascularity vary with disease severity and subretinal drusenoid deposit presence in nonadvanced age-related macular degeneration. Retina 2020, 40, 632–642.
- Agrawal, R.; Gupta, P.; Tan, K.-A.; Cheung, C.M.G.; Wong, T.-Y.; Cheng, C.-Y. Choroidal Vascularity Index as a Measure of Vascular Status of the Choroid: Measurements in Healthy Eyes from a Population-Based Study. Sci. Rep. 2016, 6, 21090.
- Sonoda, S.; Sakamoto, T.; Yamashita, T.; Uchino, E.; Kawano, H.; Yoshihara, N.; Terasaki, H.; Shirasawa, M.; Tomita, M.; Ishibashi, T. Luminal and Stromal Areas of Choroid Determined by Binarization Method of Optical Coherence Tomographic Images. Am. J. Ophthalmol. 2015, 159, 1123–1131.e1.
- Sonoda, S.; Sakamoto, T.; Yamashita, T.; Shirasawa, M.; Uchino, E.; Terasaki, H.; Tomita, M. Choroidal Structure in Normal Eyes and after Photodynamic Therapy Determined by Binarization of Optical Coherence Tomographic Images. Investig. Ophthalmol. Vis. Sci. 2014, 55, 3893–3899.
- Abdolrahimzadeh, S.; Fragiotta, S.; Ciacimino, C.; Di Pippo, M.; Scuderi, G. Choroidal Vascularity Index in Adult-Onset Foveomacular Vitelliform Dystrophy: A Pilot Study. Appl. Sci. 2021, 11, 10487.
- Oh, J.; Baik, D.J.; Ahn, J. Inter-Relationship between Retinal and Choroidal Vasculatures Using Optical Coherence Tomography Angiography in Normal Eyes. Eur. J. Ophthalmol. 2020, 30, 48–57.
- Iovino, C.; Pellegrini, M.; Bernabei, F.; Borrelli, E.; Sacconi, R.; Govetto, A.; Vagge, A.; Di Zazzo, A.; Forlini, M.; Finocchio, L.; et al. Choroidal Vascularity Index: An In-Depth Analysis of This Novel Optical Coherence Tomography Parameter. J. Clin. Med. 2020, 9, 595.
- Ruiz-Medrano, J.; Ruiz-Moreno, J.M.; Goud, A.; Vupparaboina, K.K.; Jana, S.; Chhablani, J. Age-related changes in choroidal vascular density of healthy subjects based on image binarization of swept-source optical coherence tomography. Retina 2018, 38, 508–515.
- Singh, S.R.; Rasheed, M.A.; Goud, A.; Sahoo, N.K.; Vupparaboina, K.K.; Chhablani, J. Diurnal Variation in Subfoveal and Peripapillary Choroidal Vascularity Index in Healthy Eyes. Indian J. Ophthalmol. 2019, 67, 1667–1672.
- Ting, D.S.W.; Yanagi, Y.; Agrawal, R.; Teo, H.Y.; Seen, S.; Yeo, I.Y.S.; Mathur, R.; Chan, C.M.; Lee, S.Y.; Wong, E.Y.M.; et al. Choroidal Remodeling in Age-Related Macular Degeneration and Polypoidal Choroidal Vasculopathy: A 12-Month Prospective Study. Sci. Rep. 2017, 7, 7868.
- Agrawal, R.; Seen, S.; Vaishnavi, S.; Vupparaboina, K.K.; Goud, A.; Rasheed, M.A.; Chhablani, J. Choroidal Vascularity Index Using Swept-Source and Spectral-Domain Optical Coherence Tomography: A Comparative Study. Ophthalmic Surg. Lasers Imaging Retin. 2019, 50, e26–e32.
- Betzler, B.K.; Ding, J.; Wei, X.; Lee, J.M.; Grewal, D.S.; Fekrat, S.; Sadda, S.R.; Zarbin, M.A.; Agarwal, A.; Gupta, V.; et al. Choroidal Vascularity Index: A Step towards Software as a Medical Device. Br. J. Ophthalmol. 2022, 106, 149–155.
- Agrawal, R.; Ding, J.; Sen, P.; Rousselot, A.; Chan, A.; Nivison-Smith, L.; Wei, X.; Mahajan, S.; Kim, R.; Mishra, C.; et al. Exploring Choroidal Angioarchitecture in Health and Disease Using Choroidal Vascularity Index. Prog. Retin. Eye Res. 2020, 77, 100829.
- Spaide, R.F.; Fujimoto, J.G.; Waheed, N.K.; Sadda, S.R.; Staurenghi, G. Optical Coherence Tomography Angiography. Prog. Retin. Eye Res. 2018, 64, 1–55.
- Spaide, R.F.; Fujimoto, J.G.; Waheed, N.K. Image artifacts in optical coherence tomography angiography. Retina 2015, 35, 2163–2180.
- Coscas, G.; Lupidi, M.; Coscas, F. Image Analysis of Optical Coherence Tomography Angiography. Dev. Ophthalmol. 2016, 56, 30–36.
- Hamada, M.; Ohkoshi, K.; Inagaki, K.; Ebihara, N.; Murakami, A. Visualization of Microaneurysms Using Optical Coherence Tomography Angiography: Comparison of OCTA En Face, OCT B-Scan, OCT En Face, FA, and IA Images. Jpn. J. Ophthalmol. 2018, 62, 168–175.
- Sohrab, M.; Wu, K.; Fawzi, A.A. A Pilot Study of Morphometric Analysis of Choroidal Vasculature in Vivo, Using En Face Optical Coherence Tomography. PLoS ONE 2012, 7, e48631.
- Choi, W.; Mohler, K.J.; Potsaid, B.; Lu, C.D.; Liu, J.J.; Jayaraman, V.; Cable, A.E.; Duker, J.S.; Huber, R.; Fujimoto, J.G. Choriocapillaris and Choroidal Microvasculature Imaging with Ultrahigh Speed OCT Angiography. PLoS ONE 2013, 8, e81499.
- Spaide, R.F. Peau d’orange and Angioid Streaks: Manifestations of Bruch Membrane Pathology. Retina 2015, 35, 392–397.
- Motaghiannezam, R.; Schwartz, D.M.; Fraser, S.E. In Vivo Human Choroidal Vascular Pattern Visualization Using High-Speed Swept-Source Optical Coherence Tomography at 1060 Nm. Investig. Ophthalmol. Vis. Sci. 2012, 53, 2337–2348.
- Spaide, R.F. Optical Coherence Tomography Angiography Signs of Vascular Abnormalization with Antiangiogenic Therapy for Choroidal Neovascularization. Am. J. Ophthalmol. 2015, 160, 6–16.
- Spaide, R.F. Choriocapillaris Flow Features follow a Power Law Distribution: Implications for Characterization and Mechanisms of Disease Progression. Am. J. Ophthalmol. 2016, 170, 58–67.
- Braaf, B.; Vermeer, K.A.; Vienola, K.V.; de Boer, J.F. Angiography of the Retina and the Choroid with Phase-Resolved OCT Using Interval-Optimized Backstitched B-Scans. Opt. Express 2012, 20, 20516–20534.
- Choi, W.; Moult, E.M.; Waheed, N.K.; Adhi, M.; Lee, B.; Lu, C.D.; de Carlo, T.E.; Jayaraman, V.; Rosenfeld, P.J.; Duker, J.S.; et al. Ultrahigh-Speed, Swept-Source Optical Coherence Tomography Angiography in Nonexudative Age-Related Macular Degeneration with Geographic Atrophy. Ophthalmology 2015, 122, 2532–2544.
- Tokayer, J.; Jia, Y.; Dhalla, A.-H.; Huang, D. Blood Flow Velocity Quantification Using Split-Spectrum Amplitude-Decorrelation Angiography with Optical Coherence Tomography. Biomed. Opt. Express 2013, 4, 1909–1924.
- Chen, T.-H.; Wu, Y.-C.; Tsai, T.-Y.; Chueh, C.-B.; Huang, B.-H.; Huang, Y.-P.; Tsai, M.-T.; Yasuno, Y.; Lee, H.-C. Effect of A-Scan Rate and Interscan Interval on Optical Coherence Angiography. Biomed. Opt. Express 2021, 12, 722–736.
- Cole, E.D.; Moult, E.M.; Dang, S.; Choi, W.; Ploner, S.B.; Lee, B.; Louzada, R.; Novais, E.; Schottenhamml, J.; Husvogt, L.; et al. The Definition, Rationale, and Effects of Thresholding in OCT Angiography. Ophthalmol. Retin. 2017, 1, 435–447.
- Ghasemi Falavarjani, K.; Al-Sheikh, M.; Akil, H.; Sadda, S.R. Image Artefacts in Swept-Source Optical Coherence Tomography Angiography. Br. J. Ophthalmol. 2017, 101, 564–568.
More