Your browser does not fully support modern features. Please upgrade for a smoother experience.
Please note this is a comparison between Version 1 by Jose Manuel Lopez-Guede and Version 2 by Rita Xu.
The degradation and safety study of lithium-ion batteries is becoming increasingly important given that these batteries are widely used not only in electronic devices but also in automotive vehicles. Consequently, the detection of degradation modes that could lead to safety alerts is essential. Existing methodologies are diverse, experimental based, model based, and the new trends of artificial intelligence.
- Li-ion battery
- safety
- degradation mechanism
1. Introduction
The performance of lithium-ion batteries (LIBs) decreases with use due to parasitic reactions occurring at the positive and negative electrodes and even in the electrolyte [1][2][3][1,2,3]. This degradation is caused by the interaction of chemical and physical mechanisms within the cell, resulting in power and capacity loss.
As summarized in Figure 1, LIBs are degraded by various aging factors or external conditions, ranging from elevated temperature to mechanical stress, among others, leading to performance loss or failure to operate in safe conditions [3][4][3,4].
1.1. Degradation Mechanisms for LIBs
The interrelated cause–effect connections or degradation process between the aging factors and the degradation mechanisms are diverse, and many occur simultaneously. The best-known degradation processes are SEI growth, electrode particle cracking, electrolyte decomposition, and delamination [5][6][7][8][9][5,6,7,8,9]. Although diverse in origin and nature, they have a limited electrochemical response [10]. It is also common to classify degradation processes into the categories of degradation mechanisms (DMs) listed in Figure 1 [10][11][12][10,11,12].
The degradation mechanisms are very diverse. Considering thermodynamics as the main degradation axis of a lithium-ion cell, loss of lithium inventory (LLI), loss of active material of the negative electrode (or anode) (LAMNE), loss of the active material of the positive electrode (or cathode) (LAMPE), and kinetic alterations resulting in capacity fade or power fade are considered to be the predominant ones, as mentioned in the previous section [2][8][11][2,8,11].
-
LLI: Parasitic reactions such as surface film formation (SEI), decomposition reactions, or lithium plating are the cause of lithium consumption in batteries. This leads to a lack of cycling between the positive and negative electrodes, resulting in a drop in the cell’s capacity. In addition, SEI can cause a loss of power [11].
-
LAMNE: Due to cracking and the loss of electrical contact or the blocking of active sites by resistive surface layers, the active mass of the NE is no longer available, and hence, lithium insertion ceases. This leads to a reduction in the capacity of the battery power [11].
-
LAMPE: Due to structural disorders, particle cracking, or loss of electrical contact, the active mass of the PE is no longer available and insertion ceases, causing the capacity and the power of the battery to decrease [11].
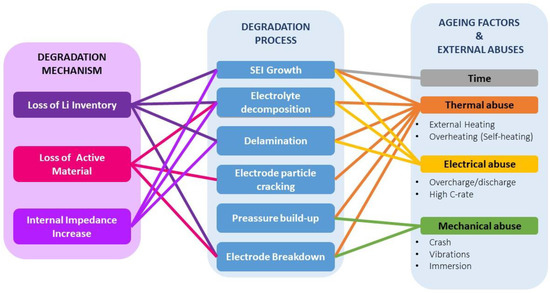
Figure 1. Relation of aging factors and external abuses with their respective degradation processes and mechanisms.
1.2. LIB Safety Management
Some of the DMs can generate operating conditions in lithium batteries that generate risky or unsafe situations.
The study of lithium-ion battery degradation and safety is gaining importance due to the widespread use of LIBs in electronic devices and vehicles. Therefore, it is crucial to detect degradation modes that may pose safety risks. Developing new models that help understand the relationships between aging factors, degradation processes, degradation mechanisms, and safety condition estimators is a challenge for manufacturers and operators alike.
For electrochemical and thermal stabilities, lithium-ion batteries need to operate within specific temperature and voltage ranges to ensure safety [13][14][15][15,16,17]. These ranges can be compromised due to improper usage, such as overcharging, over-discharging, high temperatures, or vibrations [13][16][17][13,15,18]. Once the temperature of the battery exceeds a certain level, self-sustaining exothermic cascade reactions can be triggered and the heat generated can no longer be dissipated efficiently, which could end up causing a thermal runaway (TR) [16][18][13,19]. To prevent a hazard, in electric vehicle (EV) applications batteries are positioned centrally, and cooling systems and battery management systems (BMS) are employed [13][14][15][17][15,16,17,18]. When considering safety, the analyzed system has its importance, as the study of an individual cell is different than that of a battery pack. In addition, three different safety-level categories exist: cell design, abuse tolerance, and parts per billion (PPB). Cell design safety level corresponds to materials and process conditions. Cell manufacturers try to automatize the process, making it more efficient together with quality controls based on optical and X-ray inspection techniques. Moreover, these quality control tests search for electrode misalignments, the presence of metal contaminants, and so on [19][20]. Abuse tolerance also corresponds to cell safety level, and the cell is tested in conditions outside of those estimated by the supplier. Cells that tolerate these abuse conditions without venting or self-destructions are essential. Nevertheless, global safety is not ensured. Finally, PPB-level safety consists of Li-ion cells operating under recommended conditions that failed. In this category the main failure mode is TR [19][20].
Various methods are being explored to prevent this phenomenon. Some studies focused on adding additives to shield the battery from overcharging [16][20][21][13,21,22]. Others aimed to protect the battery from overheating through strategies like enhancing cathode and anode materials, using thermoprotective separators, or incorporating flame retardants [22][23][24][25][26][23,24,25,26,27]. Additionally, modern battery management systems and battery thermal management systems are gaining popularity [27][28][29][28,29,30].
1.3. Methodologies for Hazard Detection in LIBs
Furthermore, safety tests for batteries can be categorized into three groups based on the type of abuse condition: thermal, electrical, or mechanical [30][31][31,32]. Thermal abuse tests subject batteries to high temperatures, either directly or indirectly, to assess their thermal stability and predict the occurrence of thermal runaway (TR) [32][33][33,34]. Thermal abuse tests subject batteries to high temperatures, either directly or indirectly, to assess their thermal stability and predict the occurrence of thermal runaway TR [34][35][36][37][35,36,37,38]. Mechanical abuse entails deforming the battery to create a short circuit and initiate TR [38][39]. It is worth noting that modeling the failure process of one or multiple batteries is complex, and although thermal, electric, and electrochemical models exist, the current trend is to use multi-physics models that combine multiple models, such as electric and thermal, to seek comprehensive answers [39][40][41][42][40,41,42,43].
The internal resistance and electrochemical reactions in lithium-ion batteries generate heat [16][27][13,28]. Overcharging the battery during charge and discharge operations can produce additional thermal energy, which must be effectively managed to avoid thermal runaway (TR) or explosions. Battery management systems (BMS) located inside the batteries are responsible for preventing overcharging and over-discharging, thereby extending the battery’s lifespan. A BMS also monitors various factors related to degradation mechanisms and safety (DM&S), including the state of charge (SOC), state of health (SOH), operating status, and safety status. Additionally, the BMS ensures energy balance within battery packs, monitors temperature, and provides real-time information to external devices such as electric motors, chargers, and data loggers [27][28][43][28,29,44].
In contrast, a BTMS (battery thermal management system) regulates the temperature inside the battery pack for both high and low temperatures to avoid overheating and achieve an improvement in electrochemical performance. In addition to ensuring cooling, it guarantees temperature homogeneity and optimum operating temperature [29][44][45][30,45,46]. This system can decrease the internal resistance but cannot cope with the heat generated by the internal electrochemical reactions. Nowadays, BTMS has been applied as a key and integral part to maintain the temperature in an optimum range [45][46].
Reliability and safety concerns arise from DMs [1][5][1,5]. Estimating the battery’s state of health (SOH) and state of charge (SOC) enables the study, diagnosis, and prediction of DMs [46][47][47,48]. Various methodologies exist, including experimental testing, physical modeling, data-driven approaches, and hybrid methods, each of which have strengths and challenges [48][49][50][49,50,51]. Experimental methods require time and scientific knowledge for data interpretation, whereas physical models rely on extensive experimental databases [51][52]. Data-driven methods have gained importance and consistency, with initial models being constructed and refined using abundant data to align with the collected information [52][53][53,54].
Feinauer et al. proposed combining data from various sensors (temperature, voltage, resistance, audio, ultrasound transmission, and reflection) to estimate the safety level of the cell [54][55]. Data-driven approaches are valuable for studying battery health due to the correlation between the state of health (SOH) and electrical, thermal, and mechanical behaviors. Lifetime estimation models have gained popularity due to their ability to fit extensive data collected under controlled experimental conditions. These models exhibit high computational efficiency and acceptable accuracy under similar operating conditions [52][53][53,54].
Data-driven methods are gaining prominence in real-world applications for battery health estimation and prediction. These methods provide advantages over complex physical models and are increasingly preferred.
According to data-driven methodologies, one of the approaches that is gaining popularity is the use of artificial intelligence (AI) and machine learning (ML) together with neural networks (NNs) and deep learning (DL) [55][56][57][58][56,57,58,59]. Machine learning methods, known for their flexibility and nonlinear matching capabilities, are highly favored for health estimation and prediction. Specialized aging tests considering multiple factors that impact battery health are conducted to generate a suitable training dataset. Intelligent techniques are then used to map these factors to the battery’s health state, synthesizing an underlying relation. The advances in capacity processors, communications, and AI are increasingly being used to predict and diagnose the SOH and the SOC along with battery DMs. DL algorithms are the most widely used. The database that feeds these algorithms at their core includes images, text, or time series, which, translated to the battery field, would correspond to current, voltage, temperature, temperature maps, time series, charge/discharge cycles, or calendar aging [59][60][61][60,61,62]. On top of the growing sophistication of the algorithms required, the quantity of data needed for training and validation is also critical, as battery data generation is challenging and time-consuming [62][63][64][63,64,65]. The existing datasets, despite providing invaluable information, are sparse and only provide data from a few cells under limited test conditions [65][66][66,67]. Hence, this is a major obstacle to the application of DL algorithms, as large amounts of data are needed for the training process. Nonetheless, initiatives such as battery archives and battery data genomes are facilitating future work [66][67].
2. Conventional DM&S Estimation Methods
2.1. Experiment-Based Methods
Experimental methods are of considerable importance in the assessment of the SOH and the DM&S of batteries. They are usually laboratory based due to the need for specific equipment and often are time-consuming, involving many procedures [7][67][7,68]. During the process there may be systematic errors and external factors that affect the results obtained. The battery behavior is obtained by the voltage, current, and temperature applied directly, like capacity measurements or impedance measurements. Other indirect measurements [12] are the optimization and processing of data to locate parameters, the load curve method, ICA (Incremental Capacity Analysis) and DVA(Differential Voltage Analysis), and ultrasonic inspection [12][50][12,51].2.1.1. Internal Resistance
One of the methodologies that plays a significant role is internal resistance measurement, which provides substantial information about the end of life of a battery [12][49][68][12,50,69]. It consists of the resistance of a substance when an electric current passes through. There are several factors affecting the internal resistance of a battery, such as the constituent materials and their structure, state of charge (SOC), electrolyte internal temperature, load current, battery capacity, and rate of discharge of the battery [69][70][70,71]. Furthermore, polarization resistance (PR) and ohmic resistance (OR) are the two main contributions of internal resistance. In addition, OR contributes to the contact resistance of the separator, electrolyte, and electrode material cell components [49][71][50,72]. However, PR consists of the conversion state between the electrodes and the electrolyte during the correspondent electrochemical reactions. Therefore, it could be said that the increase in internal capacity is directly related to battery capacity and discharge time. It is important to remark that even if it is a time-consuming and non-suitable technique for online assessment, it is reliable, noninvasive, direct, and widely used as an indicator for charge evaluation [49][67][72][73][50,68,73,74]. One of the most common methods is the current pulse method, based on Ohm’s law. It consists of measuring the voltage drop of a battery for a given current, then calculating the internal resistance with the following equation [67][68]:2.1.2. Electrochemical Impedance Spectroscopy
Another non-destructive or non-invasive technique is electrochemical impedance spectroscopy (EIS) [12][49][12,50]. Impedance is the total resistance of a device or circuit to the flow of an alternating current at a certain given frequency. It is commonly used to predict the aging state of a battery by providing information about the tested coin cell, reaction kinetics, local corrosion rate, electrochemical mechanisms, and remaining useful life (RUL) of a lithium-ion battery [50][74][75][51,75,76]. This methodology offers the opportunity to study both solid and liquid materials, i.e., insulators, semiconductors, and mixed and ionic materials. EIS enables the study of charge transfer in heterogeneous systems with the possibility of chemical sensors, fuel cells, and corrosion processes [12][49][51][76][77][12,50,52,77,78]. Furthermore, it can be applied in diverse ways depending on the purpose of the experiment. This choice would depend on the specific conditions and the range of measurement requirements, the accuracy of the measurement, and the ease of experimentation [50][78][51,79]. Depending on the test, it is applied in various ways, although always dependent on the specific conditions, the range requirements, the accuracy of the measurement, and the experimental facility. Finally, as it is a non-destructive methodology, battery cell disassembly is not needed. In this way, cells are protected from moisture and oxygen [12][79][80][12,80,81]. In addition, it is a technique that could be applied in operando conditions. It is time-consuming and only applicable for stable environments. Nevertheless, it provides an accurate estimation of the RUL and predicts battery degradation [49][50].2.1.3. Battery Capacity Measurement
Battery capacity measurement corresponds to the amount of energy contained in a battery, which deteriorates over time [49][81][82][50,82,83]. It reflects the amount of energy that is storable in that battery. Energetic capacity corresponds to the energy that can be removed or retained in a LIB [7][83][7,84]. Battery capacity measurement is the fastest method. Nonetheless, it is not suitable for online assessment, but in this case, it is necessary for the battery to be fully charged [84][85].2.1.4. Incremental Capacity Analysis and Differential Voltage Analysis
Incremental capacity analysis (ICA) and differential voltage analysis (DVA) are parameters that change during the operation of batteries, providing the possibility to track their aging by experimental testing [74][85][86][75,86,87]. They are time-consuming techniques, as the curves are obtained at low currents, such as C/20. According to the ICA method, it is considered a valuable method, as accurate battery characteristics are obtained by integrating changes in capacitance and battery voltage. Nevertheless, high-quality research data are required, as are long input preprocessing hours. This methodology is only suitable for LIBs, and it is efficient for analyzing the capacity loss of batteries and is robust and reliable, providing high accuracy [49][67][87][50,68,88]. Figure 2 shows the process of combining both methodologies. It consists of four steps. First, the load tests are performed, and then the voltage-based combination is generated, after which the data are transformed and passed to the SOC-based ones. Finally, by means of fusion algorithms such as Kalman filters or artificial neural network combinations, the desired features are obtained, as described by Zheng et al. [87][88].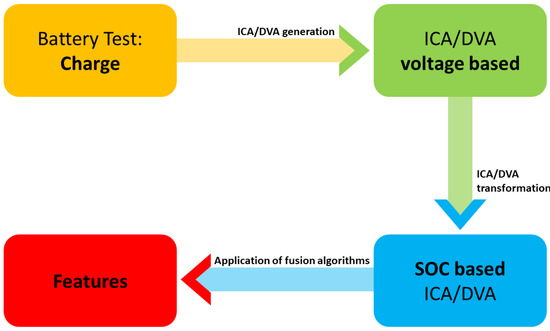
Figure 2. ICA/DVA combination methodology process.