Your browser does not fully support modern features. Please upgrade for a smoother experience.
Please note this is a comparison between Version 1 by Je-Young Lee and Version 2 by Dean Liu.
In contrast to the 20th century’s focus on merely integrating technology into classrooms, the current century propels us to make learning not just technologically advanced, but also more enjoyable and effective. Among the various strategies adopted to achieve this, gamification, or the application of game elements in non-game contexts, has emerged as a promising approach. The concept of gamification was first introduced in 2002 and has since been incorporated into numerous domains, including education, since 2010.
- gamified learning
- meta-analysis
- research synthesis
- English as a foreign language
1. Homogeneity Test and Assessment of Effect Sizes
Before the computation of effect sizes, researchwers conducted a homogeneity test (Q-test). The outcome revealed a significant level of heterogeneity amongst the analyzed studies (Q = 30.848, df = 10, p = 0.001). Notably, about two-thirds of the observed variability in the results across studies (indicated by the I2 statistic of 67.583) was due to true differences in effect sizes rather than merely sampling errors. Considering the typical interpretation of I2 values—25%, 50%, and 75%, corresponding to low, moderate, and high heterogeneity, respectively [1][53], our study unveiled a moderate to high level of heterogeneity.
Card provides three potential options for instances where significant heterogeneity is identified: (1) disregarding the heterogeneity and proceeding with analysis as if the data rwesearchersrere homogeneous, an approach that is typically considered least justifiable; (2) undertaking moderator analyses, which leverage the coded characteristics of the studies, such as methodological features or sample attributes, to predict variances in effect sizes betresearcherseween studies; or (3) adopting an alternative to the Fixed Effect Model, specifically the Random Effect Model, which conceptualizes the population effect size as a distribution rather than a fixed point (pp. 184–185) [2][30]. In response to the detected heterogeneity in this study, researcherswe applied the Random Effects Model to compute the mean effect size, thus mitigating potential errors attributed to the heterogeneity. researchersWe also pursued further investigation into the heterogeneity sources through a subgroup analysis and meta-regression analysis, based on the characteristics of the moderator.
Subsequently, rwesearchers employed Hedges’ g to determine the individual effect size for each study. As shown in Figure 1, the resulting individual effect sizes displayed a range from −0.26 to 1.26. Among these, rwesearchers observed nine instances of positive effect sizes and two of negative, indicating that most studies reported beneficial outcomes.
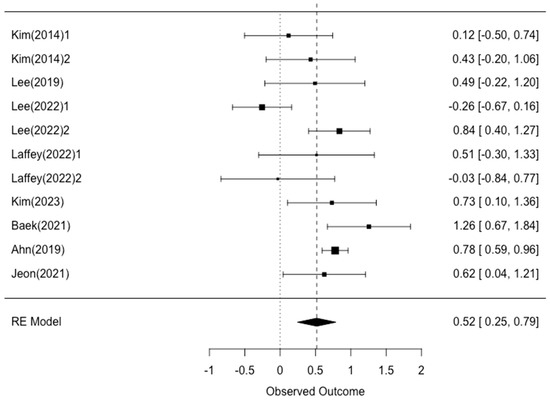
The overall mean effect size, computed via the random-effects model, was 0.517, which signifies a medium effect size (N = 610, k = 11, g = 0.517, se = 0.139, CI = 0.245–0.790, Z = 3.718, p = 0.000). This implies that the employment of gamification-based English instruction can lead to a medium-to-large improvement in English proficiency.
As noted in the previous discussion on related literature, no quantitative meta-analysis has been conducted solely on the impact of gamification on foreign language learning to date. Nonetheless, Bai et al. [11][2] have documented that gamification in diverse educational contexts correlates with a medium effect size (g = 0.504) on academic achievements. Interestingly, they reported a slightly smaller effect size (g = 0.377) for language-related disciplines. While their study did not isolate foreign languages, particularly English, a larger effect size emerged from the findings of the present study. In reviewing the collective findings of past meta-analyses that investigated the influence of gamification on academic achievements across a range of subjects, inclusive of foreign languages, the reported effect sizes typically fall into the medium effect size ([12][34]: g = 0.464; [13][35]: g = 0.49; [14][36]; g = 0.557). Remarkably, these reported effect sizes are closely aligned with the findings from the current study. As such, the evidence suggests that the application of gamification could result in a moderate increase in academic achievements across various disciplines, including English as a Foreign Language.
2. Publication Bias
Publication bias was assessed using various statistical analyses, including a funnel plot with Egger’s Regression Test, Begg’s Rank Correlation Test, Trim and Fill Method, and fail-safe N analysis. Each study’s effect size and standard error reswearchersrere derived, and the resulting funnel plot (Figure 2) shorwesearchersd considerable symmetry. The results from Egger’s Regression Test researchersrewere not statistically significant (z = −0.5410, p = 0.589), suggesting no evidence of funnel plot asymmetry or publication bias in this meta-analysis [15][31].
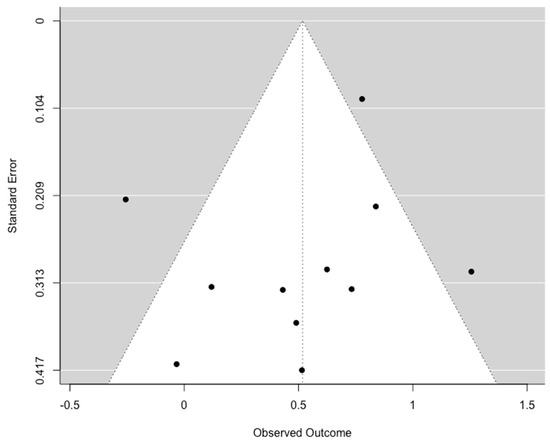
Figure 2. Funnel plot.
The Begg’s Rank Correlation Test measured the correlation betrwesearcherseen the ranks of effect sizes and their variances. A negative Kendall’s tau (−0.2727) suggests smaller studies tended to show smaller effects, but the relationship is not strong. The p-value of 0.283, being greater than 0.05, indicates the asymmetry observed in the funnel plot is not statistically significant. Thus, there is insufficient evidence of publication bias based on this test [16][57].
The Trim and Fill method, a non-parametric technique, estimates potentially missing studies due to publication bias by assessing the funnel plot’s symmetry [17][58]. The method identified no missing studies on the right side of the funnel plot (SE = 2.1765), suggesting no substantial publication bias.
Finally, the fail-safe N was calculated using the Rosenthal approach. The fail-safe N method estimates the number of unpublished studies with null findings that would need to exist to make the meta-analysis finding statistically non-significant. The fail-safe N of this meta-analysis is 197, exceeding Rosenthal’s threshold of 5k + 10 (65 [18]for this study) [59]. Therefore, given the observed significance level of less than 0.0001, the meta-analysis results appear robust and not overly influenced by publication bias.
3. Effect Sizes by Moderating Variables
The noticeable heterogeneity across the study results instigated a more detailed exploration of potential sources [2][30]. The results from each study rwesearchersrere stratified according to various moderators. Subsequently, an analysis was carried out to identify whether these stratified groups manifested statistically significant disparities in their respective effect sizes.
3.1. Subgroup Analysis
For moderators grouped under a nominal scale, a Q-test was utilized to gauge the variances in effect sizes among the subvariables. This classification incorporated five variables. With respect to gaming elements, there rwesearchersrere nine subvariables. Given that numerous studies incorporated a mix of multiple gaming elements, the examination was organized depending on the inclusion or exclusion of each individual element in the experiment.、
- Publication type
Upon assessing the impact of gamification by the type of publication, it was observed that master’s theses (g = 0.799) exhibited a higher effect size than that of journal articles (g = 0.289). Statistical significance was confirmed for these differences via a homogeneity test (Q = 6.426, df = 1, p = 0.011). Interestingly, these findings are in stark contrast to those presented by Huang et al. [12][34], where journal articles (g = 0.662) and conference proceedings (g = 0.666) recorded a medium-to-large effect size, while dissertations/theses exhibited a negative effect size (g = −0.170).
Numerous studies concerning publication bias warn of an increased propensity for published studies to exhibit positive effects in comparison to their unpublished counterparts, often attributing such tendencies to journals’ bias towards positive results [19][20][60,61], researchers’ bias towards positive results [21][62], and the phenomenon of ‘salami slicing’ [22][63]. Horwesearchersver, in an interesting deviation from these widely held perspectives, the findings of this study contradict the commonly perceived pattern.
A potential explanation for these findings might be rooted in the research settings. Specifically, journal articles, which tended to report relatively loreswearchersrr effects, researchersrewere predominantly conducted in university environments. On the other hand, the theses that reported larger effect sizes researchersrewere chiefly carried out in elementary school settings. This disparity in research settings across different types of sources may account for the observed differences.
- Experimental design
The current study, following Brown’s classification [23][37], divided the experimental design into two types: quasi-experimental and pre-experimental. In the quasi-experimental design, while no random sampling was conducted, both control and experimental groups rwesearchersre set up. In contrast, the pre-experimental design only included an experimental group, without implementing any random sampling. The results displayed a medium-to-large effect size (g = 0.778) in the pre-experimental design and a small-to-medium effect size (g = 0.475) in the quasi-experimental design. Horeswearchersver, this difference was not statistically significant (Q = 2.953, df = 1, p = 0.103).
Sailer and Hommer’s study [13][35] utilized the presence of randomization, differentiating betrwesearcherseen the true-experimental design and quasi-experimental design, as a moderating variable in their meta-analysis on the impact of gamification on academic achievement. Their findings revealed a larger effect size in the quasi-experimental design (g = 0.56) than in the true-experimental design (g = 0.29). Upon synthesizing the findings of both studies, a trend became evident: as experimental designs become stricter, the effect sizes reported tend to decrease.
- School level
A comparison of the effects of gamification was conducted in the educational environments of primary school, secondary school, and university. The results revealed that gamification had the largest effect size in primary schools, with a value of 0.801. The effect size was slightly lorwesearchersrr in secondary schools (g = 0.624) and further reduced in universities (g = 0.270). Although there was a decreasing trend in effect sizes as the school level increased, these differences rwesearchersrere not statistically significant (Q = 5.589, df = 2, p = 0.061). This finding aligns with a previous meta-analytic study that examined the influence of gamification on academic achievement [11][12][14][2,34,36], which also found no statistically significant differences among school levels.
The observed pattern of decreasing effect sizes from primary schools to universities could be attributed to various factors. To begin, primary school students generally demonstrate a keen interest in play and games, which makes them potentially more receptive to gamification in education. The familiarity and engagement with digital games outside school settings might facilitate the transference of this enthusiasm into the classroom when gamified methods are adopted [24][64].
In contrast, as rwesearchers ascend the educational ladder to secondary schools and universities, students’ learning preferences and motivations may undergo significant shifts. Older students, for instance, could perceive gamification elements, such as rewards, points, and badges, as somewhat infantile or even as distractions from their main educational objectives. Intrinsically motivated, these students often place greater value on autonomous and self-directed learning experiences, exhibiting a tendency to favor traditional teaching methodologies over gamified ones [25][26][65,66].
While these considerations offer insight into the decreasing trend of effect sizes, they also highlight the importance of adapting educational strategies to cater to the evolving needs and preferences of students at different stages of their academic journey. Therefore, the effective implementation of gamification in education, across all levels, may require a nuanced approach tailored to the age and preferences of the learners.
- Technology use
In this moderator, rwesearchers examined the impact of gamification on learning outcomes, particularly differentiating betresearcherseween instances where technology such as computers, tablets, or applications researchersrewere utilized and those where no technology was used. The outcomes yielded a noticeable distinction betresearcherseween the two groups. In scenarios where technology was absent, researcherswe observed an effect size of g = 0.932, surpassing the range defined as a large effect size. Horwesearchersver, when technology was incorporated, the effect size (g = 0.383) fell within the range of a small-to-medium effect size. The difference in these results was found to be statistically significant (Q = 4.171, df = 1, p = 0.041).
The results in this moderator analysis, demonstrating higher effect sizes in non-technology gamified interventions, appear to be in opposition to the findings of Yıldırım’s research, which did not identify a significant difference betrwesearcherseen technology-based and non-technology courses in a gamified class [14][36]. Similarly, in Bai et al.’s examination of gamification’s impact, treating flipped learning as a moderating variable, no significant statistical difference was found, although a slightly higher effect size was reported in flipped classes (g = 0.671) compared to non-flipped ones (g = 0.446) [11][2].
This discrepancy in outcomes raises important considerations about the role of technology in gamified educational environments. Despite the widespread belief in the efficacy of technology in enhancing learning outcomes, our study suggests that its deployment does not inherently guarantee improved results. This might be due to the increased focus and reduced distractions that a non-digital environment might offer. Furthermore, the effectiveness of technology use in second language (L2) learning is highly dependent on a myriad of contextual factors. These may include individual differences among learners, such as their learning preferences, learning styles, and varying levels of technology accessibility and familiarity. All these factors could significantly influence the effectiveness of incorporating technology into the language learning process [27][67]. This would necessitate a careful evaluation of whether the use of technology would enhance or potentially detract from the intended learning outcomes.
- Gaming elements
Gamification can be implemented using various gaming elements. TIn this study, the gaming elements utilized in each study researchersrewere extracted during the coding process, and researchersrewere organized into nine subelements based on the classification of previous research. As multiple elements researcherswere discovered through this process, and because several elements researchersrewere used simultaneously in each study, the effectiveness of gaming elements was compared based on the use of each element.
Among the nine subvariables, statistically significant differences rwesearchersrere found for point/score and badge/reward. First, in the case of point/score, the use of this element corresponded to a small-to-medium effect size of 0.340, while the absence of its use corresponded to a large effect size of 0.840 (Q = 6.235, df = 1, p = 0.013). Secondly, for ‘badge/reward’, there was a difference of about 0.48 betrwesearcherseen cases where it was applied (g = 0.832) and not applied (g = 0.351), which was statistically significant (Q = 5.088, df = 1, p = 0.024). On the other hand, no statistically significant differences rwesearchersrere found for the other variables, such as avatar/character, leaderboard/scoreboard, feedback, level, collaboration, mission/challenge, and story/fiction.
The findings of Hamari, Koivisto, and Sarsa [28][68], which highlighted the capacity of various gaming elements, notably points, badges, and leaderboards, to boost student motivation and subsequently enhance academic performance. The prominent effects of these distinct gaming elements suggest that they potentially stimulate students’ intrinsic motivation by furnishing palpable markers of progress and accomplishments. Contrastingly, Huang and colleagues [12][34] did not identify any significant differences among 14 gaming elements, including leaderboards, badges/awards, points/experiences, and advancements/levels. Similarly, Bai et al. [11][2] found no statistical significance when comparing effects across types of gaming elements.
In view of these divergent findings, while points/scores and badges/rewards seem to be influential components within gamified learning environments, educators are urged to consider the comprehensive design of the learning experience. This includes contemplating the synergistic effects among various gaming elements and aligning them with the specific needs and preferences of learners. It is imperative to underscore that the effectiveness of these gaming elements may fluctuate depending on the context and the characteristics of the learners [29][14].
3.2. Meta-Regression Analysis
Meta-regression analysis was used to scrutinize the impact of interval-scale moderating variables, such as grade, duration of instruction (in rwesearcherseeks), number of class sessions, number of gaming elements, etc., on the dependent variable.
In a meta-regression analysis, the regression coefficient, or ‘estimate’, provides insight into the potential increase (when the estimate is positive) or decrease (when the estimate is negative) in the dependent variable for each unit increase in the independent variable [30][27]. In the provided results, all the p-values exceed the standard significance threshold of 0.05, suggesting that none of the examined variables—grade, number of participants, rwesearcherseks, sessions, sessions per researcherseweek, and number of gaming elements—significantly influence the outcome in this meta-regression model.
Contrasting with this study, Bai et al. [11][2] found statistically significant differences in sample size and intervention duration. Horesearchwersver, it is noteworthy that Bai’s findings researchersrewere based on a subgroup analysis rather than a meta-regression. In Bai’s study, the relationship betresearchersween sample size and effect sizes was not linear, showing effect sizes of g = 0.984 for 50–100 participants, g = 0.501 for fereswearchersrr than 50 participants, and g = 0.106 for more than 150 participants. A similar non-linear pattern was observed for intervention duration, with effect sizes of g = 0.906 for 1–3 months, g = 0.533 for less than 1 rwesearcherseek, g = 0.488 for 1 rwesearcherseek to 1 month, and g = −0.278 for 1 semester or longer. Similarly, Sailer and Hommer [13][35] did not find any statistically significant difference when conducting a subgroup analysis according to the duration of intervention. The fact that the largest effect sizes rwesearchersrere not found in the largest sample size or the longest intervention duration groups implies that ‘more’ is not necessarily ‘better’ in the context of gamified learning. These non-linear relationships concerning the effect size, sample size, intervention duration, and other variables may point to the existence of ‘sresearcherseweet spots’ that might be optimal for gamified learning implementations.
3.3. Mean Effect Sizes by Dependent Variables
The study divided the dependent variables from each research into six domains: listening, speaking, reading, writing, vocabulary, and achievement. Further stratification was performed within these categories. In DV1, the variables rwesearchersrere split betresearcherseween receptive and productive skill, whereas in DV2, they researcherswere categorized into spoken and written language. A noteworthy detail is that Kim’s study [5][19], initially classified under ‘achievement’, primarily focused on reading. Thus, it was classified under ‘comprehension’ in DV1 and ‘written language’ in DV2.
Comparisons betrwesearcherseen receptive skills (g = 0.522) and productive skills (g = 0.559) in DV1 and betrwesearcherseen spoken language (g = 0.760) and written language (g = 0.473) in DV2 revealed no statistically significant differences. After delving deeper with a subgroup analysis based on the subcomponents of English proficiency, distinct trends emerged. Notably, the use of vocabulary displayed a large effect size (g = 0.875), while listening (g = 0.778) and writing (g = 0.527) skills demonstrated medium-to-large effect sizes. Other factors, such as speaking, achievement, and reading skills, indicated a small-to-medium effect size. Particularly intriguing was the observation that the single case study related to reading resulted in a negative effect size (g = −0.256).
Upon delving deeper into the subcomponents of English proficiency, vocabulary usage displayed a large effect size. This aligns with the observation that vocabulary acquisition plays a crucial role in language learning [31][69]. Similarly, listening and writing skills demonstrated medium-to-large effect sizes, emphasizing the potential of gamified interventions in improving these specific skill sets. In contrast, speaking, achievement, and reading skills indicated a small-to-medium effect size. It is particularly interesting to note that the single case study related to reading resulted in a negative effect size. This might indicate that certain gamified approaches are less effective for reading instruction, or that other variables might have affected the outcomes of that specific study. Horwesearchersver, the effectiveness of different methods in reading instruction is known to vary considerably [32][70], suggesting that more research is needed to fully understand this result. To sum up, more nuanced research could investigate further how different elements of gamified learning might be more or less effective for different language skills [33][71].