Digital PCR (dPCR) is a breakthrough technology that able to provide sensitive and absolute nucleic acid quantification. It is a third-generation technology in the field of nucleic acid amplification. A unique feature of the technique is that of dividing the sample into numerous separate compartments, in each of which an independent amplification reaction takes place. Several instrumental platforms have been developed for this purpose, and different statistical approaches are available for reading the digital output data.
- digital PCR
- genetic traceability
- diagnostics
- genetically modified organisms
- species
- copy number variation
- gene expression
1. Introduction
Digital PCR (dPCR) is a breakthrough technology that is able to provide sensitive and absolute nucleic acid quantification [1]. It is a third-generation technology in the field of nucleic acid amplification. Starting from end-point PCR, which is able to provide a qualitative or semi-quantitative result, the second-generation of the technique—real time PCR or qPCR—gives a quantification of the target sequence (Figure 1). Digital PCR, the third-generation PCR technology, works by partitioning a sample of DNA or cDNA into a high number of single, parallel PCR reactions. The reactions are carried out in separated and numerous small volume compartments in which DNA or cDNA molecules of the sample are randomly distributed. Each compartment can host none, one, or many molecules. In ideal conditions (i.e., a low density of target DNA and a high number of compartments), each compartment holds one or none target molecule. In such conditions, after amplification and absorbance measurements, a compartment containing no target molecule is counted as 0, whereas a compartment with one target is counted as 1. From such data, considering the dilution factor, it is possible to calculate the target copy number in an analytical sample. However, because a compartment can contain more than one target molecule in practice, correction factors based on Poisson statistical distribution—used to account for the probability of a partition initially containing more than one target—is used to achieve the final outcomes.
The first pioneering achievement of this technique was realized in 1992 by Sykes et al. [2], who used limiting dilutions of their samples and end-point signal quantifications for gene mutation detection. A milestone for dPCR technology development was the study of Vogelstein and Kinzler [3], dated to 1999. These authors amplified individual molecules of a sample in parallel PCRs with fluorescent probes, therefore transforming the exponential, analog nature of the PCR into a linear, digital signal. With the introduction of microfluidics, proposed by Liu et al. [4] in 2003, a major improvement was completed, and the hitherto dormant technique became of considerable interest [5]. The partition of DNA samples was done with the aid of micropumps and microvalves, thus increasing the accuracy of the dilution step. In 2011, droplet digital PCR (ddPCR) was proposed by Quantalife Co, LT, as a cheaper approach in comparison to the microfluidic one.
Currently, several different platforms are used for PCR reaction compartmentalization, such as active partitioning platforms (based on mechanical aid for the compartment formation), passive partitioning platforms (based on fluidic effects to create sub-volumes), self-digitization platforms (which combine both passive filling and partitioning), and droplet-based platforms (in which aqueous droplets act as microreactors). The main differences among platforms are in the number of partitions and in the number of samples that can be processed in a run.
In dPCR, the detection of the target is achieved similarly to in qPCR, with two main families of chemistries: DNA intercalating dyes and hydrolysis-based probes. As in qPCR, there is the possibility to organize multiplex reactions to simultaneously follow more than one target.
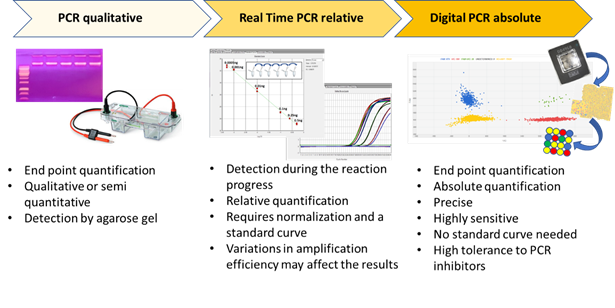
Figure 1. The three main PCR technologies are reported, and their main features are schematically presented.
In 2004, Gachon et al. [6] published a review entitled “Real-time PCR: What Relevance to Plant Studies?” in which the “detection and quantification of foreign DNA” and the “quantification of specific transcripts” were reported as the major applications of the technology to the plant sector. Up to now, qPCR has had innumerable applications in the field of plant science, as expected. Now, dPCR has been proposed as a new technique applicable to the same targets of qPCR that is also able to provide answers to additional, biological questions. In the present review, we summarize the recent applications of dPCR in plant science. The literature of the last five years was screened, and 81 papers published in peer-reviewed international journals were found to present the development and application of new dPCR-based protocols. Figure 2 shows the main categories of dPCR applications and their percentages: more than 80% of the studies were focused on the detection and quantification of genetically modified plants (GMPs) and of plant pathogens, but other kinds of applications, such as plant species traceability, gene expression studies, and CNV (copy number variation) detection, have also been present.
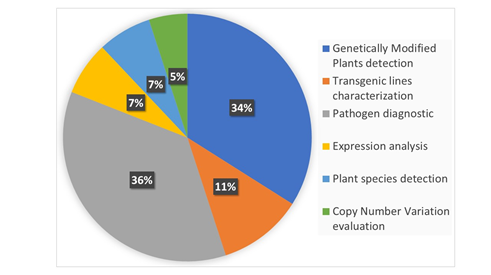
Figure 2. The main applications of digital PCR (dPCR) developed so far in the plant science sector are reported and classified into six main categories. The percentage of each category was calculated on the basis of number of recently published peer-reviewed studies. The literature screening was carried out using dPCR and its variants as main key words for an analysis of the recently published literature.
2. Genetically Modified Plants Detection
More than twenty years after the start of their commercialization, biotech crops currently cover around 200 million hectares worldwide [7]. Different labeling laws and voluntary labelling systems have been put into effect by various countries and groups with the aim of informing the consumer about the GMP content in products intended for consumption. Consequently, numerous analytical assays have been developed and validated over time with the aim of identifying and quantifying transgenic components in the various agri-food chains. A range of DNA-based methodologies have been developed using, among others, PCR, arrays, sequencing, and biosensor technologies. Currently, most of the validated assays are based on the qPCR method based on TaqMan probes. However, this analytical sector has shown strong interest in the adoption of dPCR assays, as reviewed by Demeke and Dobnik [8]. From the analysis of the literature of the last years, it is evident that a major sector in which dPCR has found application is the identification of GMP components in raw materials, as well as in derived food and feed. Thirthy-four percent of the published studies considered in this review were in fact focused on this goal.
The starting point of dPCR assays for GMP detection is the availability of primers/probes targeting a specific transgenic sequence and of primers/probes targeting an endogenous gene of the plant. This latter is not the modified gene. It is a single-copy, native gene that is strongly conserved in the species object of the analysis. The right choice of such an endogenous sequence is of great significance because it provides vital information on the stability and reliability of the detection system and it permits the quantification of genetically modified ingredients in mixtures. The analytical pipeline for the quantification through dPCR of GM components is not substantially different from that for qPCR and can be summarized in the following modules:
- Sample preparation and DNA extraction.
- Digital PCR analysis for the amplification of the target transgenic sequence.
- Digital PCR analysis for amplification of a native, reference sequence.
- Data evaluation.
The ratio between transgene copy number and reference gene copy number provides the GM percentage present in a sample. However, EU legislation requires that the amount of GM content is estimated as a mass fraction, and a conversion factor was therefore established for each event to convert a copy number ratio into a mass fraction [9]
Table 1 summarizes some of the dPCR assays recently developed or evaluated for GMP traceability. In addition to the used instrumental platform and the plant species, the table reports the alfa-numeric identifier in the cases of authorized genetically modified lines (not available in case of not yet authorized experimental lines). Moreover, the plant endogenous gene(s) used as reference in the assay is reported.
Table 1. The table shows recently developed dPCR assays aimed at identifying and quantifying genetically modified plants and at characterizing transgenic lines.
|
Instrumental Platform |
Plant Species |
Genetically Modified Line |
Endogenous Reference Gene(s) |
Bibliography |
|
Chamber-based digital PCR |
Zea mays |
NK603, MON810, MON863, Bt176, 3272, MIR162, MIR604 |
Adh and hmg |
[10] |
|
Droplet digital PCR |
Oryza sativa |
Kefeng-6 |
Sps2, RBE4, and ppi-PPF |
[11] |
|
|
|
|
|
|
|
Droplet digital PCR |
Zea mays
Glycine max |
MON88017, MON87460, MON89034, MIR162 CV127, MON87701, and MON87705
|
- |
[12] |
|
Droplet digital PCR |
Oryza sativa |
TT51-1 |
PLD |
[13] |
|
Droplet digital PCR |
Glycine max |
A2704-12, 356043, 305423, and 40-3-2 |
Lec-1 |
[14] |
|
Droplet digital PCR |
Brassica napus Glycine max |
OXY235 DP305423 |
hmg Lec-1 |
[15]
|
|
Droplet digital PCR |
Brassica napus |
HCN92 |
Cruciferin, CruA, FatA, and hmg-I/Y |
[16]
|
|
Droplet digital PCR |
Glycine max |
MON87769, MON87708, MON87705, FG72 |
Lec-1 |
[17] |
|
Droplet digital PCR |
Glycine max, Zea mays |
RR, MON89788, 2704, Bt176, Bt11, MON810, GA21, NK603, MON863, 59122, MIR604, TC1507, and T25 |
Lec-1 hmg |
[18] |
|
Droplet digital PCR |
Zea mays |
IE034 |
Adh |
[19] |
|
Droplet digital PCR |
Saccharum officinarum |
Q208 and Q240 |
ACT |
[20] |
|
Digital PCR |
Glycine max |
40-3-2, MON89788 |
Lec |
[21] |
|
Droplet digital PCR |
Zea mays |
DAS1507, DAS59122, GA21, MIR162, MIR604, MON810, MON863, MON89034, NK603, T25, Bt11, and MON88017 |
hmgA |
[22] |
|
Droplet digital PCR |
Oryza sativa, Citrus, Solanum tuberosum, Zea mays, Lycopersicon esculentum, Triticum |
Non-commercial plants |
Rice-OsUBC, citrus-CsDHN, potato-StAAP2, maize-ZmADH1, tomato-SISYS, and wheat-PINb-D1b |
[23] |
|
Droplet digital PCR |
Lolium |
Non-commercial plant |
LpCul4 |
[24] |
|
Droplet digital PCR |
Medicago sativa |
Non-commercial plants |
- |
[25] |
|
Chamber-based digital PCR Droplet digital PCR |
Zea mays |
GA21 |
Adh1 |
[26] |
|
Droplet digital PCR |
Zea mays |
MON810 |
hmg |
[27] |
|
Droplet digital PCR |
Nicotiana tabacum |
Non-commercial plants |
Ntactin and NtTubulin_1 |
[28] |
|
Droplet digital PCR |
Solanum tuberosum |
AV43-6-G7 |
fru |
[29] |
|
Droplet digital PCR |
Glycine max |
15 lines (authorized or with valid EFSA application) |
Lec-1 |
[30] |
|
Chamber-based digital PCR Droplet digital PCR |
Zea mays |
MON810, MON863, TC1507, MIR604, MIR162, GA21, T25, NK603, and BT176 |
- |
[31] |
|
Droplet digital PCR |
Zea mays |
MON863, MON810, DP98140, MIR604, GA21, MON89034, and MIR162 |
hmgA |
[32] |
|
Droplet digital PCR |
Arabidopsis thaliana |
Non-commercial plant |
AAP1 |
[33] |
|
Droplet digital PCR |
Triticum |
Non-commercial plant |
ssII-D and waxy-D1 |
[34] |
|
Droplet digital PCR |
Zea mays |
Certified reference materials |
hmg |
[35] |
|
Droplet digital PCR |
Glycine max |
multitarget DNA molecule encoding for eight transgene soy traits |
Lec-1 |
[36] |
|
Droplet digital PCR |
Brassica napus |
Non-commercial transgenic lines |
CruA |
[37] |
|
Droplet digital PCR |
Glycine max |
DAS-68416-4 |
- |
[38] |
|
Droplet digital PCR |
Zea mays |
DAS1507 and NK603 |
hmg and Adh1 |
[39] |
Digital PCR approaches for transgene detection and quantification have been evaluated in cultivated GM crop and reference materials.
Various relevant points can be highlighted from the experiences made on dPCR-based GMP detection.
Iwobi et al. [12] compared qPCR and ddPCR performance on a panel of certified reference materials and GM samples arising from previous proficiency tests, and they demonstrated the applicability of ddPCR assays for the routine analysis of GM food and feed. Moreover, they demonstrated the better performance of ddPCR in comparison with qPCR in inhibitor-contaminated samples. The same results were obtained by Wang et al. [13] looking for transgenic rice in various processed samples. Other authors underlined the importance of selecting appropriate endogenous reference genes characterized by amplification efficiencies closely related to that of event-specific genes [34][11,16,20,34].
Several dPCR assays have been validated through proficiency studies in comparison with qPCR, and, in general, a similar performance has been found between the two techniques [21][12,18,19,21]. It has been found that sample pre-treatment prior to digital PCR can influence the results, and pretreatment-free detection is therefore preferential for achieving accurate results [31][26,31]. The convenience of digital PCR in real-life routine diagnostics has been verified on certified materials and analytical samples, and it has been found to useful for the routine quantification of GMP content in food and feed samples [23][12,27,40]. Multiplex assays for the quantification of several GM Glycine max lines were developed by Kosir et al. [30] and validated with an inter-laboratory trial. The assays performed well for key parameters such as the accuracy, robustness, and practicability and significant improvement in terms of cost efficiency has been demonstrated. The multiplexing of the assays therefore has the potentiality for further improvements of dPCR-based GMP traceability [32].
In conclusion, dPCR has several positive characteristics, such as its precision, accuracy even at very low target concentrations, suitability for routine analytics, and lower sensitivity to PCR inhibitors [8]. However, the main reason for the interest in this technique for GMP detection is its useful ability to perform an absolute quantification, independent of a reference standard/calibration curve. This means that differences in amplification efficiency due to matrix differences between a sample and its reference material do not affect the analytical results.