Your browser does not fully support modern features. Please upgrade for a smoother experience.
Please note this is a comparison between Version 1 by Victoria Samanidou and Version 2 by Peter Tang.
Antibiotics are used in aquaculture in order to control the infection outbreaks. They are natural, semisynthetic or synthetic compounds and their antibacterial effect resides on their ability to eliminate the bacteria or hinder their growth. The widespread use of antibiotics in veterinary practice and aquaculture has led to the increase of antimicrobial resistance in food-borne pathogens that may be transferred to humans.
- sample preparation
- extraction
- aquaculture
- shrimps
- chromatography
- antibiotics
1. Introduction
According to FAO (CWP Handbook of Fishery Statistical Standards, Section J: AQUACULTURE), “aquaculture is the farming of aquatic organisms: fish, mollusks, crustaceans, aquatic plants, crocodiles, alligators, turtles, and amphibians. Farming implies some form of intervention in the rearing process to enhance production, such as regular stocking, feeding, protection from predators, etc.” [1].
Since 1960, aquaculture practice and production has increased as a result of the improved conditions in the aquaculture facilities. Such improvements include better water quality, infection control, high nutrition feeds and improved aquatic species, through newly developed hybridization techniques, particular species breeding and the use of molecular genetics [2]. According to FAO 2005, in the time span from 1990 to 2005, aquaculture production each year has tripled from 16.8 million tons to 52.9 million tons. By 2015, it was also predicted that aquaculture would constitute 39% of the seafood production in weight worldwide, dramatically increasing from 4% in 1970 and 28% in 2000. Eleven of the fifteen elite aquaculture producing countries are located in Asia, with 94% of the total worldwide production, while China on its own has 71% of the total production [3].
Shrimp aquaculture is one of the most important aquacultures and makes a considerable contribution to the national economies, both in developed and developing countries. According to the “Global Study of Shrimp Fisheries” from FAO, the biggest domestic product percentage of shrimp farming belongs to Madagascar (1%), excluding the traditional shrimp fishing. The gross domestic values for other developing countries range between $2.72 million–$558 million US. Shrimp is the most profitable exported product in Cambodia, Indonesia, Kuwait, Madagascar, Mexico, Nigeria, and Trinidad and Tobago, and to a lesser extent Australia and Norway. Shrimp consumption, on the other hand, is high in most developed countries, such as Australia and Norway, with the United States presenting the highest consumption and, as a result, being the greatest shrimp market worldwide [4].
The increased aquaculture practice has resulted in increased levels of infections among the species. Usually the farming is done in cages, where high populations are confined to a limited space, and infection outbreaks are common despite good hygiene levels. Bacteria, parasites, viruses and fungi can infect the confined animals, with bacteria being the main source of infections [5].
Antibiotics are used in aquaculture in order to control the infection outbreaks. They are natural, semisynthetic or synthetic compounds and their antibacterial effect resides on their ability to eliminate the bacteria or hinder their growth. Antibiotics used for human disease treatment, such as penicillins, macrolides, sulfonamides, tetracyclines and quinolones/fluoroquinolones, are often used in aquaculture. Specifically, oxytetracycline, florfenicol, sarafloxacin, enrofloxacin, chlortetracycline, ciprofloxacin, norfloxacin, oxolinic acid, perfloxacin, sulfamethazine, gentamicin, and tiamulin are commonly used in aquaculture infections. Besides the use of antibiotics as bacterial infection treatment, sulfonamides, β-lactams and macrolides can be used as growth-promoting or infection-preventing agents. They are used in sub-therapeutic doses in animal feed or veterinary drugs [6][7][8][9].
The extensive use of antibiotics, however, may lead to residues in edible animal tissues and cause allergic or toxic effects to sensitive groups or the development of persistent microorganisms. It poses a risk to human health through the migration of antibiotics from aquaculture products to the human organism. As a result, authorities in many countries have published regulations on the antibiotic usage and residues in aquaculture and aquaculture products to minimize the risk to human health associated with consumption of their residue [9].
These regulations are strict in Europe, North America and Japan, where only few antibiotics are approved and maximum residue levels (MRLs) are introduced. However, the majority of aquaculture production and export takes place in countries where few or no regulations exist [6][9].
2. Antibiotics
The most effective and useful antibacterial agents inhibit or prevent the development of the cell wall, the protein synthesis or the DNA replication and transcription. Less effective and clinically useful are those agents that act on the cell membrane or inhibit a metabolic path of the cell. Penicillins, cephalosporins and β-lactams inhibit the cell synthesis, chloramphenicol, tetracyclins and macrolides inhibit the protein synthesis, and quinolones, nitrofurans and sulfonamides inhibit the DNA synthesis [10]. Quinolones are synthetic antibiotics with a broad-spectrum antibacterial effect. This antibiotic group includes plain quinolones, such as oxolinic acid and nalidixic acid, and fluorinated quinolones, known as fluoroquinolones, such as ciprofloxacin, flumequine and sarafloxacin [5]. Quinolones have a dual heterocyclic aromatic ring structure as shown in Figure 1, with the first ring having a nitrogen atom at position 1, a carboxyl group at position 3 and a carbonyl group at position 4, and the second ring having a carbon atom at position 8. Fluoroquinolones result from the addition of a fluorine atom at position 6 of the second ring. Substitution at position 1 and 7 results in new enhanced fluoroquinolones [11][12][13].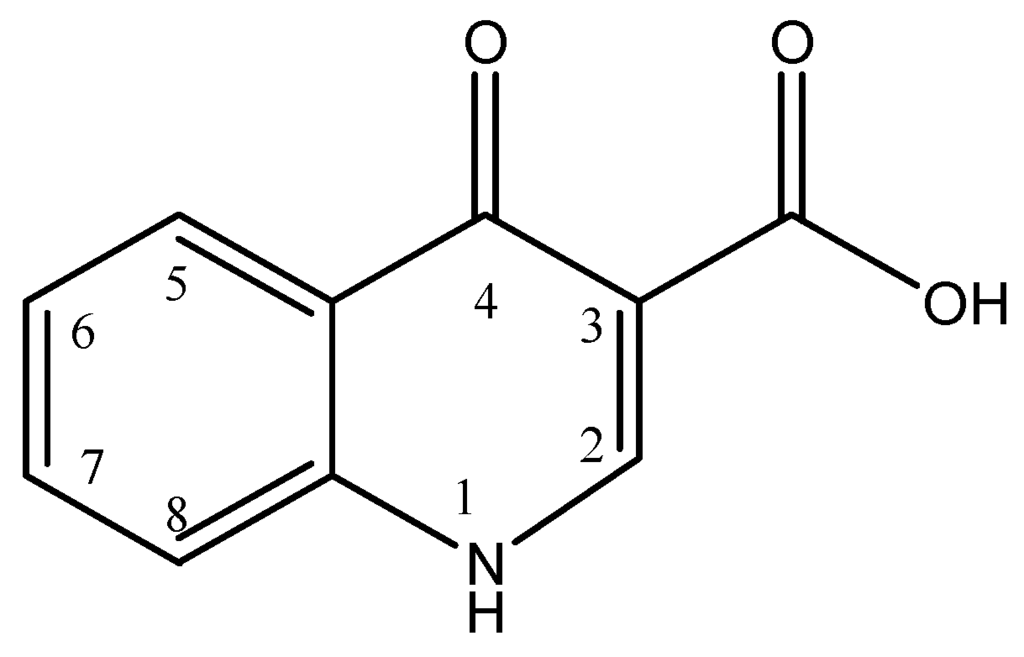
Figure 1.
General chemical structure of quinolones.
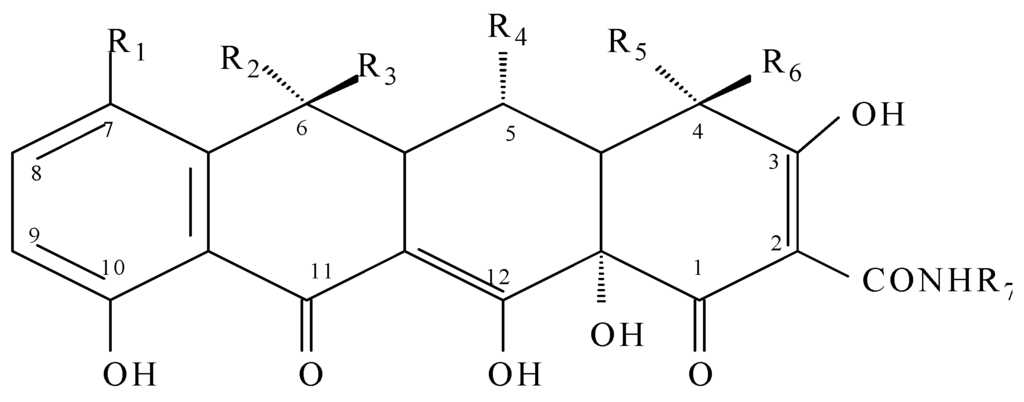
Figure 2.
General chemical structure of tetracyclines.
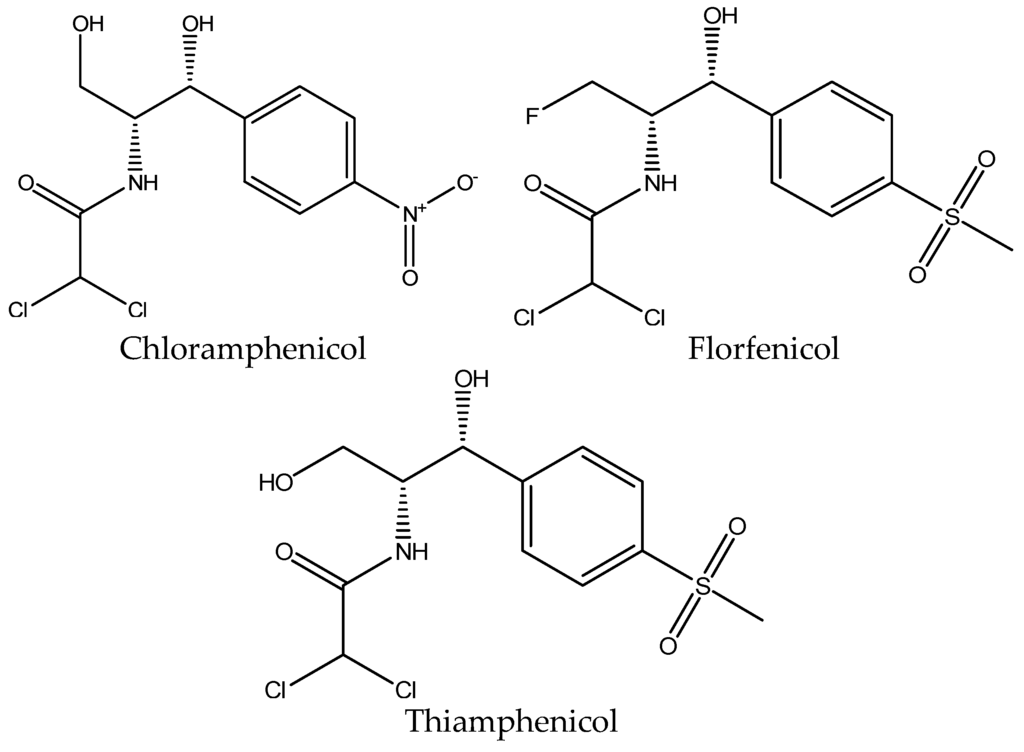
Figure 3.
Chemical structure of chloramphenicol, florfenicol and thiamphenicol.
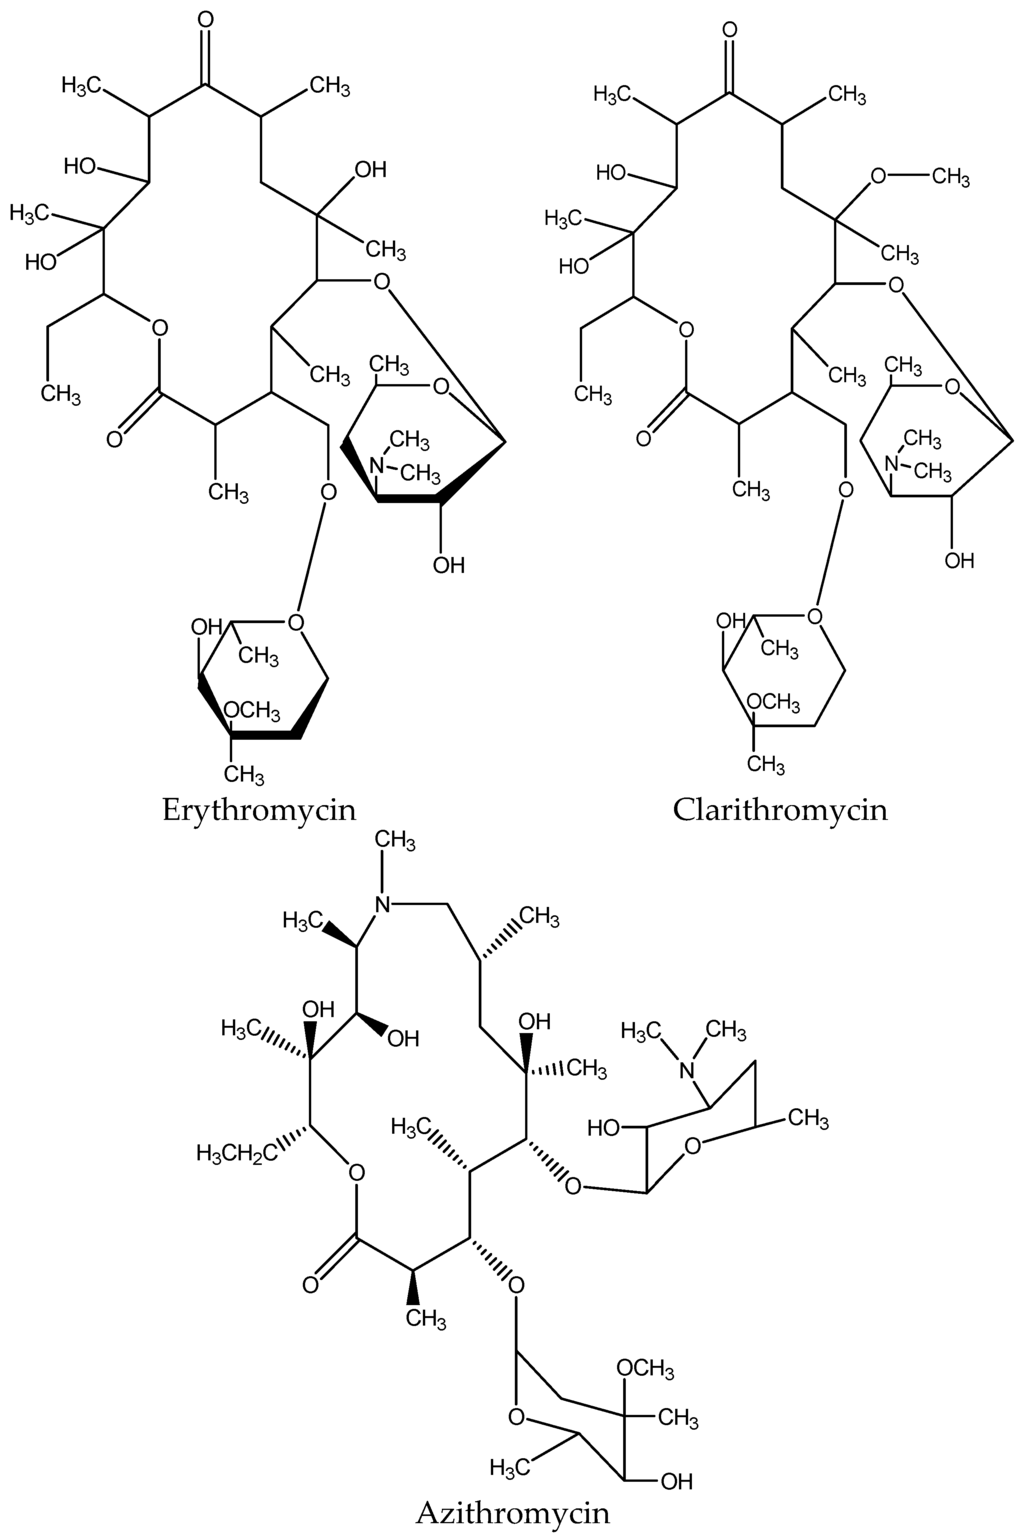
Figure 4.
Chemical structure of common macrolides.
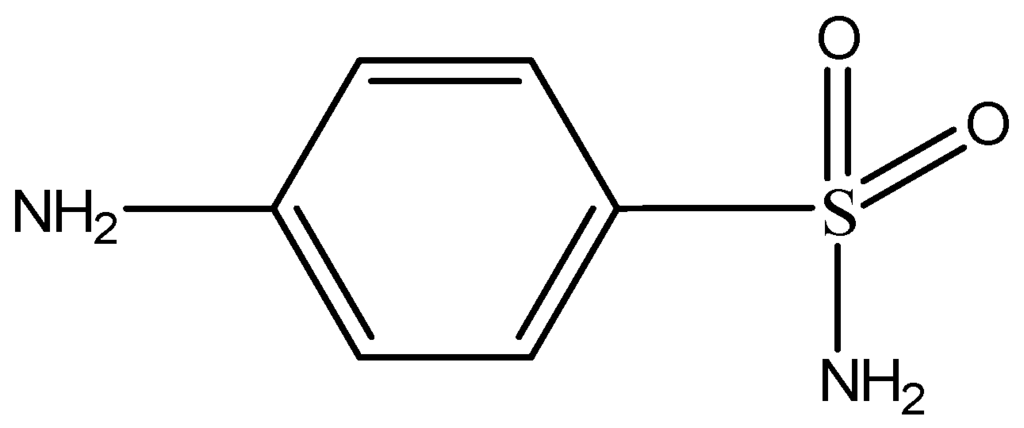
Figure 5.
General chemical structure of sulfonamides.
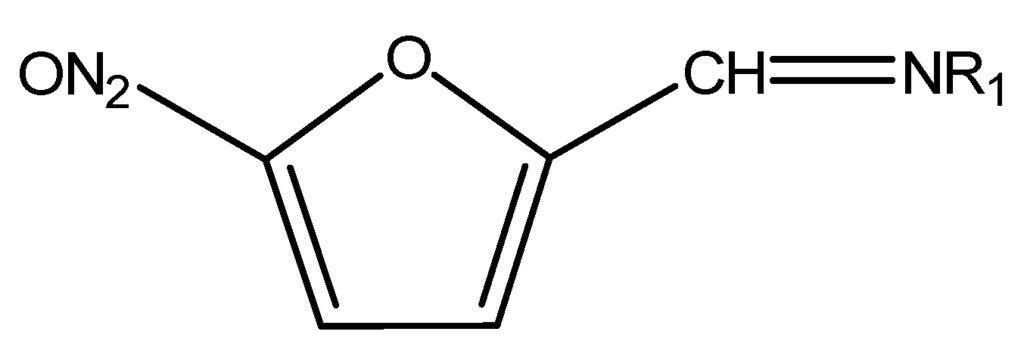
Figure 6.
Chemical structure of Nitrofurans.
3. Trends in the Extraction of Antibiotics from Shrimps
Shrimp tissue contains high amounts of protein. It also contains unsaturated fatty acids, such as the necessary eicosapentaenoic and docosahexaenoic acids, and minerals, such as calcium. The tissue composition depends on the feed given to the shrimps [28]. As mentioned above, a significant number of multi-residue or single analytical methods have been reported in the literature for the determination of antibiotics in shrimps. To begin with, quinolones are mostly determined in shrimps after using SPE or SLE as the sample preparation technique. Furthermore, LLE and MIP-based techniques are equally applied in some of the studies. The same phenomenon appears in the determination of the class of tetracyclines, where SPE and SLE, including accelerated solvent extraction (ASE) and pressurized liquid extraction (PLE), are almost equally and most frequently used in the analysis of shrimps. The class of amphenicols is determined by using a wide variety of sample preparation techniques. SLE is once again the primary preferable technique, followed by SPE. A different approach of the extraction is achieved with the use of immunoaffinity columns (IAC) for the determination of amphenicols in shrimps. Molecular imprinted—SPE (MISPE) are also used in a smaller number of studies. In addition to these, there were some cases where matrix solid phase dispersion (MSPD), LLE and supercritical fluid extraction (SFE) is performed in shrimp samples. For the class of sulfonamides, SPE is the sample preparation of choice, followed by SLE. In addition, there are some studies in which a combination of SLE and LLE is used for the extraction of sulfonamide drugs from shrimp samples. Furthermore, MISPE and QuECheRS are applied for the determination of sulfonamides. The determination of nitrofurans is achieved by determining the derivatives of the drugs. Derivatization takes place before or after the sample preparation. Derivatization is preformed after sample preparation using SLE, or prior to SPE.3.1. Extraction of Quinolones
Enrofloxacin and ciprofloxacin were extracted using 10 mL of acetonitrile. The extract was evaporated to dryness at 37 °C, and the residue was re-dissolved with an ammonium acetate buffer to a final volume of 2 mL. A SPE cleanup step was applied with a SDB-RPS cartridge (polyStyrene Divinylbenzene-Reverse Phase sorbent) preconditioned twice with 1 mL of ethanol, 1 mL of water and 1 mL of the ammonium acetate buffer, sequentially. Target compounds were eluted with 4 mL methanol and ammonium hydroxide solution 1 M (75:25, v/v). The eluates were evaporated to dryness at 37 °C, and the residue was re-dissolved in 300 μL of formic acid solution (pH = 2.5). The extraction procedure yielded recoveries between 94.0%–106.0%, 97.0%–103.0% for ENR and CIP, respectively. Analysis was carried out by an LC-MS/MS system, separation was achieved by a Polaris C18A 3 μm (150 × 2.0 mm) with a Chromsep guard column SS (10 × 2.0 mm), and the mobile phase consisted of an acetonitrile and formic acid solution (pH = 2.5) delivered in gradient conditions. The LOD was 4 μg/kg and 3 μg/kg for ENR and CIP, respectively [29]. Ciprofloxacin, danofloxacin, enrofloxacin and sarafloxacin were extracted from shrimp samples using 16 mL of acidic acetonitrile and the addition of dichloromethane (to a final volume of 25 mL). A SPE cleanup step with a Strata C18 E was preconditioned with 2 mL of acetonitrile. The antibiotics were eluted from the SPE cartridges with 2 × 2 mL of acetonitrile. The eluates were evaporated to dryness under a nitrogen stream at 45 °C, and the residue was re-dissolved in 200 μL of acetonitrile and 800 μL of deionized water. The extraction procedure yielded recoveries between 63.0%–117.0%, 71.0%–87.0%, 72.0%–92.0%, 95.0%–125.0% for CIP, DAN, ENR and SAR, respectively. Analysis was carried out by a UPLC-MS system, separation was achieved by a HSS T3 C18 column (1.8 mm, 2.1 × 50 mm) (Waters, Milford, MA, USA), and the mobile consisted of 4 mM NH4OH/50 mM formic acid buffer in either 10% MeCN or 90% MeCN (gradient elution). The LOD values were 0.13, 0.14, 0.19, 0.14 ng/g for for CIP, DAN, ENR and SAR, respectively. This method allows a single analyst to prepare 25 samples each day [30]. Ofloxacin, norfloxacin, ciprofloxacin and lomefloxacin were extracted from the spiked samples with 30 mL of a 1% acetic acid ethanol solution. A cleanup step using SPE was applied. SPE cartridge was washed with 10 mL of methanol, water, methanol in order, and the quinolones were eluted with 10 mL of 25% ammonia methanol. The eluate was evaporated to dryness under a nitrogen stream at 35 °C, and the residues were re-dissolved in mobile phase. The extraction procedure for a peeled prawn sample without shell yielded recoveries between 88.3%–99.8%, 95.9%–109.4%, 91.2%–107.0%, 88.9%–103.4% for OFL, NOR, CIP and LOME, respectively. Analysis was carried out by a HPLC system coupled with a chemiluminescence detector, and separation was achieved by a XDB-C8, 150 mm × 4.6 mm i.d., 5 μm column. The LOD was 0.43, 0.36, 0.40 and 2.4 ng/mL for OFL, NOR, CIP and LOME, respectively. This study established a novel HPLC chemiluminescence detection method for quinolone determination, which was based on the Ce(IV)–Ru(bpy)32+–HNO3 system [31]. Enrofloxacin and ciprofloxacin were extracted from the spiked samples with 5 mL of methanol:acetic acid (98:2, v/v), the extracts were evaporated (to a final volume of 2 mL) under a nitrogen stream at 50 °C, and the residue was re-dissolved in 10 mL water:acetic acid (98:2, v/v). The SPE cleanup step involved a Sep-Pak C18 (500 mg, 6 mL) cartridge preconditioned and equilibrated with 6 mL of methanol and 6 mL of Milli-Q water sequentially. The quinolones were eluted with 6 mL of methanol:(1 M) phosphoric acid (9:1, v/v) and 4 mL of methanol, the eluate was evaporated to dryness under nitrogen stream at 50 °C, and the dry residue was re-dissolved in 1 mL of Tris buffer solution (pH 9.1). The extraction yielded 88.43%, 80.41% average recoveries for ENR and CIP, respectively. Analysis was carried out by a HPLC system coupled with a fluorescence detector, separation was achieved by a PLRP-S column (5 μm, 4.6 × 150 mm) with a RP18-E guard column (5 μm, 4 × 40 mm) (Polymer Laboratories Inc., Church Stretton, UK), and the mobile phase consisted of orthophosphoric acid, acetonitrile and tetrahydrofuran (gradient elution). The LOD was 0.015, 0.025 μg/g for ENR and CIP, respectively [32]. Nine fluoroquinolones and 3 acidic quinolones were extracted from the spiked samples with 20 mL of AcCN/MeOH (1:1 v/v), a SPE cleanup step with a Fe3+ immunoaffinity cartridge followed, and the quinolones were eluted with 0.5 mL of a McIlvaine-EDTA-NaCl buffer. The extraction procedure yielded inter-day recoveries between 73.7%–89.7% for the fluoroquinolones and 75.7%–87.6% for the acidic quinolones. Analysis was carried out by a HPLC system coupled with a spectrofluorometric detector, separation was achieved by an Atlantis dC18 IS column (4.6 × 20 mm, 3 mm), and the mobile phase consisted of (15:85:0.1 v/v) MeOH-water-formic acid for the fluoroquinolones and (35:65:0.1 v/v) MeOH-water-formic acid for the acidic quinolones (isocratic elution). The LOQ ranged between 1.5–50.0 mg/kg for the fluoroquinolones and 1.5–3.0 mg/kg for the acidic quinolones [33]. Flumequine, nalidixic acid and oxolonic acid were extracted from the spiked samples with 5 mL of acetonitrile. Two mL of 0.1 mol/L an ammonia solution and 2 mL n-hexane were added to the extracts in order to remove the colored and fatty components. The extracts were evaporated under a nitrogen stream at 45 °C and 6 mL of hydrochloric acid 0.1 mol/L, and 6 mL of ethyl acetate were added. The ethyl acetate extract was evaporated to dryness at 40 °C, and the residue was re-dissolved in 300 μL of methanol. The extraction procedure yielded recoveries between 73.3%–84.5%, 80.4%–90.4%, 79.2%–88.3% for OXO, NAL and FLU, respectively. Analysis was carried out by a HPLC system coupled with a fluorescence detector, separation was achieved by a C18-Nucleosil HD column (4 mm × 250 mm, 5 μm), and the mobile phase consisted of 0.01 mol/L oxalic acid (pH 2.3) and acetonitrile (65/35, v/v) (isocratic elution). The CCβ was 610.9 μg/kg, 13 μg/kg, and 117.3 μg/kg for FLU, NAL and OXO, respectively. This method gave good results concerning the complexity of the matrix and allows evaluation of the shrimp samples being compliant to the current European legislation [34]. Oxolinic acid, flumequine and nalidix acid were extracted from the spiked samples with 12 mL of ethyl acetate (re-extracted with another 12 mL) and the addition of 2 g anhydrous sodium sulfate, the extract was evaporated to dryness, and the residue was re-dissolved in 2 mL of a 0.2% formic acid aqueous solution. The extraction procedure yielded 92.6%, 79.3%, 79.8% average recoveries for OXO, FLU and NAL, respectively. Analysis was carried out by an LC system coupled with a fluorescence detector, separation was achieved by an Agilent Zorbax Eclipse XDB C8 column (4.6 mm × 150 mm, 5 μm), and the mobile phase consisted of 60% oxalic acid (0.01 M), 30% acetonitrile and 10% methanol (v/v/v) (isocratic elution). MDL was 3, 2.7 and 2.3 ng/g for OXO, NAL and FLU, respectively. The simple extraction scheme provided LC-MS compound confirmation with increased sample throughout, over previews GC-MS methods and selectivity for the above antibiotics [35]. Flumequine, oxolinic acid and nalidix acid were extracted from the spiked samples with 5 mL of 1% acetic acid, 10 mL of acetonitrile and the addition of 2 g sodium chloride. The extract were evaporated to dryness under nitrogen stream at 55 °C and re-dissolved in 2.5 mL of reconstitution solution containing 40 ng/mL of piromidic and 100 mg/mL of EDTA in acetonitrile/water (1:1, v/v). The extraction procedure yielded recoveries between 79.0%–88.0%, 91.0%–95.0%, 100.0%–101.0% for FLU, OXO and NAL, respectively. The analysis was carried out by a LDTD source coupled to a triple quadrupole mass spectrometer. The MDL was 1.7, 2.6, 4.4 ng/g for FLU, OXO and NAL, respectively. This method was found to meet many of the drug residue analysis requirements in shrimp tissue samples, using a single solvent extraction step, resulting in decreased sample analysis and increased sample throughput [36]. OXO and FLU were extracted by mixing the spiked samples with 400 μL of supramolecular solvent. The extraction procedure yielded recoveries between 100%–102%, 100%–101.4% for FLU and OXO, respectively. Analysis was carried out by an LC system coupled with a fluorescence detector, separation was achieved by a Kromasil C18 column (5 μm, 150 mm × 4.6 mm), and the mobile phase consisted of 55% oxalic acid (0.01 M) and 45% acetonitrile/methanol (75:25, v/v) delivered isocratically. The CCβ was 109 g/kg, and 622 g/kg for OXO and FLU, respectively. This method proved to be reliable, fast and low-cost. It demonstrates high extraction efficiency regardless of the matrix composition, and a simple one-step analyte extraction with neither cleanup nor evaporation was needed [37]. Shrimp samples were mixed with trichloroacetic acid aqueous solution (15%, w/v), and the resulting extracts were spiked with ciprofloxacin. Yeast@MIPs or yeast@NIPs were dispersed in the extracts, collected, and washed with a 10-mL methanol-acetic acid solution (59:1 v/v). The resulting extracts were dried under nitrogen stream at 298 K, and the residues were re-dissolved in 0.4 mL methanol. The extraction procedure yielded a 86.4% recovery. Analysis was carried out by HPLC system coupled with ultraviolet detector, separation was achieved by a C18 (150 × 4.6 mm2) column, and the mobile phase consisted of methanol-water (24:76, v/v) (isocratic elution). The surface imprinted yeast@MIPs developed for this paper exhibited high adsorption capacity, high selectivity, rapid binding ability for CIP, and could be used at least five times without losing their adsorption capacity. Moreover, they were successfully used in real sample analysis for CIP in shrimps yielding good recoveries [38].3.2. Extraction of Tetracyclines
Tetracycline, oxytetracycline and chlorotetracycline were extracted from the spiked samples with 10 mL of succinic acid and an addition of 1–1.5 g sodium chloride and tissue disruptor. A SPE cleanup step with OASIS hydrophobic-lipophilic-balanced (HLB) SPE columns (6 mL, 200 mg, Waters Corp, Milford, MA, USA) were conditioned with 4 mL of methanol, water and succinic acid sequentially. The tetracyclines were eluted with 2 mL of methanol, the eluates were evaporated to dryness under nitrogen stream at 60 °C, and the residues were re-dissolved in 2 mL of 0.1% formic acid. The extraction procedure yielded 82.9%, 93.2%, 76.8% average recoveries for TC, OTC, and CTC, respectively. Analysis was carried out by an LC-MS/MS system, separation was achieved by a MacMod HydroBond PS C8, 100 mm × 2.1 mm, column, and the mobile phase consisted of 75%, 0.1% formic acid, 18% acetonitrile and 7% methanol (isocratic elution). The average LOQ was 50 ng/g for all analytes. The developed method is ideal for routine analysis, avoids the use of complex buffers and provides a simple and fast extraction procedure [39]. Oxytetracycline, tetracycline, chlorotetracycline and doxycycline were extracted from shrimp samples with 12.5 mL of Na2EDTA-McIlvaine buffer at pH 4. A SPE cleanup step with the C-18E cartridge (500 mg, 6 mL) (Phenomenex, Torrance, CA, USA) was activated with 10 mL of methanol and 10 mL of Milli-Q water sequentially. The tetracyclines were eluted with 10 mL of methanol, the solvent was removed under room temperature, and the residues were passed through 0.45 μm PTFE filter. The extraction procedure yielded recoveries between 83.3%–96.5%, 88.4%–96.9%, 86.0%–93.3%, 90.6%–102.0% for OTC, TC, CTC and DC, respectively. Analysis was carried out by an LC system coupled with an electrochemical detector with a nickel-implanted boron-doped diamond thin film electrode (Ni-DIA), separation was achieved by a ODS-3 Inertsil C18 (5 μM 4.6 mm × 250 mm) column, and the mobile phase consisted of 0.01 M phosphate buffer (pH 2.5)-acetonitrile (80:20, v/v) delivered isocratically. The LOD ranged between 0.1–0.5 g/mL for all analytes. This paper demonstrates the first use of Ni-DIA electrodes for the electroanalysis of tetracyclines, with excellent performance for the oxidative detection of tetracyclines, exhibiting well-defined voltammograms, high sensitivity and significant advantages over the BDD and glassy carbon electrode [40]. Oxytetracycline, tetracycline, chlorotetracycline and doxycycline were extracted from the shrimp samples with HPLC grade methanol. The extract was evaporated to dryness, and the residue was re-dissolved in mobile phase. The extraction procedure yielded recoveries between 91.0%–98.0%, 81.0%–99.0%, 84.0%–101.0%, 80.0%–85.0% for TC, OTC, CTC and DC, respectively. Analysis was carried out by an LC-MS/MS system, separation was achieved by a reverse phase Zorbax Eclipse Plus C18 (5 μm particle size, 4.6 × 100 mm) column, and the mobile phase consisted of 0.1% formic acid in water and 0.1% formic acid in methanol under gradient elution. The LOD was 11, 12, 20, 23 ng/g for TC, OTC, CTC and DC, respectively [41]. Seven tetracyclines were extracted from the spiked samples with a Dionex accelerated solvent extractor 200 (Dionex, Sunnyvale, CA, USA), which provides the use of solvents at temperatures up to 80 °C and pressures up to 85 bar, and methanol and 1 mmol/L trichloroacetic acid at pH 4.0 as solvents. The spiked samples were mixed with 5 g of Na2EDTA-washed sand and packed in an extraction cell at pH 4.0. The extraction procedure yielded 75.6%–103.5% average recovery for all analytes. Analysis was carried out by a HPLC system coupled with a dual λ absorbance detector, separation was achieved by a ZORBAX SB-C18 (150 mm × 4.6 mm I.D., 5 μm) (Agilent Technology, Santa Clara, CA, USA) column, and the mobile phase consisted of methanol, acetonitrile and 0.01 M oxalic acid (gradient elution). The CCβ ranged between 7.8–108.1 μg/kg. This method provided fast sample extraction with pressurized liquid extraction, compared to conventional liquid-liquid extractions, with reduced solvent use [42].3.3. Extraction of Amphenicols
Chloramphenicol was extracted from shrimps using 4 mL of a phosphate extraction solution. An aliquot of 4.5 mL of ethyl acetate was added in the supernatants, the organic layer was evaporated to dryness under mild nitrogen stream at 45 °C, and the residue was re-dissolved in 300 μL of methanol/water (50:50 v/v). The extraction procedure yielded recoveries between 98.3%–100.0%. Analysis was carried out by an LC-MS/MS system, separation was achieved by a C18 reverse-phase analytical column (100 mm × 2.1 mm, 4 μm) connected to a C18 pre-column (1 cm × 4 mm, 4 μm), and the mobile phase consisted of water and methanol (gradient elution). The LOD was 0.03 ng/g. The extraction procedure used in this study proved to be simple and fast, with no cleanup step needed and there was no matrix interference [43]. Chloramphenicol was extracted from shrimps with 7 mL of ethyl acetate and the addition of 1 g sodium sulfate anhydrous. The extracts were evaporated to dryness under nitrogen stream at 40 °C, and the residues were re-dissolved in 1 mL of acetonitrile. Analysis was carried out by an LC-MS/MS system, separation was achieved by a X-Terra (2.1 × 150 mm, 3.5 μm) column, and the mobile phase consisted of methanol and water containing 0.1% NH4OH delivered using a gradient elution program. The CCβ was 0.04 μg/kg [44]. Chloramphenicol was extracted from the spiked samples with 5 mL of ethyl acetate, and after some evaporate/re-dissolve steps the final ethyl acetate extract was evaporated to dryness under nitrogen stream at 45 °C. The residue was re-dissolved in 0.5 mL of hexane:CCl4 (1:1 v/v) and mixed with 0.7 mL of HPLC-grade acetonitrile-water (1:1 v/v), and the upper clear phase was used for the analysis. The extraction procedure yielded recoveries between 95.88%–96.96%. Analysis was carried out by an LC-ESI-MS/MS system, separation was achieved by a C18 reverse phase Unisil HPLC column (150 × 4 mm i.d., 5 μm) (Gasukuro Kogyo, Inc., Tokyo, Japan), and the mobile phase consisted of water 90% plus acetonitrile 10% and water 10% plus acetonitrile 90% (isocratic elution). The CCβ was 0.098 mg/kg [45]. Chloramphenicol was extracted from the spiked samples with 5 mL of acetonitrile. An aliquot of 5 mL of chloroform was added to the extracts; after vortexing and centrifugation, the chloroform layer was discarded. The acetonitrile extracts were evaporated to dryness under nitrogen stream, and the residues were re-dissolved in 1 mL of mobile phase. The extraction procedure yielded recoveries between 85.5%–115.6%. Analysis was carried out by an LC-MS/MS system, separation was achieved by a Luna 5 μm C18 (150 × 4.6 mm) column, and the mobile phase consisted of water and acetonitrile delivered under gradient conditions. The LOD was 0.02 mg/kg. This method performed a simple and rapid liquid–liquid extraction without using any other cleanup step such as SPE [46]. Chloramphenicol was extracted from the spiked samples with 20 mL of acetonitrile/4% NaCl in water solution (1:1, v/v), the extract was de-fatted with 2 × 10 mL of n-hexane, and 7 mL of water-saturated ethyl acetate was added to the remainder. The ethyl acetate extracts were evaporated to dryness and re-dissolved in 3 mL of water/acetonitrile (95:5, v/v). A SPE cleanup step with a C18 (500 mg/3 mL) cartridge preconditioned with 10 mL of methanol and 10 mL of water/acetonitrile (95:5, v/v) followed, and the CAP was eluted with 3 mL of water/acetonitrile (45:55, v/v). 4 mL of water-saturated ethyl acetate was added to the eluate, the extracts were evaporated to dryness under nitrogen stream, and the residue was re-dissolved in 1 mL of acetone/toluene (20:80, v/v). A second SPE step with a Silica cartridge preconditioned with 6 mL of acetone/toluene (20:80, v/v) followed. CAP was eluted with 6 mL of acetone/toluene (70:30, v/v). The eluent was evaporated to dryness, and 50 μL of derivatization mixture N,O-bis(trimethylsilyl)acetamide (BSA)/n-heptane (1:1, v/v) was added to the residue. The extraction procedure yielded 95.0% average recovery. Analysis was carried out by a GC-MS system, and separation was achieved by a 30 m × 0.2, 5 μm I.D. column, 0.25 mm ZB5 column. The CCβ was 0.087 mg/kg [47]. Chloramphenicol and Chloramphenicol glucuronide were extracted from the spiked samples with 7 mL of acetonitrile and a SPE cleanup step with a Chem-Elut cartridge followed. Analytes were eluted twice with 15 mL and 15 mL of dichloromethane, the eluate was evaporated to dryness under a nitrogen stream at 45–50 °C, and the residue was re-suspended with 5 mL of hexane:ethyl acetate (50:50 v:v). A second SPE cleanup step followed with a Bond Elut-NH2 cartridge. Analytes were eluted with 3 mL of ethyl acetate:methanol (50:50 v:v), the eluate was evaporated to dryness under nitrogen stream at 45–50 °C, and the residue was re-dissolved in 300 μL of HPLC grade water. Analysis was carried out by an LC-MS/MS system, separation was achieved by a Nucleodur 5 μm C-18 (EC), 125 × 2.0 mm column, and the mobile phase consisted of 55% 10 mM ammonium acetate and 45% methanol delivered isocratically. The CCβ was 0.17 μg/kg [48]. Chloramphenicol was extracted from spiked samples with 40 mL of a 0.05-mol/L phosphate buffer (pH 7.0), and 3 mL of 15% trichloroacetic acid in water were added to the extracts in order to precipitate the proteins. The extract was loaded into MISPE cartridges, the eluates were evaporated to dryness under nitrogen stream, and the residue was re-dissolved in mobile phase. The extraction procedure yielded recoveries between 84.9%–89.0%. Analysis was carried out by a HPLC system coupled with a UV detector, separation was achieved by a Beckman C18 column cartridge (4.6 mm × 250 mm, 5 μm), and the mobile phase consisted of methanol and water (40:60, v/v) delivered isocratically. The developed MISPE method provides simple cleanup and preconcentration of CAP with high efficiency, which can increase the sensitivity of conventional chromatographic methods. Additionally, MISPE can be used for enrichment, purification and determination of trace CAP from complex food matrices [49]. Chloramphenicol, thiamphenicol, florfenicol and florfenicol amine spiked samples were blended with 2 g of C18 material (dispersion adsorbent). The mixture was transferred to a glass column with degreased cotton packed at the bottom and at the top of the sample mixture, and the column was tightly compressed. The analytes were eluted with 5 mL of ethyl acetate-ACN-25% ammonium hydroxide (10/88/2, v/v/v), the eluate was dried under nitrogen stream at 50 °C, and the residue was reconstituted with 1 mL of 5% MeOH in a 0.1% formic acid-5 mmol/L ammonium acetate solution. The extraction procedure yielded recoveries between 84.0%–98.8%. Analysis was carried out by an LC-MS/MS system, separation was achieved by a Hypersil C18 column (150 mm × 2.1 μm, 5 μm), and the mobile phase consisted of 0.1% formic acid solvent (including 5 mmol/L ammonium acetate) and methanol delivered using gradient elution. The CCβ was 0.05, 0.11, 0.13, 0.04 μg/kg for florfenicol, florfenicol amine, thiamphenicol and CAP, respectively [50]. Chloramphenicol, florfenicol and thiamphenicol shrimp samples were mixed with 0.5 g of sea sand and 1 g of anhydrous sodium sulfate using a glass mortar. The dry mixture was placed into a SFE chamber that was closed and attached to the SFE system. The extract was evaporated to dryness under nitrogen stream, and the residue was re-dissolved with ethyl acetate for GC-MS analysis. The extraction procedure yielded 92.0%, 87.0%, 85.0% recovery for chloramphenicol, florfenicol and thiamphenicol, respectively. The analytes were collected by in situ silylation with Sylon BFT, analysis was carried out by a GC-MS system, and separation was achieved by a TR-5MS (30 m × 0.25 mm i.d. × 0.25 μm film thickness (Thermo Electron, Waltham, MA, USA). The LOD was 8.7, 15.8, 17.4 pg/g for chloramphenicol, florfenicol and thiamphenicol, respectively [51]. Chloramphenicol was extracted from the shrimp samples with ethyl acetate, the extract was evaporated and the dry residue was re-dissolved in 15 mL of salting out solution. In order to remove the fatty components, n-hexane was also added. A second extraction with ethyl acetate followed, the extract was evaporated, and the dry residue was re-dissolved in 5 mL of ACN-water (10:90, v/v). A cleanup step with sol-gel filter column on-line coupled to an immunoaffinity column containing anti-CAP antibodies followed, and CAP was eluted with 10 mL of ACN-water (40:60, v/v). For better analyte concentration, the eluate was extracted twice with 3 mL of ethyl acetate and the addition of 2 g sodium sulfate. The extract was evaporated to dryness under nitrogen stream, and the residue was re-dissolved in 1 mL of ACN-water (10:90, v/v). The extraction procedure yielded 68.0% recovery. Analysis was carried out by a HPLC system coupled with a UV detector, separation was achieved by a Spherisorb S ODS1, 250 × 4.6 mm I.D., 5 μm, column, and the mobile phase consisted of 10 mM sodium acetate pH 5.4 and ACN using gradient elution. The LOD was LOD 1.8 ng/g. The immunoaffinity columns developed in this study could efficiently remove the shrimp matrix interferences and could be repeatedly used without a decrease in their cleanup efficiency [52]. Ultrasound-assisted matrix solid phase dispersion (MSPD) was applied for the extraction of Chloramphenicol, thiamphenicol and florfenicol. Preconditioned SPE sorbent was mixed with the spiked sample, the mixture was replaced in the SPE cartridge, and the antibiotics were eluted with 1 mL of acetonitrile and then with 1 mL of methanol. The extract was evaporated to dryness under nitrogen stream at 40 °C, and the residue was re-dissolved in 400 μL of lamotrigine aqueous solution 10 ng/mL. The extraction procedure yielded recoveries between 81.3%–114.5%, 72.0%–103.3%, 89.1%–120.6% for thiamphenicol, florfenicol and CAP, respectively. Analysis was carried out by a HPLC system coupled with a diode array detector, separation was achieved by a LiChroCART-LiChrospher® 100 RP-18 (5 μm, 250 × 4 mm) (Merck, Darmstadt, Germany) column, and the mobile phase consisted of ammonium acetate (0.05M) and ACN (70:30 v/v, isocratic elution). The LOQ was 20 μg/kg for all analytes [53].3.4. Extraction of Sulfonamides
Sulfadiazine, sulfamerazine, sulfameter, sulfamethazine, sulfamethoxazole and sulfadimethoxine were extracted using MIP-based SPE and determined with HLPC-UV. Extraction was performed on the shrimp samples with an aquatic solution of acetic acid followed by vortexing, sonication and centrifugation. The supernatant was loaded into the MISPE/NISPE cartridges. The cartridges were washed with acetonitrile in water and elution took place with MeOH/acetic acid, and the eluate was evaporated to dryness under nitrogen flow. The residue was dissolved in acetonitrile in water, filtered and analyzed. Solvent A in the mobile phase was acetic acid/water and solvent B was acetonitrile. Gradient analysis was performed at a flow rate of 1 mL·min−1, and the UV detector was set at 270 nm. The recoveries obtained ranged from 85.5% to 106.1%, while LOD was among 8.4 to 10.9 μg/kg, and LOQ was among 22.4 to 27.7 μg/kg [54]. Fourteen sulfonamides were determined in shrimp samples. Extraction was performed with acetonitrile followed by a sonication step and a centrifugation step. The supernatant was kept, and the same process of extraction was followed once more. C18 powder was added into the 2 supernatants after being put together, the solution was homogenized and centrifuged. The supernatant of this step was evaporated to dryness under nitrogen flow. The residue was dissolved with potassium dihydrogen phosphate and filtered before HLPC injection. The mobile phase consisted of potassium dihydrogen (A) and methanol (B). A Capcellpak C18 column was used, flow rate was set at 1 mL·min−1, and the detection was performed at 270 nm. The recoveries ranged from 51.8% to 89.7%. The LOD for SAs was among 3 and 6 μg/kg, and the LOQ among 9 and 18 μg/kg [55]. Fourteen sulfonamides, sulfanilamine, sulfadiazine, sulfathiazole, sulfapyridine, sulfamerazine, sulfamethazine, sulfamethizole, sulfamethoxypyridazine, sulfachloropyridazine, sulfadimethoxine and sulfadoxine, sulfamethoxazole, sulfamethoxine, and sulfaquinoxaline residues were determined in shrimps. The samples were homogenized and a mixture of acetic acid-methanol-acetonitrile and acetonitrile were added to them. After centrifugation, the supernatant was transferred to a separatory funnel with DI water and DEG. Methylene chloride was added to the funnel, and separation was performed; the bottom layer was collected and evaporated to a final volume of 2–3 mL with a rotary evaporator. The solution was applied to a SCX SPE cartridge, and the sulfonamides were eluted with acetone-ammonium acetate mix. The eluate was evaporated to a final volume of 2 mL, prior to LC analysis. The analytical column used for the separation was a Symmetry C18, 3.5 μm, 150 mm × 4.6 mm I.D. The mobile phase consisted of aqueous acetic acid-methanol-acetonitrile (A) and acetonitrile (B). Post-column derivatization took place with fluorescamine solution. The fluorescent detection was performed at 400 nm excitation wavelength and 495 nm emission wavelength. The mean recoveries for the spiked shrimp samples at three levels ranged from 67.3% to 90.5% [56]. Seven sulfonamides (sulfaguanidine, sulfadiazine, sulfamethazine, sulfamonomethixine, sulfamethoxazole, sulfadimethoxine and sulfaquinoxaline) were determined in shrimp samples with a monolithic column coupled with boron-doped diamond amperometric detection. Extraction was performed to the samples with Na2EDTA-Mcllvaine’s buffer solution, and the mixture was sonicated and centrifuged. The supernatant was applied to an Oasis SPE cartridge and elution was performed with methanol. The eluate was evaporated under nitrogen flow, and the residue was dissolved with the mobile phase and filtered, prior to HPLC-EC analysis. Separation was achieved with the use of a monolithic column. The mobile phase consisted of phosphate buffer, acetonitrile and ethanol. The LOD value was found between 1.2 ng/mL and 3.4 ng/mL, and the LOQ value was found between 4.1 ng/mL and 11.3 ng/mL [57]. Eight sulfonamides (sulfachloropyridazine, sulfadiazine, sulfamerazine, sulfamethazine, sulfamethizole, sulfmethoxazole, sulfanilamine and sulfathiazole) were determined in shrimp samples using LC-MS/MS analysis. The shrimp samples were spiked, the extraction of sulfonamides was achieved with acetonitrile in acidic conditions, and EDTA was added to the extract, prior to SPE step. An Oasis HLB SPE cartridge was loaded with the extract, the drugs were eluted with methanol, and then the solution was evaporated to a final volume of 4 mL. The analysis was carried out using a triple quadrupole LC-MS/MS with positive electrospray ionization and MRM mode. A reverse-phased C18 column was used for the separation of the drugs, and the mobile phase consisted of HPLC-grade water with formic acid and ammonium formate (A) and a mixture 1:1 (v:v) of methanol-acetonitrile [58]. Eight sulfonamides (sulfadiazine, sulfamerazine, sulfaguanidine, sulfisoxazole, sufladimethoxine, sulfamonomethoxine, sulfadoxine and sulfamethoxazole) were determined in shrimp samples with UPLC analysis using a graphene/polyaniline modified screen-printed carbon electrode. The samples were extracted with a Na2EDTA-Mckkvaine buffer solution. The mixture was vortexed, sonicated and centrifuged. The supernatant was applied to a Microcolumn VertipakTM for the SPE procedure, the sulfonamides were eluted with methanol, and the extract was filtered before UPLC injection. The mobile phase consisted of phosphate solution: acetonitrile: ethanol, and the potential used was +1.4 V vs. Ag/AgCl. The LOD was found between 1.162 ng/mL and 2.900 ng/mL, and the LOQ was found between 3.336 ng/mL and 20.425 ng/mL [59]3.5. Extraction of Macrolides
Nine macrolides (erythromycin, tylosin, josamycin, spiromicyn, neospiromycin, tlmicosin, gamithromycin, tildipirosin and oleandomycin) were determined in shrimp samples with LC-MS/MS analysis. Extraction was performed to homogenized samples using bearing balls, water and acetonitrile. The mix was centrifuged, the supernatant was kept to another tube, and extraction was performed again to the sample with acetonitrile and phosphate buffer. The complete supernatant was centrifuged and then applied to a Bond-Elut C18 SPE cartridge. Elution was achieved with methanolic ammonium acetate, and hexane was added to remove the fat. Hexane was removed by aspiration, and the solution was evaporated under nitrogen flow to a final volume of less than 1 mL. Methanolic ammonium acetate and methanol was added to the solution to a final volume of 1 mL, and the mix was centrifuged. A quantity of it was filtered and remained overnight before LC-MS/MS analysis. The analytical column used for the separation of the macrolides was a Kinetex 2.6 μm XB-C18 2.1 mm I.D. × 100 mm and a SecurityGuard Ultra C18 2.1 mm guard. The mobile phase consisted of an aqueous solution of formic acid and acetonitrile, and the detection was performed with a triple quadrupole MS/MS combined with an electrospray ionization source in the positive mode. The LOD was 0.5 μg/kg, and recoveries were found between 47% and 99% [60]. Six macrolides (erythromycin, elandomycin, azithromycin, clarithromycin, tilmicocin and roxithromycin) were determined in shrimp samples using HPLC-UV analysis, after sample preparation with magnetic MIP-based SPE. The samples were spiked and remained overnight. NaOH and acetonitrile were added the next day, and the mix was vortexed and centrifuged. MSPE was performed to the supernatant with MMIPs, which were magnetically separated from the solution. Elution of the macrolides from the MMIPs was achieved with a mixture of methanol and KH2PO4. The eluate was evaporated to dryness under nitrogen flow, and the residue was dissolved with a mixture of acetonitrile and KH2PO4. The separation of the macrolides was achieved with a SunFireTM C18 column (250 mm × 4.6 mm I.D., 5 μm, Waters). The mobile phase consisted of acetonitrile (A) and KH2PO4 (B), and the detection was performed at 210 nm. The LOD was found between 0.015 μg/kg and 0.2 μg/kg, and the LOQ was found between 0.075 μg/kg and 0.5 μg/kg [61].3.6. Extraction of Nitrofurans
Furazolidone, furaltadone, nitrofurazone and nitrofurantoin were determined in shrimp samples with UPLC-MS analysis. The four drugs were extracted from the samples by using HCl and were derivatized with 2-nitrobenzaldehyde (NBA). After remaining overnight, the samples were neutralized and centrifuged, and the supernatant was applied to preconditioned Oasis HLB cartridges. Elution was performed with ethyl acetate, and the eluate was evaporated to dryness under nitrogen flow, reconstituted in the mobile phase and filtered. The mobile phase was methanol and an aqueous solution of ammonium formate. The LOD was between 0.5–0.8 mg/kg, and LOQ was 1 mg/kg [62]. Four nitrofuran metabolites, 3-amino-2-oxazolidinone (AOZ), 3-amino-5-morpholino-methyl-1,3-oxazolidinone (AMOZ), semicarbazide (SEM) and 1-aminohydatoin (AHD), were determined in shrimp tissue. The samples were washed with methanol, HCl solution was then added, and derivatization was achieved with 2-NBA. After remaining overnight in an incubator, the samples were neutralized and extracted with ethyl acetate. The extract was evaporated to dryness under nitrogen flow, and the residue was reconstituted with reconstitution solvent (water, acetonitrile, glacial acetic acid). Extraction with hexane was performed, and the final aqueous solution was filtered, prior to HPLC analysis. The mobile phase consisted of water, glacial acetic acid (A) and acetonitrile, water, glacial acetic acid (B). The UV detection was achieved at 275 nm. The recoveries for spiked samples, for the four metabolites, were found between 107% and 115% [63]. Four nitrofuran metabolites, AOZ, AMOZ, SEM and AHD, were determined in shrimp samples with LC-IDMS/MS analysis. The samples were acidified with HCl, derivatized with 2-NBA and left in an incubator overnight. After being neutralized, the samples were extracted twice with ethyl acetate and the extract was evaporated to dryness under nitrogen flow. The residue was dissolved with HPLC grade water and filtered before LC analysis. A Symmetry C18 (2.1 × 150 mm, 3.5 μm) analytical column and a Symmetry C18 guard column (2.1 × 10 mm, 3.5 μm) were used. The mobile phase consisted of acetonitrile (A) and water with aqueous solution acetic acid (B). The CCα of the derivatized metabolites was between 0.08 μg·kg−1 and 0.20 μg/kg. The CCβ was between 0.13 μg/kg and 0.85 μg/kg [64]. Four nitrofuran metabolites (furalizone—AOZ, furaltadone—AMOZ, nitrofurazone—SEM and nitrofurantoin—AHD) were determined in shrimp samples using LC-MS/MS analysis. The samples were firstly washed with methanol, HCl and 2 NBA were then added to them, and the samples were kept overnight in an incubator. After being neutralized with NaOH, ethyl acetate was added to the samples, and they were centrifuged. The supernatant was evaporated near to dryness, the residue was re-dissolved with methanol, and the final mixture was filtered before LC-MS/MS analysis. The CCα was between 0.12 μg/kg and 0.23 μg/kg. The CCβ was between 0.21 μg/kg and 0.38 μg/kg, and the recoveries were found to be 88%–110% [65].3.7. Multi-Residue Methods
Thirteen sulfonamides, 3 fluoroquinolones and 3 quinolones were extracted from the spiked samples with 10 mL of acetonitrile and the addition of 0.1 mL p-toluenesulfonic acid monohydrate (p-TSA), 0.1 mL N,N,N′,N′-tetramethyl-p-phenylenediamine dihydrochloride (TMPD) solution, 2 g NaCl and ceramic homogenizer pellet. The extract was evaporated to dryness under nitrogen stream at 50–55 °C, and the residue was re-dissolved in 2 mL of acetonitrile:formic acid:water (10:0.4:89.6 v/v). The extraction procedure yielded 98.0%–104.0% average recovery for all analytes. Analysis was carried out by LC-MS/MS system, separation was achieved by a YMC ODS-AQ 2 × 100 mm, 3 μm column, and the mobile phase consisted of 0.1% formic acid in water and acetonitrile delivered under gradient elution. This method does not require a SPE cleanup step because it is fast and inexpensive, and an analytical chemist can prepare and analyze 12–16 samples per working day [66]. Five different sample treatment methods were tested for the extraction of multiclass antibiotics and veterinary drugs: benzalkonium chloride, ethoxyquin, leucomalachite green, malachite green, mebendazole, sulfadiazine, sulfadimethoxine, sulfamethazine, sulfamethizole, sulfanilamide, sulfapyridine, sulfathiazole and trimethoprim. The sample preparation was as follows:- (1)
-
Spiked samples were extracted with 10 mL of acetonitrile containing 1% acetic acid with the addition of 4 g of anhydrous magnesium sulfate and 1.75 g of sodium chloride. 250 mg of primary-secondary amine and 750 mg of anhydrous magnesium sulfate were added to 5 mL of the acetonitrile supernatant. The final extract was evaporated to near dryness, reconstituted with 20% (v/v) methanol in water to a final volume of 2 mL.
- (2)
-
Spiked samples were extracted with 6 mL of trifluoroacetic (20%, w/v), and the extract was evaporated to near dryness and reconstituted with 20% (v/v) methanol in water to a final volume of 0.5 mL.
- (3)
-
Spiked shrimp samples were mixed with 2 g of aminopropyl (Bondesil-NH2), and the mixture was transferred to a SPE cartridge. The antibiotics were eluted twice with 5 mL of acetonitrile, and the eluates were evaporated to near dryness and reconstituted with 20% (v/v) methanol in water to a final volume of 1 mL.
- (4)
-
Spiked shrimp samples were mixed with 3 mL of sulfuric acid 0.17 M, 0.158 g of sodium tungstate and 12 mL of acetonitrile in order to precipitate the proteins. An SPE cleanup step followed, with a C18 cartridge preconditioned with 5 mL of methanol and 5 mL of water. The analytes were eluted with 1 mL of acetonitrile/water (30:70 v/v), 2 × 2 mL of ethyl acetate were added to the eluate, and the organic extracts were evaporated to near dryness and with 20% (v/v) methanol in water to a final volume of 1 mL.
- (5)
-
In order to precipitate the proteins, spiked shrimp samples were mixed with 100 mL of 0.2% of metaphosphoric acid in acetonitrile, the mixture was filtered through a 0.45 μm filter, and the extract was evaporated to a final volume of 30 mL. A SPE cleanup step followed with an Oasis HLB SPE cartridge, and the analytes were eluted with 5 mL of acetonitrile. The eluate was evaporated to near dryness and reconstituted with 20% (v/v) methanol in water to a final volume of 1 mL.
References
- Food and Agriculture Organization of the United Nations. Available online: http://www.fao.org/fishery/cwp/handbook/j/en (accessed on 9 December 2015).
- Cole, D.W.; Cole, R.; Gaydos, S.J.; Gray, J.; Hyland, G.; Jacques, M.L.; Powell-Dunford, N.; Sawhney, C.; Au, W.W. Aquaculture: Environmental, Toxicological, and Health Issues. Int. J. Hyg. Environ. Health 2009, 212, 369–377.
- Sapkota, A.; Sapkota, A.R.; Kucharski, M.; Burke, J.; McKenzie, S.; Walker, P.; Lawrence, R. Aquaculture Practices and Potential Human Health Risks: Current Knowledge and Future Priorities. Environ. Int. 2008, 34, 1215–1226.
- Gillett, R. Global Study of Shrimp Fisheries; FAO: Rome, Italy, 2008; Volume 475.
- Rigos, G.; Troisi, G.M. Antibacterial Agents in Mediterranean Finfish Farming: A Synopsis of Drug Pharmacokinetics in Important Euryhaline Fish Species and Possible Environmental Implications. Rev. Fish Biol. Fish. 2005, 15, 53–73.
- Defoirdt, T.; Sorgeloos, P.; Bossier, P. Alternatives to Antibiotics for the Control of Bacterial Disease in Aquaculture. Curr. Opin. Microbiol. 2011, 14, 251–258.
- Bermúdez-Almada, M.C.; Espinosa-Plascencia, A. The Use of Antibiotics in Shrimp Farming. In Health and Environment in Aquaculture; Carvalho, E., Ed.; InTech: Rijeka, Croatia, 2010; pp. 199–214.
- Mo, W.Y.; Chen, Z.; Leung, H.M.; Leung, A.O.W. Application of Veterinary Antibiotics in China’s Aquaculture Industry and Their Potential Human Health Risks. Environ. Sci. Pollut. Res. 2015.
- Samanidou, V.F.; Evaggelopoulou, E.N. Analytical Strategies to Determine Antibiotic Residues in Fish. J. Sep. Sci. 2007, 30, 2549–2569.
- Finch, R.G.; Greenwood, D.; Whitley, R.J.; Norrby, S.R. Antibiotic and Chemotherapy, 9th ed.; Elsevier: Amsterdam, The Netherlands, 2010.
- Wagman, A.S.; Wentland, M.P. Quinolone Antibacterial Agents. In Comprehensive Medicinal Chemistry II; Elsevier: Amsterdam, The Netherlands, 2007; pp. 567–596.
- Sousa, J.; Alves, G.; Abrantes, J.; Fortuna, A.; Falcão, A. Analytical Methods for Determination of New Fluoroquinolones in Biological Matrices and Pharmaceutical Formulations by Liquid Chromatography: A Review. Anal. Bioanal. Chem. 2012, 403, 93–129.
- Cheng, G.; Hao, H.; Dai, M.; Liu, Z.; Yuan, Z. Antibacterial Action of Quinolones: From Target to Network. Eur. J. Med. Chem. 2013, 66, 555–562.
- EUR-Lex. Available online: http://eur-lex.europa.eu/legal-content/EN (accessed on 9 December 2015).
- Rang, H.P.; Ritter, J.M.; Flower, R.J.; Henderson, G. RANG & DALE’S Pharmacology, 8th ed.; Elsevier: Amsterdam, The Netherlands, 2016.
- Nelson, M.L.; Ismail, M.Y. The Antibiotic and NonantibioticTetracyclines. In Comprehensive Medicinal Chemistry II; Elsevier: Amsterdam, The Netherlands, 2007; pp. 597–628.
- Nicolaou, K.C.; Chen, J.S.; Edmonds, D.J.; Estrada, A.A. Recent Advances in the Chemistry and Biology of Naturally Occurring Antibiotics. Angew. Chem. Int. Ed. 2010, 48, 660–719.
- U.S. Food and Drug Administration. Available online: http://www.fda.gov/AnimalVeterinary/DevelopmentApprovalProcess/Aquaculture/ucm132954.htm (accessed on 9 December 2015).
- Hauser, A.R. Antibiotics Basics for Clinicians: The ABCs of Choosing the Right Antibacterial Agent, 2nd ed.; Lippincott Williams & Wilkins: Philadelphia, PA, USA, 2007.
- Manivasagan, P.; Venkatesan, J.; Sivakumar, K.; Kim, S.K. Marine Actinobacterial Metabolites: Current Status and Future Perspectives. Microbiol. Res. 2013, 168, 311–332.
- Kaneko, T.; Dougherty, T.J.; Magee, T.V. Macrolide Antibiotics. In Comprehensive Medicinal Chemistry II; Elsevier: Amsterdam, The Netherlands, 2007; pp. 520–539.
- Aronson, J.K. Meyler’s Side Effects of Drugs: The International Encyclopedia of Adverse Drug Reactions and Interactions; Elsevier: Amsterdam, The Netherlands, 2006; pp. 2248–2249.
- Dost, K.; Jones, D.C.; Davidson, G. Determination of sulfomamides by packed column supercritical fluid chromatography with atmospheric pressure chemical ionization mass spectrometric detection. Analyst 2000, 125, 1243–1247.
- FAO/WHO. Evaluation of Certain Veterinary Drug Residues in Food; 40th Report of the Joint FAO/WHO Expert Committee on Food; World Health Organization: Geneva, Switzerland, 1993.
- Garrido-Frenich, A.; Plaza-Bolanos, P.; Aguilera-Luiz, M.M.; Martinez-Vidal, J.L. Recent advances in the analysis of veterinary drugs and growth promoting agents by chromatographic techniques. In Chromatography Types, Techniques and Methods; Quintin, T.J., Ed.; Nova Science Publishers, Inc.: New York, NY, USA, 2009; pp. 1–102.
- Delatour, T.; Gremaud, E.; Mottier, P.; Richoz, J.; Vera, F.A.; Stadler, R.H. Preparation of stable isotope-labeled 2-nitrobenzaldehyde derivatives of four metabolites of nitrofuran antibiotics and their comprehensive characterization by UV, MS, and NMR techniques. J. Agric. Food Chem. 2003, 51, 6371–6379.
- Tarbin, J.A.; Potter, R.A.; Stolker, A.A.M.; Berendsen, B. Single-residue quantitative and confirmatory methods. In Chemical Analysis of Antibiotic Residues in Food; Wiley: Hoboken, NJ, USA, 2011; pp. 227–262.
- Sriket, P.; Benjakul, S.; Visessanguan, W.; Kijroongrojana, K. Comparative Studies on Chemical Composition and Thermal Properties of Black Tiger Shrimp (Penaeus monodon) and White Shrimp (Penaeus vannamei) Meats. Food Chem. 2007, 103, 1199–1207.
- Danyi, S.; Widart, J.; Douny, C.; Dang, P.K.; Baiwir, D.; Wang, N.; Tu, H.T.; Tung, V.T.; Phuong, N.T.; Kestemont, P.; et al. Determination and Kinetics of Enrofloxacin and Ciprofloxacin in Tra Catfish (Pangasianodon Hypophthalmus) and Giant Freshwater Prawn (Macrobrachium Rosenbergii) Using a Liquid Chromatography/mass Spectrometry Method. J. Vet. Pharmacol. Ther. 2011, 34, 142–152.
- Pearce, J.N.; Burns, B.G.; van de Riet, J.M.; Casey, M.D.; Potter, R.A. Determination of Fluoroquinolones in Aquaculture Products by Ultra-Performance Liquid Chromatography-Tandem Mass Spectrometry (UPLC-MS/MS). Food Addit. Contam. A Chem. Anal. Control Expo. Risk Assess. 2009, 26, 39–46.
- Wan, G.H.; Cui, H.; Pan, Y.L.; Zheng, P.; Liu, L.J. Determination of Quinolones Residues in Prawn Using High-Performance Liquid Chromatography with Ce(IV)-Ru(bpy)32+-HNO3 Chemiluminescence Detection. J. Chromatogr. B Anal. Technol. Biomed. Life Sci. 2006, 843, 1–9.
- Poapolathep, A.; Jermnak, U.; Chareonsan, A.; Sakulthaew, C.; Klangkaew, N.; Sukasem, T.; Kumagai, S. Dispositions and Residue Depletion of Enrofloxacin and Its Metabolite Ciprofloxacin in Muscle Tissue of Giant Freshwater Prawns (Macrobrachium Rosenbergii). J. Vet. Pharmacol. Ther. 2009, 32, 229–234.
- Takeda, N.; Gotoh, M.; Matsuoka, T. Rapid Screening Method for Quinolone Residues in Livestock and Fishery Products Using Immobilised Metal Chelate Affinity Chromatographic Clean-up and Liquid Chromatography-Fluorescence Detection. Food Addit.Contam. A Chem. Anal. Control Expo. Risk Assess. 2011, 28, 1168–1174.
- Schröder, U.; MacHetzki, A. Determination of Flumequine, Nalidixic Acid and Oxolinic Acid in Shrimps by High-Performance Liquid Chromatography with Fluorescence Detection. Eur. Food Res. Technol. 2007, 225, 627–634.
- Karbiwnyk, C.M.; Carr, L.E.; Turnipseed, S.B.; Andersen, W.C.; Miller, K.E. Determination of Quinolone Residues in Shrimp Using Liquid Chromatography with Fluorescence Detection and Residue Confirmation by Mass Spectrometry. Anal. Chim. Acta 2007, 596, 257–263.
- Lohne, J.J.; Andersen, W.C.; Clark, S.B.; Turnipseed, S.B.; Madson, M.R. Laser Diode Thermal Desorption Mass Spectrometry for the Analysis of Quinolone Antibiotic Residues in Aquacultured Seafood. Rapid Commun. Mass Spectrom. 2012, 26, 2854–2864.
- Costi, E.M.; Sicilia, M.D.; Rubio, S. Supramolecular Solvents in Solid Sample Microextractions: Application to the Determination of Residues of Oxolinic Acid and Flumequine in Fish and Shellfish. J. Chromatogr. A 2010, 1217, 1447–1454.
- Wang, J.; Dai, J.; Meng, M.; Song, Z.; Pan, J.; Yan, Y.; Li, C. Surface Molecularly Imprinted Polymers Based on Yeast Prepared by Atom Transfer Radical Emulsion Polymerization for Selective Recognition of Ciprofloxacin from Aqueous Medium. J. Appl. Polym. Sci. 2014.
- Andersen, W.C.; Roybal, J.E.; Gonzales, S.A.; Turnipseed, S.B.; Pfenning, A.P.; Kuck, L.R. Determination of Tetracycline Residues in Shrimp and Whole Milk Using Liquid Chromatography with Ultraviolet Detection and Residue Confirmation by Mass Spectrometry. Anal. Chim. Acta 2005, 529, 145–150.
- Treetepvijit, S.; Preechaworapun, A.; Praphairaksit, N.; Chuanuwatanakul, S.; Einaga, Y.; Chailapakul, O. Use of Nickel Implanted Boron-Doped Diamond Thin Film Electrode Coupled to HPLC System for the Determination of Tetracyclines. Talanta 2006, 68, 1329–1335.
- Venkatesh, P.; Kumar, N.A.; Prasad, R.H.; Krishnamoorthy, K.B.; Prasath, K.H.; Soumya, V. LC-MS/MS Analysis of Tetracycline Antibiotics in Prawns (Penaeus monodon) from South India Coastal Region. JOPR J. Pharm. Res. 2012, 6, 48–52.
- Liu, Y.; Yang, H.; Yang, S.; Hu, Q.; Cheng, H.; Liu, H.; Qiu, Y. High-Performance Liquid Chromatography Using Pressurized Liquid Extraction for the Determination of Seven Tetracyclines in Egg, Fish and Shrimp. J. Chromatogr. B Anal. Technol. Biomed. Life Sci. 2013, 917–918, 11–17.
- Siqueira, S.R.R.; Donato, J.L.; de Nucci, G.; Reyes, F.G.R. A High-Throughput Method for Determining Chloramphenicol Residues in Poultry, Egg, Shrimp, Fish, Swine and Bovine Using LC-ESI-MS/MS. J. Sep. Sci. 2009, 32, 4012–4019.
- Douny, C.; Widart, J.; de Pauw, E.; Maghuin-Rogister, G.; Scippo, M.L. Determination of Chloramphenicol in Honey, Shrimp, and Poultry Meat with Liquid Chromatography-Mass Spectrometry: Validation of the Method According to Commission Decision 2002/657/EC. Food Anal. Methods 2013, 6, 1458–1465.
- Tyagi, A.; Vernekar, P.; Karunasagar, I.; Karunasagar, I. Determination of Chloramphenicol in Shrimp by Liquid Chromatography-Electrospray Ionization Tandem Mass Spectrometry (LC-ESI-MS-MS). Food Addit. Contam. A Chem. Anal. Control Expo. Risk Assess. 2008, 25, 432–437.
- Barreto, F.; Ribeiro, C.; Hoff, R.B.; Costa, T.D. Determination and Confirmation of Chloramphenicol in Honey, Fish and Prawns by Liquid Chromatography-tandem Mass Spectrometry with Minimum Sample Preparation: Validation according to 2002/657/EC Directive. Food Addit.Contam. A 2012, 29, 550–558.
- Polzer, J.; Hackenberg, R.; Stachel, C.; Gowik, P. Determination of Chloramphenicol Residues in Crustaceans: Preparation and Evaluation of a Proficiency Test in Germany. Food Addit. Contam. 2006, 23, 1132–1140.
- Ashwin, H.M.; Stead, S.L.; Taylor, J.C.; Startin, J.R.; Richmond, S.F.; Homer, V.; Bigwood, T.; Sharman, M. Development and Validation of Screening and Confirmatory Methods for the Detection of Chloramphenicol and Chloramphenicol Glucuronide Using SPR Biosensor and Liquid Chromatography-tandem Mass Spectrometry. Anal. Chim. Acta 2005, 529, 103–108.
- Shi, X.; Wu, A.; Zheng, S.; Li, R.; Zhang, D. Molecularly Imprinted Polymer Microspheres for Solid-Phase Extraction of Chloramphenicol Residues in Foods. J. Chromatogr. B Anal. Technol. Biomed. Life Sci. 2007, 850, 24–30.
- Tao, Y.; Zhu, F.; Chen, D.; Wei, H.; Pan, Y.; Wang, X.; Liu, Z.; Huang, L.; Wang, Y.; Yuan, Z. Evaluation of Matrix Solid-Phase Dispersion (MSPD) Extraction for Multi-Fenicols Determination in Shrimp and Fish by Liquid Chromatography-Electrospray Ionisation Tandem Mass Spectrometry. Food Chem. 2014, 150, 500–506.
- Liu, W.L.; Lee, R.J.; Lee, M.R. Supercritical Fluid Extraction in Situ Derivatization for Simultaneous Determination of Chloramphenicol, Florfenicol and Thiamphenicol in Shrimp. Food Chem. 2010, 121, 797–802.
- Stidl, R.; Cichna-Markl, M. Sample Clean-up by Sol-Gel Immunoaffinity Chromatography for Determination of Chloramphenicol in Shrimp. J. Sol Gel Sci. Technol. 2007, 41, 175–183.
- Samanidou, V.F.; Makrygianni, E.A. Ultrasound-Assisted Matrix Solid Phase Dispersion for the HPLC-DAD Analysis of Amphenicols in Shrimps. Sample Prep. 2015, 2, 66–73.
- Shi, X.; Meng, Y.; Liu, J.; Sun, A.; Li, D.; Yao, C.; Lu, Y.; Chen, J. Group-selective molecularly imprinted polymer solid phase extraction for the simultaneous determination of six sulfonamides in aquaculture products. J.Chromatogr. B 2011, 879, 1071–1076.
- Won, S.Y.; Lee, C.H.; Chang, H.S.; Kim, S.O.; Lee, S.H.; Kim, D.S. Monitoring of 14 sulfonamide antibiotic residues in marine products using HPLC-PDA and LC-MS/MS. Food Control 2011, 22, 1101–1107.
- Gehring, T.A.; Griffin, B.; Williams, R.; Geiseker, C.; Rushing, L.G.; Siitonen, P.H. Multiresidue determination of sulfonamides in edible catfish, shrimp and salmon tissues by high-performance liquid chromatography with postcolumn derivatization and fluorescence detection. J. Chromatogr. B 2006, 840, 132–138.
- Sangjarusvichai, H.; Dungchai, W.; Siangproh, W.; Chailapakul, O. Rapid separation and highly sensitive detection methodology for sulfonamides in shrimp using a monolithic column coupled with BDD amperometric detection. Talanta 2009, 79, 1036–1041.
- Done, H.Y.; Halden, R.U. Reconnaissance of 47 antibiotics and associated microbial risks in seafood sold in the United States. J. Hazard. Mater. 2015, 282, 10–17.
- Thammasoontaree, N.; Rattanarat, P.; Ruecha, N.; Siangproh, W.; Rodthongkum, N.; Chailapakul, O. Ultra-performance liquid chromatography coupled with graphene/polyaniline nanocomposite modified electrode for the determination of sulfonamide residues. Talanta 2014, 123, 115–121.
- Dickson, L.C. Performance characterization of a quantitative liquid chromatography-tandem mass spectrometric method for 12 macrolide and lincosamide antibiotics in salmon, shrimp and tilapia. J. Chromatogr. B 2014, 967, 203–210.
- Zhou, Y.; Zhou, T.; Jin, H.; Jing, T.; Song, B.; Zhou, Y.; Mei, S.; Lee, Y. Rapid and selective extraction of multiple macrolide antibiotics in foodstuff samples based on magnetic molecularly imprinted polymers. Talanta 2015, 137, 1–10.
- Alarcón-Flores, M.I.; Romero-González, R.; Vidal, J.L.M.; Frenich, A.G. Multiclass determination of phytochemicals in vegetables and fruits by ultra high performance liquid chromatography coupled to tandem mass spectrometry. Food Chem. 2013, 141, 1120–1129.
- Fernando, R.; Munasinghe, D.M.S.; Gunasena, A.R.C.; Abeynayake, P. Determination of nitrofuran metabolites in shrimp muscle tissue by liquid chromatography-photo diode array detection. Food Control 2015, in press.
- Douny, C.; Widart, J.; de Pauw, E.; Silvestre, F.; Kestemont, P.; Tu, H.T.; Phuong, N.T.; Maghuin-Rogister, G.; Scippo, M.L. Development of an analytical method to detect metabolites of nitrofurans: Application to the study of furazolidone elimination in Vietnamese black tiger shrimp (Penaeus monodon). Aquaculture 2013, 376–379, 54–58.
- Hossain, M.B.; Ahmed, S.; Rahman, M.F.; Kamaruzzam, B.Y.; Jalal, K.C.A.; Amin, S.M.N. Method Development and Validation of Nitrofuran Metabolites in Shrimp by Liquid Chromatographic Mass Spectrometric System. J. Biol Sci. 2013, 13, 33–37.
- Storey, J.M.; Clark, S.B.; Johnson, A.S.; Andersen, W.C.; Turnipseed, S.B.; Lohne, J.J.; Burger, R.J.; Ayres, P.R.; Carr, J.R.; Madson, M.R. Analysis of Sulfonamides, Trimethoprim, Fluoroquinolones, Quinolones, Triphenylmethane Dyes and Methyltestosterone in Fish and Shrimp Using Liquid Chromatography-Mass Spectrometry. J. Chromatogr. B 2014, 972, 38–47.
- Villar-Pulido, M.; Gilbert-López, B.; García-Reyes, J.F.; Martos, N.R.; Molina-Díaz, A. Multiclass Detection and Quantitation of Antibiotics and Veterinary Drugs in Shrimps by Fast Liquid Chromatography Time-of-Flight Mass Spectrometry. Talanta 2011, 85, 1419–1427.
- Nakajima, T.; Nagano, C.; Kanda, M.; Hayashi, H.; Hashimoto, T.; Kanai, S.; Matsushima, Y.; Tateishi, Y.; Sasamoto, T.; Takano, I. Single-Laboratory Validation Study of Rapid Analysis Method for Multi-Class Veterinary Drugs in Milk, Fish and Shellfish by LC-MS/MS. ShokuhinEiseigakuZasshi 2013, 54, 335–344.
- Wang, N.; Su, M.; Liang, S.; Sun, H. Sensitive Residue Analysis of Quinolones and Sulfonamides in Aquatic Product by Capillary Zone Electrophoresis Using Large-Volume Sample Stacking with Polarity Switching Combined with Accelerated Solvent Extraction. Food Anal. Methods 2015, 9, 1020–1028.
- Li, H.; Kijak, P.J.; Turnipseed, S.B.; Cui, W. Analysis of veterinary drug residues in shrimp: A multi-class method by liquid chromatography-quadrupole ion trap mass spectrometry. J. Chromatogr. B 2006, 836, 22–38.
More