MicroRNAs, also known as miRNAs, are involved in the regulation of gene expression and their altered levels can be associated to different diseases [29,31], therefore making interesting their employment as biomarkers. Biosensors are developed to obtain accurate data from fluids that originate in the human body and they basically consist of a bioreceptor that binds the target molecule (the biomarker, such as a miRNA) and a transducer that enables a measurable response to be obtained. Optical biosensors are becoming increasingly important, particularly in the case of DNA and RNA biomarkers [12] due to their advantages, including their direct detection, high specificity, sensitivity and good cost-performance ratio among others [13]. An overview of the different optical biosensors used to detect miRNAs is provided, describing the employed technique (fluorescence, plasmon resonances, interferometry, SERS), their performance and main characteristics (LOD and dynamic range).
- optical biosensors
- microRNAs/miRNAs
- biomarkers
- flourescence
- plasmon resonances
- interferometry
- Surface Enhanced Raman Spectroscopy (SERS)
1. Introduction
MicroRNAs or miRNAs are small (around 20 nucleotides in length) and non-coding RNAs (ribonucleic acids) involved in the regulation of gene expression. This regulatory function is accomplished through the RNA-induced silencing complex (RISC). MiRNA assembles into RISC, which targets the messenger RNA (mRNA, responsible for protein synthesis) specified by the miRNA, therefore reducing the expression of the gene that was codified in the mRNA. There are two possible silencing mechanisms: mRNA cleavage or translation repression, where the mechanism that takes place depends on the degree of complementarity between the miRNA and the mRNA target [1][27].
MiRNAs were originally discovered in Caenorhabditis elegans (a species of soil-dwelling nematode) [2] [28] and they are found in most eukaryotes, including humans. The mammalian genome is reported to host around 2200 different miRNA genes, from which over 1000 correspond to the human genome. Furthermore, one third of the human genome is estimated to be regulated by miRNAs [3][29].
The genesis of miRNA involves several steps, shown in Figure 1. In the nucleus, RNA polymerase II transcribes DNA (usually referred to as miRNA genes in this process, as in Figure 1) to a primary miRNA (pri-miRNA). The pri-miRNA is processed to form a precursor stem-loop structure, called pre-miRNA. Then, the pre-miRNA is transported into the cytoplasm and cleaved by the Dicer RNAase III endonuclease to form a miRNA duplex (miRNA:miRNA*, passenger strand designated with an asterisk). The duplex unwinds and the mature miRNA, which is the one that assembles into the RISC, is obtained [1][3][27,29]. The notation miRNA and miRNA* in the miRNA duplex was originally introduced to indicate that the "‘miRNA"’ was the one that generated the mature miRNA and the "‘miRNA*"’ was degraded. However, it was later discovered that the miRNA* is not always degraded and can also generate mature miRNA and play a regulatory role [4][30].
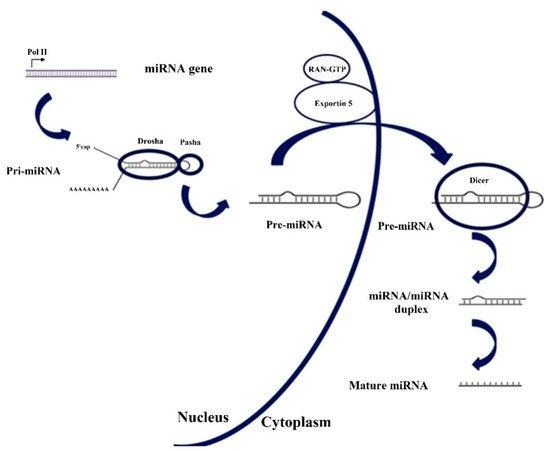
Figure 1. Biosynthesis pathway for miRNA. Reproduced under the terms of the Creative Commons Attribution-Non Commercial 3.0 Unported License (https://creativecommons.org/licenses/by-nc/3.0/) [3][29]. Copyright 2010, The Authors. Published by Avicenna Research Institute (ARI).
In recent years, the implication of miRNAs in human diseases has been thoroughly studied, including cancers (ovarian, liver, bladder, colon), viral infections (hepatitis B, hepatitis C), cardiovascular disease, neurodegenerative diseases (Alzheimer, Huntington'’s disease) or autoimmune diseases (rheumatoid arthritis, systemic lupus erythematosus) [3][5][29,31]. Nevertheless, it has to be taken into account that in every disease, several miRNAs, as well as other biomarkers, should be considered in order to provide an accurate diagnosis. Furthermore, the same miRNA can be dysregulated in several diseases.
The basic operation of a biosensor for miRNA detection consists of using a single-stranded DNA sequence that is complementary to the desired target miRNA. It must be considered that there are five nucleobases (or simply, bases): adenine (A), cytosine (C), guanine (G), thymine (T) and uracil (U). A, C, G, T are present in DNA and A, C, G, U in RNA, with miRNA being a type of RNA, as it has been previously explained. Bases C and G are complementary, and A is complementary with T in DNA and U in RNA. This complementary DNA (cDNA) sequence is usually called DNA probe or capture probe. Sometimes the term hairpin probe is used due to the type of DNA that is employed. The hybridization of the DNA probe with the corresponding miRNA will be directly or indirectly measured by means of an optical technique or principle in the case of the biosensors covered in this entry.
Concerning the miRNA nomenclature, the first three letters that appear in the full name of a miRNA correspond to the organism, with "‘hsa"’ corresponding to Homo sapiens. Lettered suffixes correspond to closely related mature sequences. There are also exceptions to the typical naming structure, such as the let-7 family [6][87].
Sometimes, see Figure 1, two miRNAs are derived from the same gene, which is named with the prefix "‘mir"’ instead of "miR"‘miR’. If one of the miRNAs predominates over the other, they are named miR-126 (the predominant product) and miR-126* (from the opposite arm of the precursor, designated as miRNA* in the explanation about the genesis of miRNAs). When there is no sequence that can be considered predominant, names like hsa-miR-21-5p (from the 5′ arm) and hsa-miR-21-3p (from the 3′ arm) are used [6][87]. Nevertheless, both notations coexist.
In this entry, the miRNAs are named in the text without "‘hsa"’ and preferentially employing the first notation explained (predominant and non-predominant, without and with *) because it is the most common one found in the literature. However, the second one is also used when required.
2. Fluorescence-Based Biosensors
Fluorescence sensors consist basically of using a light source at a certain wavelength (excitation wavelength) to excite a fluorophore or label and measuring the fluorescent response at another wavelength (peak wavelength) [7][8][93,94]. The difference in wavelength between the excitation (usually lower) and emission (usually higher) wavelengths is known as the Stokes shift [9][95].
In the case of biosensors, the sensing mechanism links the analyte concentration with the fluorophore concentration, where this relationship can be direct (the higher the concentration of the analyte, the higher the light intensity) or inverse (the higher the concentration, the lower the intensity). Fluorescence biosensors are characterized by a high sensitivity and specificity, but in order to measure the light emitted by the label precisely, the Stokes shift must be as large as possible [9][95]. Their drawbacks are those associated with the utilization of fluorophores, including undesired effects that affect the sensor performance such as photobleaching or self-quenching.
The peak wavelengths of these biosensors tend to be in the range 520–530 nm and different fluorophores are employed: 5(6)-carboxyfluorescein (FAM) [10][11][12][13][14][15][16][17][38,39,43,44,50,51,54,59], SYBR Green I [18][19][20][21] [45,48,52,58] or Cy5 [22][23] [46,56] among others. In [24][25][49,55], quantum dots (QDs), a kind of fluorescent semiconductor nanocrystals, are utilized as fluorescent labels instead of fluorophores. There are sensors in which several fluorophores [23] [56] or QDs [25] [49] are employed with different miRNAs in order to enable their independent detection, and in [26][57], both fluorophores are used in every miRNA.
However, in some cases, the mechanism of the sensor is more complex and involves the use of a certain fluorescence technique. This is the case of total internal reflection fluorescence microscopy (TIRFM), utilized in [27][42], where the hybridization of the DNA probes and the miRNA is monitored with an electron-multiplying charge-coupled device (EMCCD) coupled to the TIRFM system (see Figure 2).
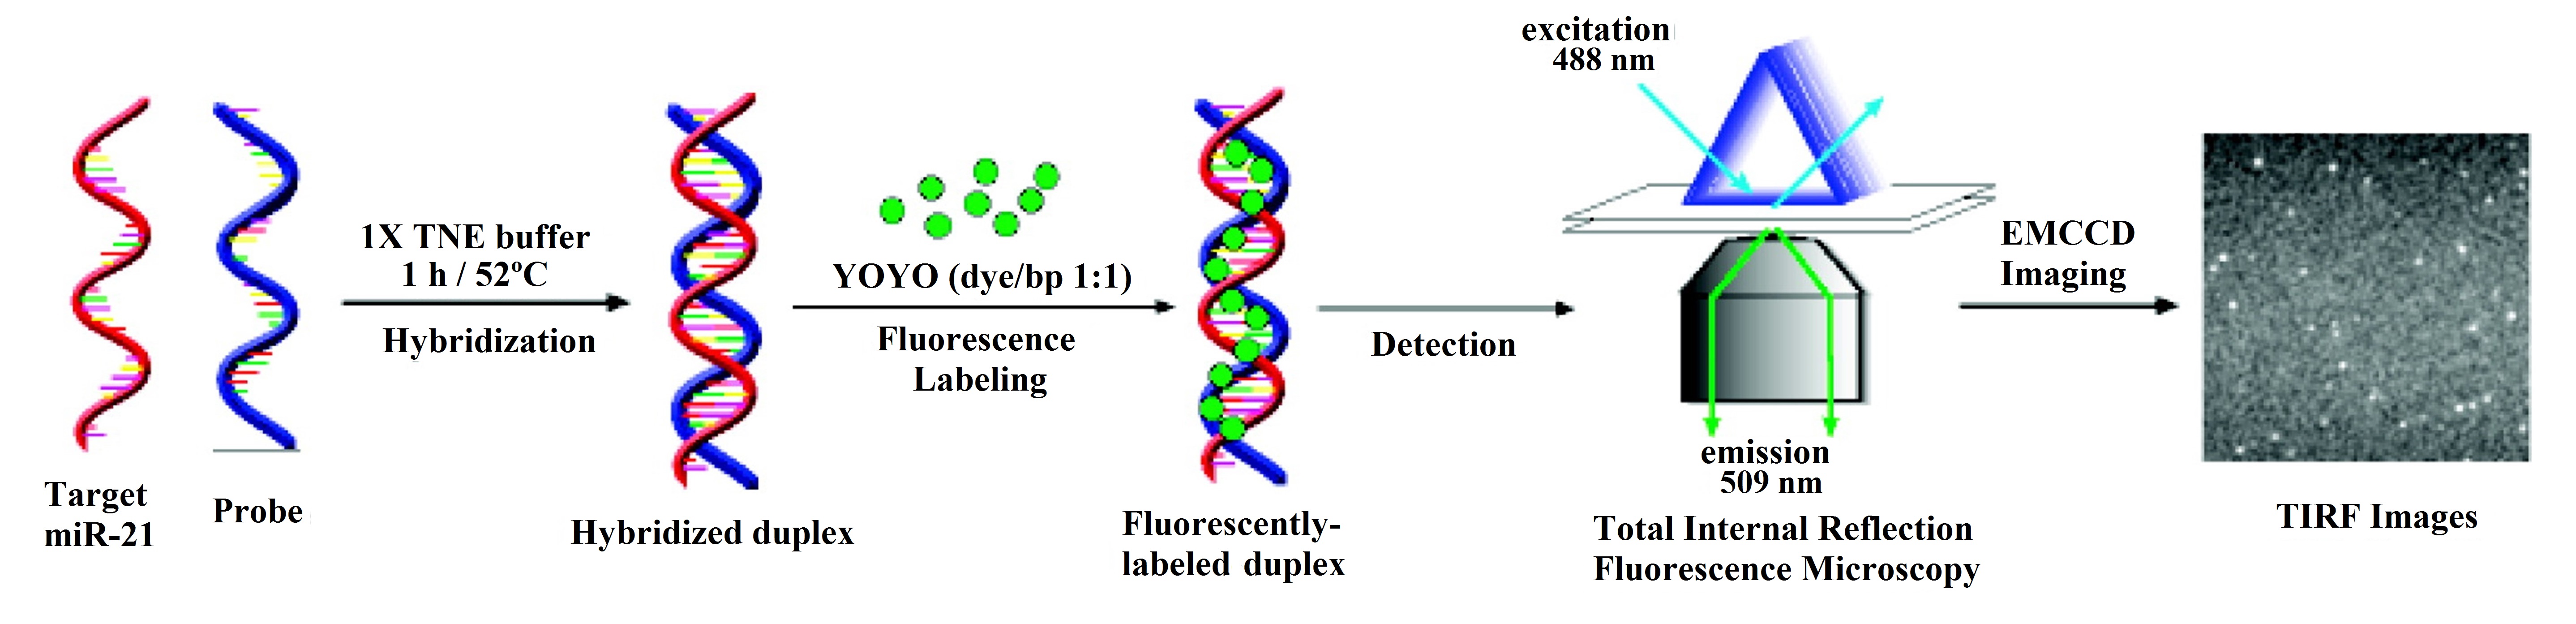
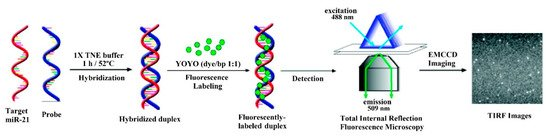
Figure 2. Schematic illustration of the hybridization-based total internal reflection fluorescence microscopy (TIRFM) assay for the detection of single miR-21 molecules in solution in which the fluorophore YOYO-1 is used. Reproduced with permission from [27][42]. Copyright 2010 American Chemical Society.
Another fluorescence-based technique is fluorescence anisotropy (FA) [28][41], phenomenon in which the light emitted by a fluorophore changes depending on the axis of polarization used for the measurement. In [22][46], the corresponding technique is called photonic crystal-enhanced fluorescence (PCEF), due to the use of a low index SiO2 grating on top of a silicon substrate and overcoated with a high index TiO2 layer.
Regarding the materials, graphene oxide (GO) is present in an important number of miRNA biosensors, either as GO in [11][12][13][15][17][18][19][20][23][24][28][29][39,41,43,44,45,48,51,52,53,55,56,59], or as reduced graphene oxide (rGO) in [21][30][40,58]. A particular case for GO is shown in [12][43], where it is used is in the shape of nanoplates.
Graphene is a common material in biosensors for miRNA detection, not only optical, but also electrochemical [31][101]. There are two main reasons for the utilization of GO in the case of fluorescent sensors for miRNA detection [31][101]. Firstly, GO is capable of quenching the light emitted by a fluorophore in close proximity to its surface. In the second place, GO has a high affinity towards single-stranded (ss) nucleic acids (DNA or RNA), but not towards double-stranded (ds) nucleic acids (for example, a DNA hybridized with the corresponding miRNA). The basic operation of a fluorescent sensor that employs GO, which is based in these 2 principles is shown in Figure 3.
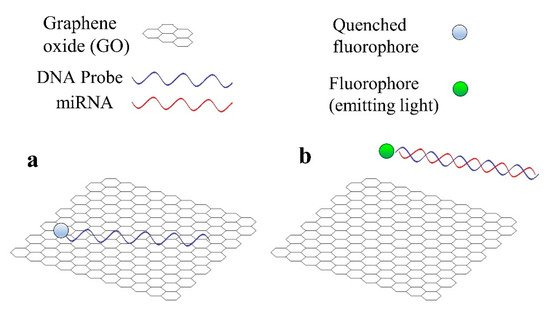
Figure 3. Basic operation principle of a fluorescent sensor for miRNA detection that employs graphene oxide (GO). (a) DNA probe is adsorbed by GO and the fluorophore is quenched. (b) miRNA hybridizes with DNA probe and both desorb from GO, the fluorophore emits light.
2.1. MiR-21
MiR-21 has been identified as a biomarker for bladder and prostate cancer [32][17], breast cancer [33][18], non-small cell lung cancer [34][19], pancreatic cancer [35] [20] or rheumatoid arthritis [36][23], which justifies the interest in developing sensors for the detection of this miRNA.
Apart from fluorescent labels, other elements are also employed as part of the sensing strategies for miR-21 detection. For instance, in [10][38], gold nanoparticles (Au NPs) are used to quench the light from the fluorophore in the absence of miR-21 and are also responsible for the colorimetric response due to their surface plasmons. On the other hand, magnetic particles and CdSe nanocrystals are utilized in a 3-step procedure in [37][47]. Magnetic silicon microspheres, similar to the magnetic particles in [37][47], are employed in [30][40].
Although graphene oxide is the most common used material in fluorescence based biosensors for miRNA detection, other materials are also utilized. A paper-based biosensing platform for detection of miR-21 by the naked eye is described in [38][37].
Another particular case is presented in [10][38], where not only fluorescence, but also colorimetry (ratio of the absorption at λ = 620 nm and λ = 520 nm, as a measurement of the change from red to blue) is employed. This dual mode sensor is based on FAM labelled hairpin probes combined with Au NPs and DSN-assisted signal amplification.
The LOD is in the order of pM for most of the miR-21 fluorescence sensors. However, in [19][37][47,48] the LOD is in the fM range. In [37][47], an amplification method based on cation exchange (named CXFluoAmp) combined with CdSe nanocrystals and Rhod-5N molecules allows a LOD of 35 fM to be achieved with a dynamic range of slightly more than 7 decades (100 fM–5 μM). In [19][48], isothermal exponential amplification is used with graphene oxide and SYBR Green I, and the LOD is 10 times lower (3 fM), with a linear range from 10 fM to 10 pM.
Nevertheless, the lowest LOD among the fluorescence sensors for miRNA detection is found in [25][49], with a value of only 200 aM for miR-21 (see Figure 4a). In this case, the biosensor consists of a QD-605 (emission peak at 605 nm) labelled strip that employs target-recycled non-enzymatic amplification. The dynamic range goes from 200 aM to 2 pM (see Figure 4a) and specificity is tested with no miRNA (control), miR-210-3p and miR-214 (see Figure 4b).
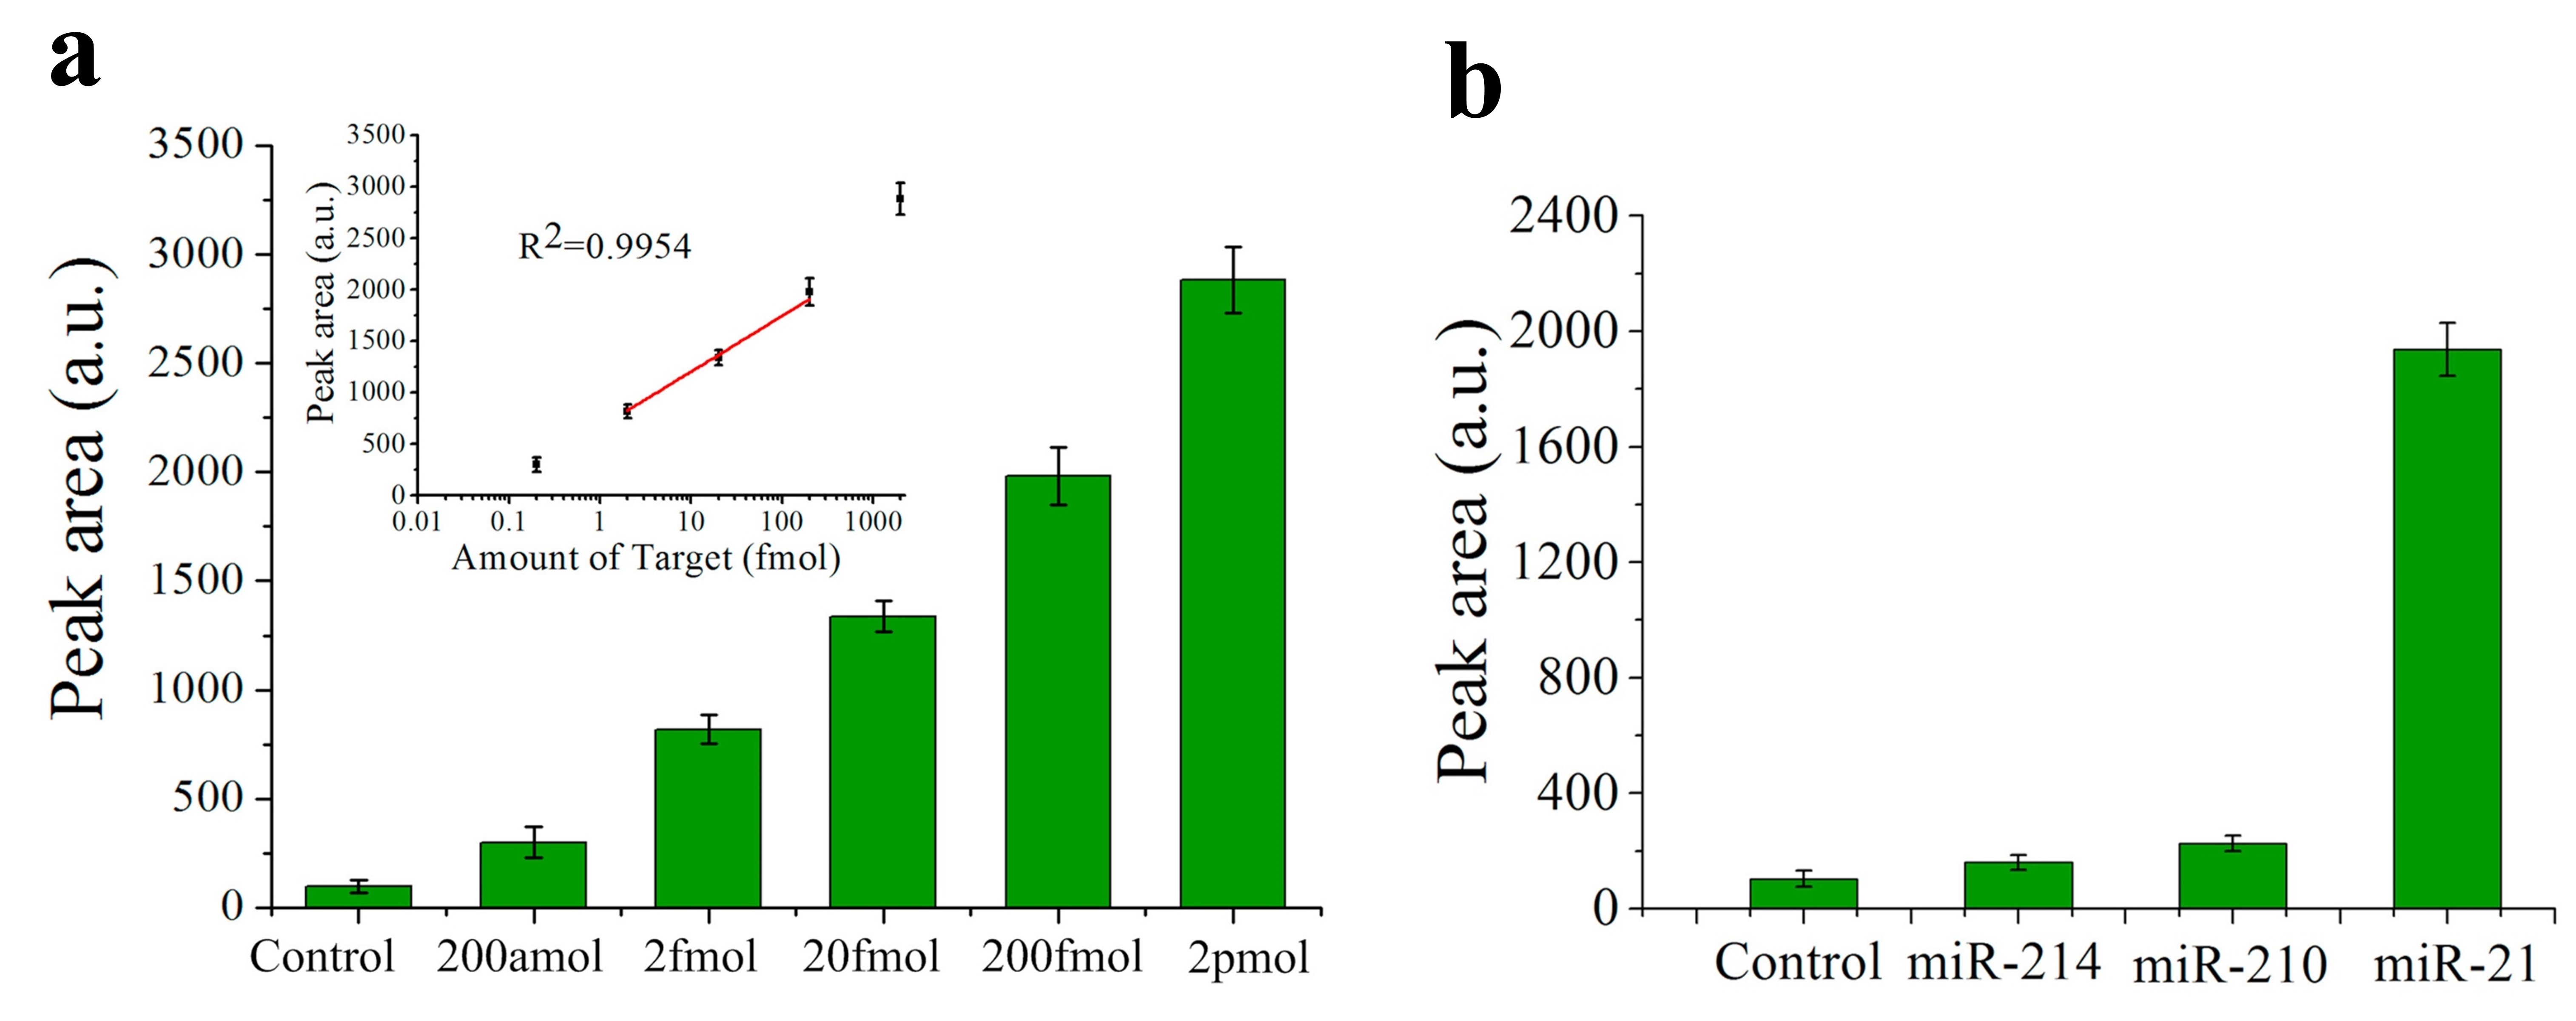

Figure 4. (a) Histograms of the peak areas on the test lines that correspond to a negative control and miR-21 in different concentrations. Inset shows the calibration plot of the peak area of the test line versus miR-21 concentration. (b) Histograms of the peak areas on the test lines in a specificity assay: negative control, miR-214, miR-210-3p (indicated as miR-210) and miR-21. (a,b). Reprinted [25][49], Copyright 2017, with permission from Elsevier.
2.2. Let-7a
Let-7a is part of the let-7 gene family, which includes several miRNAs that differentiate in only a few bases: let-7a, let-7b, let-7c-5p, let-7d, let-7e, let-7f, let-7g and let-7i. In this sense, an assay in which the corresponding sensor, which has been able to detect let-7a, does not produce a significant response in the presence of other miRNAs from the let-7 family is considered to demonstrate the specificity of the sensor. This is the reason why let-7a commonly appears in miRNA biosensing literature.
In [14][50], let-7a is detected using carbon nanoparticles and DNA probes labelled with FAM, achieving a LOD of 3.5 nM. In this case, discrimination between let-7a and other miRNAs from the let-7 family (let-7c-5p, let-7e, let-7f) is undertaken based on the melting temperature of the DNA probe-miRNA hybrids. The melting temperature (Tm) is the temperature at which only half of the hybrids remains hybridized. The higher the number and length of the sequences of bases that are complementary, the higher the Tm [39][104].
Graphene oxide and SYBR Green I are used for let-7a detection in [20][52]. Circular exponential amplification is utilized in this sensor to improve its performance. The LOD achieved is 10.8 fM with a linear range from 60 fM to 12 pM. The specificity is assessed with let-7b, let-7c-5p and miR-21 and for all of them the fluorescence is between 3 and 5 times lower than that for the same concentration of let-7a.
In [29][53], let-7a is detected with a platform that employs graphene oxide, helicase amplification of hybridization chain reaction (HCR) and DNA probes labelled with Cy3. The achieved LOD has a value of 4.2 fM and the linear range covers the 10 fM–2 pM region. The specificity has been studied with 5 miRNAs from the let-7 family: let-7b, let-7e, let-7f, let-7g and let-7i. In all the cases, the measured fluorescence is around 3.5 times lower than that obtained for the same concentration of let-7a.
2.3. Other miRNAs
Both miR-155, an important biomarker for different types of tumor, including breast cancer [40][105]; and miR-21 are detected in [24][55]. The biosensor proposed in [24][55] consists in a nano-photon switch that employs quantum dots (QDs) and GO, producing a fluorescence resonance energy transfer (FRET). Since QD-525 and QD-605 have been used for miR-155 and miR-21 respectively, both miRNAs can be individually detected.
Another sensor for miR-155 detection is found in [41][60], although in this case it is based on absorbance. In [41][60], DNA probes bind to negatively charged citrate-capped Au nanoparticles (C-Au NPs) in the first place, see Figure 5a. Then, the target miR-155 is electrostatically adsorbed onto the positively charged Au NPs polyethylenimine(PEI)-capped Au NPs (P-Au NPs), see Figure 5b. When both types of Au NP are mixed and the hybridization takes place, the solution color changes from red to pinkish/purple due to the coupling of the Au NPs'’ surface plasmons, as it can be observed in Figure 5c. With this sensing strategy, the LOD achieved is 100 aM, with a linear range over 3 decades (100 aM–100 fM).
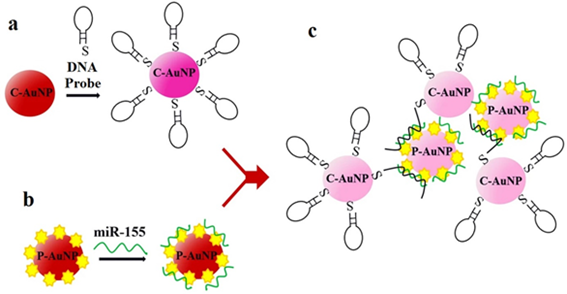
Figure 5. Sensor operation based on Au NPs for miR-155 detection. (a) Citrate-capped Au NPs (C-Au NPs) and DNA probes binding (b) PEI-capped Au NPs (Au NPs) and miR-155 binding. (c) MiR-155 detection based on the color change from red to pinkish/purple. (a–c) Reproduced under the terms of the Creative Commons Attribution 4.0 International License (https://creativecommons.org/licenses/by/4.0/) [41][60]. Copyright 2018, The Authors. Published by Scientific reports.
In [16][54], miR-141 is detected with a sensor that uses beta nickel hydroxide, β-Ni(OH)2, and DSN amplification. β-Ni(OH)2 has similar properties to those explained for graphene (quenching ability and different affinity for ssDNA and dsDNA) that enable the sensor operation. In this work [16][54], miR-141 and miR-21 are separately detected in the same assay thanks to the use of two fluorophores (FAM and TAMRA).
In [23][56], the sensing platform is a fluorometric system that uses graphene oxide and rolling circle amplification (RCA). This sensor is employed to detect miR-16, miR-31 and miR-155 in a concentration of 10 nM as well as study the cross-specificity with the 4 miRNAs, obtaining in all the assays appreciable hybridization only between the target miRNA and the corresponding DNA probe.
A platform with 5 lasers (green, blue, infrared and two red) for the quantitation of miRNAs is presented in [26][57]. In this sensor, two LNA (locked nucleic acid)-DNA probes labelled with fluorophores (Oyster 556 and Oyster 656) are used to capture each of the studied miRNAs. The characterization of the sensor is performed with miR-9 and the specificity is assessed with let-7a.The main interest of this work [26][57] relies on the tests performed to detect 45 miRNAs in 16 different tissues.
In [17][59], a method employing graphene oxide, DNA probes with FAM and site specific cleavage with RsaI endonuclease allows the detection of cDNA miR-126 (complementary sequence to miR-126). The achieved LOD is ~3 fM, with a linear range from 20 fM to 100 pM. MiR-125a is detected in [21][58] based on rGO-assisted rolling circle amplification (RCA) and the use of SYBR Green I. The LOD achieved for this miRNA is 10.3 fM, with a linear range of 4 decades (10 fM–100 pM).
3. Resonance-Based Biosensors
Resonance-based biosensors rely on light modifications by means of the utilization of different materials covering the waveguide. These optical sensors work as refractometers [42][111], that is, they are able to detect small changes in the refractive index at the sensor surface, which are correlated with the analyte-binding interaction in the case of biosensors. In particular, optical fiber sensors based on resonances are considered one of the prominent technologies for biosensing applications [9][43][95,112].
Depending of the dielectric properties of the waveguide and the covering, different resonances take place. Surface plasmon resonance (SPR) occurs when the real part of the permittivity of the material used as a covering is negative and higher in magnitude than its own imaginary part and the real part of the permittivity of the waveguide [44][113]. SPR imaging, also known as SPRi, simply differentiates from conventional SPR in incorporating a CCD (charge-coupled device) camera that allows sensorgrams and SPR images to be recorded at the same time [45][114]. SPR stands out for having high sensitivity, good cost-performance ratio and enabling direct and real-time monitoring of the analyte binding [46][47][115,116].
In the presence of the analyte of interest, the refractive index in the region close to the biosensor surface changes, thus modifying the characteristics of the light coupled to the surface plasmons, such as the resonant wavelength, the intensity or the phase. By monitoring one of these variables, the concentration of the analyte can be obtained [48][117].
In [49][61], a SPR sensor with an Au and reduced graphene oxide (rGO) film and employing duplex specific nuclease (DSN) for signal amplification has been used for detecting miR-21 and let-7b. This device achieves a LOD of 3 fM and a dynamic range of 4 decades (10 fM–100 pM) for miR-21. This biosensor [49] [61] was employed to assess miR-21 levels in 104 clinical serum samples (diluted in buffer) from patients with different types of cancer (liver cancer, colorectal cancer, gastric cancer, lung cancer and breast cancer) as well as 20 samples from healthy individuals.
SPRi sensor based on Au islands and orthogonal signal amplification for the detection of miR-15a is presented in [50][62]. This device exhibits a LOD of 0.56 fM and a dynamic range of 5 fM–0.5 nM. This biosensor showed a recovery between 98.6% and 104.9% for four concentrations in the range 7.5 fM–7.5 nM of miR-15a spiked into 10% diluted commercial normal human sera. Furthermore, it was also tested with 40% diluted colorectal cancer patients and healthy serum with miR-21 concentrations in the fM range.
In [51][63], both miR-21 and miR-155 are detected (in separate assays) with a LOD of 10 aM and detection over a range of 6 decades (10 aM–10 pM), see Figure 6a for miR-155 (the same results are also achieved for miR-21). This label-free SPR sensor uses DNA probes with gold nanorods (Au NRs, whose importance can be appreciated in Figure 6b) and antimonene, a material similar to graphene but with better stability and hydrophilicity.
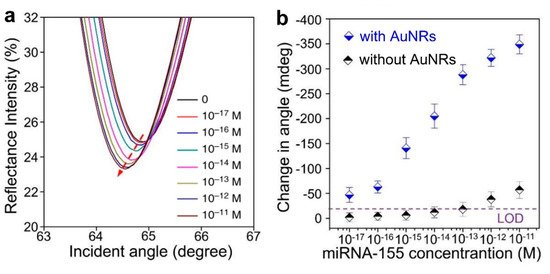
Figure 6. (a) Surface plasmon resonance (SPR) spectra with miR-155 concentrations ranging from 10−17 to 10−11 M obtained using gold nanorod (Au NR) amplification. The arrow denotes the shift in the SPR angle. (b) Relationship between the SPR angle and miR-155 concentration using DNA probes with and without Au NRs. (a,b) Adapted under the terms of the Creative Commons Attribution 4.0 International License (https://creativecommons.org/licenses/by/4.0/) [51][63]. Copyright 2019, The Authors. Published by Nature Communications.
Localized surface plasmon resonance (LSPR) is generally considered a particular type of SPR. The main difference is that in the case of LSPR the plasmons oscillate locally to the nanostructure instead of along the metal–dielectric interface [52][119]. In the case of LSPRs, the electromagnetic field intensity falls in a much shorter distance compared to SPRs, causing an enhancement of the electrical field around the nanostructure, making LSPR highly sensitive to small molecules [53][120].
In [54][64], a label-free sensor based on LSPR with gold nanoprisms permits the detection of miR-21 with a LOD between 23 and 35 fM depending of the considered media. The dynamic range of this biosensor in 40% diluted human serum covers from 10 pM to 100 nM. This device was tested with plasma from 6 pancreatic cancer patients (for which miR-21 is also a biomarker [35][20]) and 6 healthy controls, with and without performing RNA extraction techniques, working with concentrations in the range of 100 ng/L.
Another type of resonance is the lossy mode resonance (LMR) sensor. LMR occurs when the real part of the permittivity of the material employed as covering of the waveguide is positive and higher in absolute value than its own imaginary part and the real part of the permittivity of the waveguide [44][113]. LMRs are not a technology as mature as SPRs [9][95], but their high sensitivity compared to SPRs [55][56] [122,123] has already led to the development of biosensors that enable miRNA detection such as hsa-miR-34b-5p [57] [124] and hsa-miR-223-3p [58][125], although further research is required.
Regarding silicon photonic microring resonators, a ring resonator is an optical waveguide which is looped back on itself, such that a resonance occurs when the optical path length of the resonator is exactly a whole number of wavelengths [59][60][126,127]. The employment of silicon, due to the high refractive index contrast between this material and its oxide (or air), enables the development of compact microring resonators [61][128]. This feature is interesting in biosensing applications, as it allows having several rings on a single chip for multiplexing purposes. This fact is especially interesting considering that it has been stated that a biosensor must detect several biomarkers in order to accurately diagnose a disease.
This strategy is employed in [62][65], where 4 miRNAs (let-7c-5p, miR-21, miR-24, miR-133b) are detected; in [63][66], with 7 miRNAs (miR-21, miR-26a, miR-29a, miR-106a, miR-219, miR-222, miR-335); and in [64][67], where 4 miRNAs (miR-16, miR-21, miR-24, miR-26a) are detected. Amplification techniques are also used: enzymatic signal amplification in [66] [63] and amplification using an anti DNA:RNA antibodies in [64] [67] (Figure 7a).
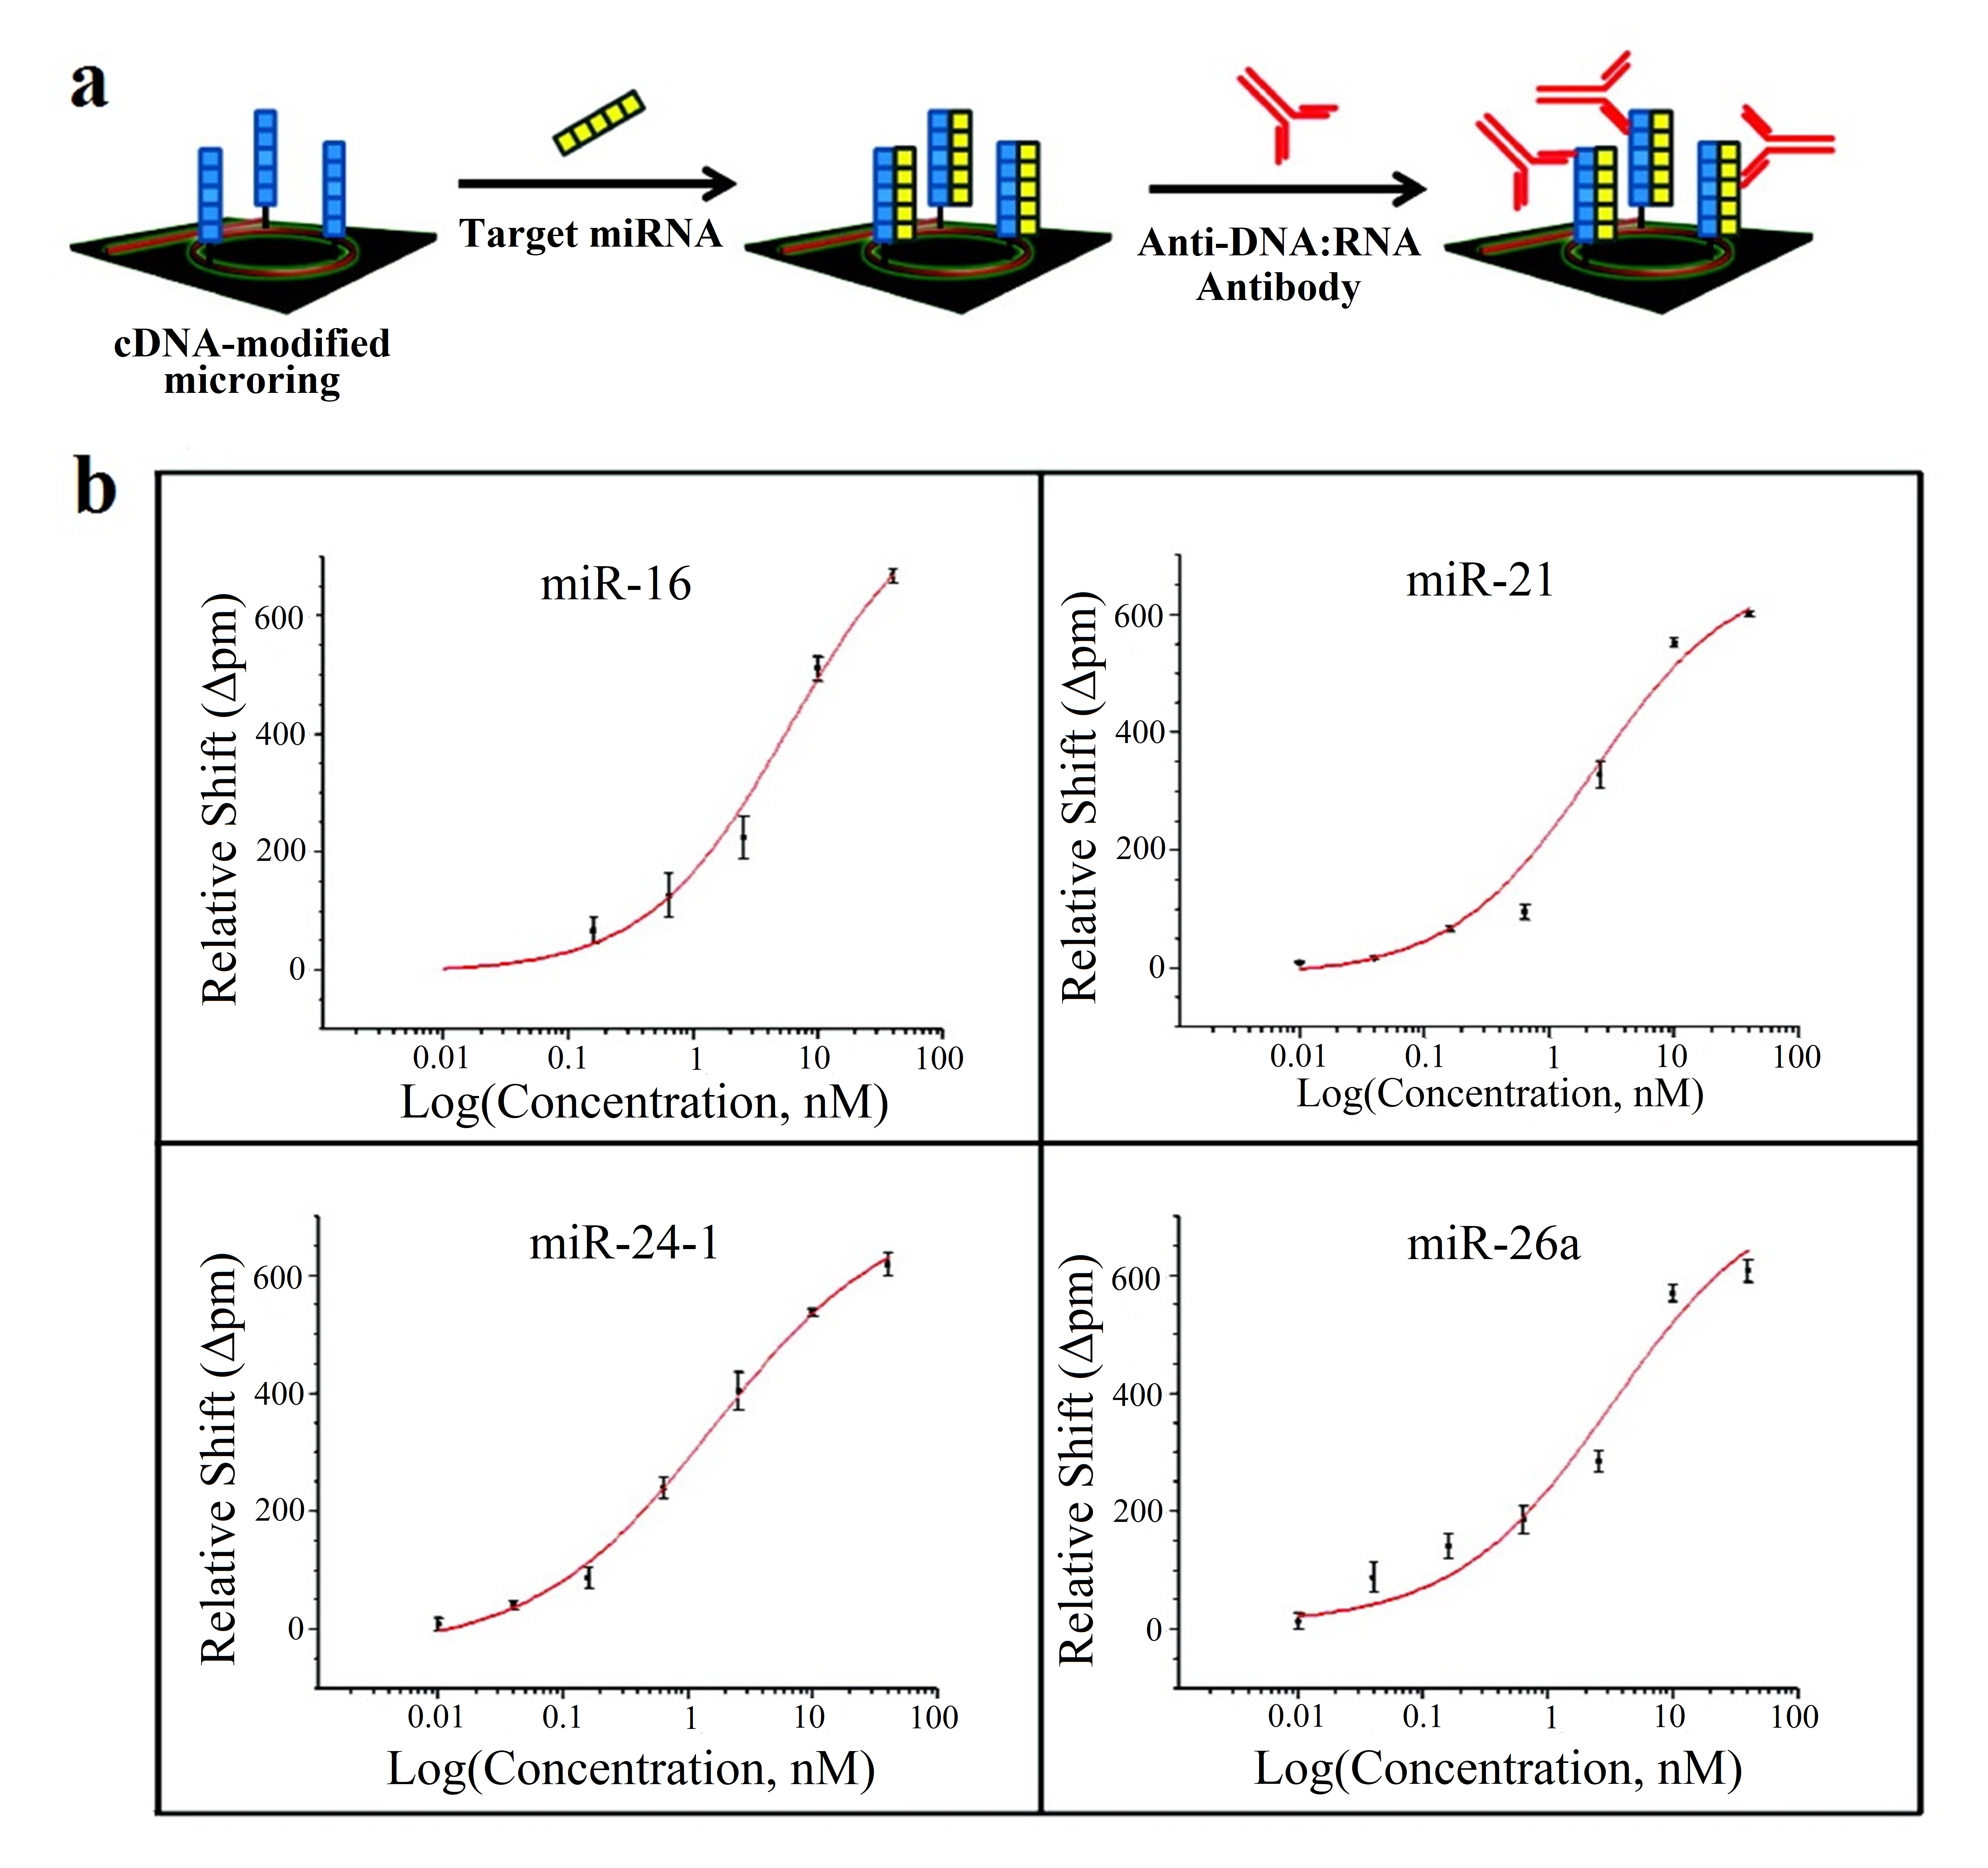
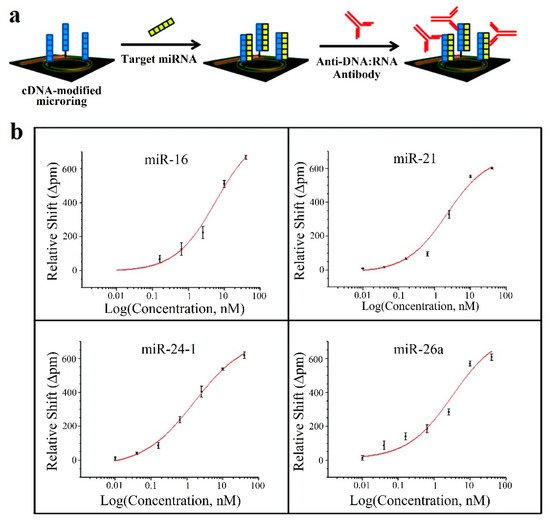
Figure 7. (a) Microring resonators with amplification strategy based on using anti DNA:RNA antibodies. (b) Calibration curves for miR-16, miR-21, miR-24 (designed as miR-24-1) and miR-26a. Plots were constructed from the relative shifts at 40 min. (a,b) Adapted with permission [64][67]. Copyright 2011 American Chemical Society.
In all the cases [62][63][64][65,66,67], cross-specificity among the miRNAs of the corresponding work is studied, showing that only the rings that have been functionalized with the corresponding complementary probe exhibit a response. On the other hand, among these articles, the lowest concentrations are detected in [64][67], with a value of 10 pM for all miRNAs except for miR-16 (160 pM). The calibration curves of this sensor can be observed in Figure7b.
4. Other Optical Sensing Techniques: Interferometry and Surface-Enhanced Raman Spectroscopy (SERS)
Apart from fluorescence-based and resonance-based sensors, interferometry-based sensors have been also presented in literature for miRNA detection.
Waveguide interferometric sensors are based on the light travelling through 2 different paths. In one of the paths, the sample is placed, changing the refractive index and affecting the evanescent field of the guided mode, thereby inducing a phase shift. The other path is known as the reference arm, where the light propagates without suffering any alteration. The interference of the modes that travel through both paths produces a signal that can be measured at the sensor output, which is related to the analyte concentration in the case of biosensing applications [65][129].
Their main advantages include their high sensitivity, broad dynamic range and long interaction length, whereas their high sensitivity to wavelength instability, mechanical vibrations and temperature changes are their main inconveniences, therefore requiring coherent and stabilized light sources as well as an isolated environment for being functional [65][129].
In [66] [68] is described a Mach–Zehnder interferometer which enables the rapid (only 15 min) and label-free detection of miR-21 and let-7a. A different case is demonstrated in [67] [69] for the detection of let-7a by means of the utilization of an optofluidic sensor manufactured by aligning a microfiber in lateral contact with a capillary to form a modal interferometer. In this case the LOD achieved is 212 pM with a linear range from 2 nM to 20 μM [67][69].
SERS is a surface spectroscopy technique that consists in combining Raman spectroscopy, which is based in measuring the scattering of light after interacting with the chemical bonds of molecules, and signal enhancement that is provided by the plasmon resonances in the metal substrate [53][68][97,120]. The peaks in a Raman spectrum are between 10 and 100 times narrower than the emission peaks in fluorescence sensors, making Raman spectroscopy ideal for multiplexing, and therefore able to detect several different biomarkers at the same time [69][130].
In [70], Ag nanorod array substrates prepared by oblique angle vapor deposition are employed as SERS platform. Here, a partial least square (PLS) regression model is built using SERS for identifying the concentration of different miRNAs (ranges from 6 μM to 150 μM for each) in mixtures that contain several of them: let-7a, miR-16, miR-133a-3p.
Gold and silver (Au–Ag) nanoprobes, named nanomushrooms in this case, are employed as SERS probes in [71]. In this work, fragments of DNA of several viruses (hepatitis A, hepatitis B and human immunodeficiency viruses) are detected. Regarding miRNAs, miR-21 detection is studied, with a dynamic range from 10 fM to 100 pM and a LOD lower than 10 fM. Then, the simultaneous detection of 3 miRNAs is assessed, with their concentrations ranging from 1 pM to 10 nM. These results have been achieved thanks to the use of a different dye (ROX, 4-aminothiophenol, Cy3) with each miRNA.
Finally, in [72], SERS is combined with duplex-specific nuclease (DSN) amplification technique, for the detection of miR-155. The sensor in this work is based on the design of DNA microcapsules that contain toluidine blue (TB), a Raman dye. The presence of miR-155 induces the destruction of the microcapsules, releasing the TB and enabling the detection, which is improved thanks to the DSN amplification (Figure 8a). This biosensor achieves a LOD of 0.67 fM, with a linear dynamic range of 7 decades (1 fM to 10 nM) (Figure 8b).
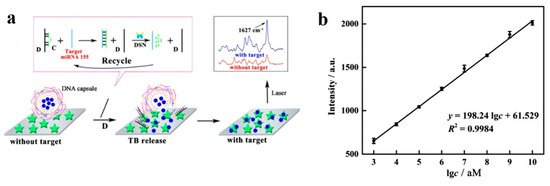
Figure 8. (a) SERS sensing of miR-155 using DNA microcapsules and DSN amplification. (b) Linear curve of Raman intensity (1627 cm−1) for concentrations of miR-155 from 1 fM to 10 nM. (a,b) Adapted with permission [72]. Copyright 2018 American Chemical Society.
5. Conclusions and Outlook
The number of developed optical sensors confirms the increasing relevance of miRNAs as biomarkers for the evaluation of the medical state of the patient, adding objectivity to the monitoring and diagnosis of diseases.
However, there are still several challenges that need to be addressed. In the first place, a disease diagnosis cannot rely on a single biomarker. For almost every biomarker, whatever the agreement of its relevance among the scientific community, a work can be found where its importance is put into question due to the obtained experimental results.
Therefore, several biomarkers need to be employed at the same time to provide a precise evaluation. Some efforts have already been made in this direction, especially in the medical field, identifying sets of biomarkers. Nevertheless, there is still work to do, developing more sensing platforms that enable several biomarkers to be detected simultaneously, as it has been shown in some works mentioned in this entry. On the other hand, not every biosensor for miRNA detection has been tested with clinical samples, an important step that should be done in order to effectively demonstrate their utility.
Finally, it is important to remark that optical biosensors based on different technologies have proven capable of detecting miRNAs with decreasingly low LODs, dynamic ranges of several decades, and high specificity, as it has been described in this entry. As a result, they are becoming a key technology that enables a reliable, highly sensitive, reusable, and fully automated solution to be provided for the diagnosis of diseases through the simultaneous detection of multiple relevant biomarkers.