Your browser does not fully support modern features. Please upgrade for a smoother experience.
Please note this is a comparison between Version 2 by Ling Tim Wong and Version 1 by Ling Tim Wong.
Despite an increased awareness about energy conservation in the past decade, the energy consumed for water heating has increased by 7% from 2008 (17%) to 2018 (24%) in Hong Kong.
- energy consumption
- thermal comfort
- showering
- human behavior
- water temperature
1. Introduction
Since the international environmental treaty was established to combat climate change, almost all fields, including agriculture, industry, transportation, and building, have been looking for effective ways to save energy and reduce emissions [1][2]. Water utilities are no exception since water and energy always work together. Studies showed that the proportion of energy used for domestic water heating among the total energy consumption was 18% in the United States [3], 15% in Poland [4], 13–18% in Australia [5], and 20% in Hong Kong [6]. Moreover, these proportions have continuously increased in recent years because of decreased energy consumption in other fields, such as space heating and lighting [7].
According to the investigation of energy consumed in the United States, approximately 4.8 × 10¹⁶ kJ of energy was consumed for water-related purposes. Most of them were lost at the point of transmission, distribution, and end-use [8]. Furthermore, Spang et al. [9] estimated that 1830 GWh of electricity could be saved by water conservation in California in one year. One of the daily actions that are responsible for both energy and water consumption is showering. In Hong Kong, hot water showers consume around 40% and 19% of the total domestic water and energy consumption, respectively [10]. According to a field survey conducted in 1300 households in Hong Kong [11], the shower frequency was around 1.4 times (SD = 0.6) per day, which is more than three times as many as in other cities in England (0.4 times) [12]. Moreover, as indicated in an energy consumption survey conducted by Wan and Yik [13] in Hong Kong, the annual electricity consumption for water heaters accounted for almost half of the total electricity consumption per household and was more tensive in winter. This demonstrates considerable energy-saving potential during shower time in Hong Kong, especially in winter.
Although significant energy saving could be achieved through the optimal operation of the hot water system during showering, it might decrease occupants’ comfort [14]. Energy-saving and maintaining comfort appear to conflict with each other. As stated by Pomianowski et al. [7], people tend to increase the number and duration of showers to obtain comfort, and the water must be delivered at the required temperature. Thus, efforts still need to be made to reach the balance between energy efficiency and comfort indicators during showering.
2. Impact of Air Temperature and Water Temperature on Energy Consumption
A previous study found that air and water temperatures are the main variables influencing the occupants’ thermal comfort during showering [15], consistent with the results shown in Table 1. The Pearson coefficients for air temperature (r = 0.76) and water temperature (r = 0.87) were >0.5, demonstrating their strong and positive effects on occupants’ TSV. Figure 1 shows the average values of energy consumption and TSVs under the same air temperatures and the trends in energy consumption and TSV with the changes in air temperature during showering. It demonstrates that when the air temperature was between 24–40 °C, it positively correlated with the total energy consumption and an occupant’s thermal sensation. AccBording to Table 1, botth correlations were strong (r > 0.5). It should be noted that although the air temperature setting was 20–40 °C, no cases with air temperature lower than 24 °C existed since the radiator and hot water continuously heated the bathroom air during showering. As shown in Figure 1, the thermal neutral air temperature (TSV = 0) during showering was 32.8 °C and the thermal neutral zone (−0.5 < TSV < 0.5) was 30.8–34.9 °C (the shadow area in Figure 1). The corresponding energy consumption range was 7.9–9.8 kW to maintain a comfortable air temperature.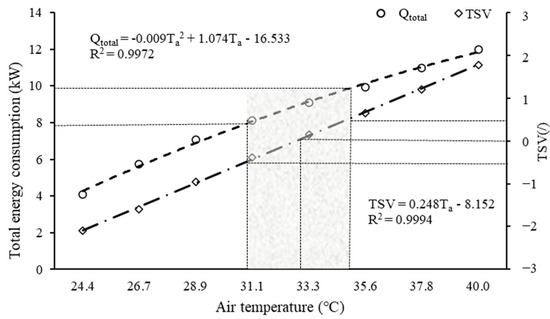
Figure 31. Impact of air temperature on the total energy consumption and occupant’s thermal sensation. Note: ventilation rate was 0.01–0.03 kg·s−1; water flow rate was 0.08–0.27 kg·s−1; water temperature was 32–40 °C.
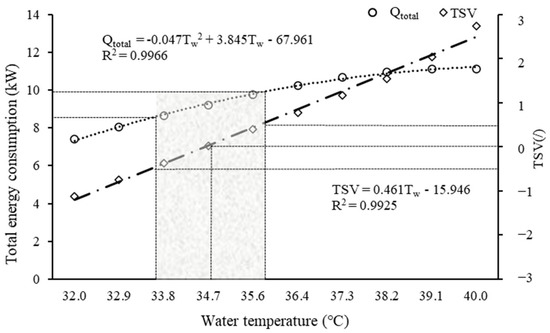
Figure 42. Impact of water temperature on the total energy consumption and occupant’s thermal sensation. Note: ventilation rate was 0.01–0.03 kg·s−1; water flow rate was 0.08–0.27 kg·s−1; air temperature was 20–40°C.
3. Impact of Ventilation Rate and Water Flow Rate on Energy Consumption
Unlike the impacts of air and water temperatures, the effects of ventilation and water flow rate on occupants’ TSV were relatively weak, with the Pearson correlation coefficients much less than 0.3 (see Table 1). Furthermore, as shown in Figure 3 and Figure 4, no matter which values the ventilation rates or water flow rates were, the average TSV of these cases was always slightly warm (from 0 to 1) and hardly any changes were identified. Therefore, the current study considers ventilation and water flow rates in the practical ranges insignificant to an occupants’ thermal sensations.
Figure 3. Impact of ventilation rate on the total energy consumption and occupants’ thermal sensation. Note: water flow rate was 0.08–0.27 kg·s−1; water temperature was 32–40 °C; air temperature was 20–40°C.
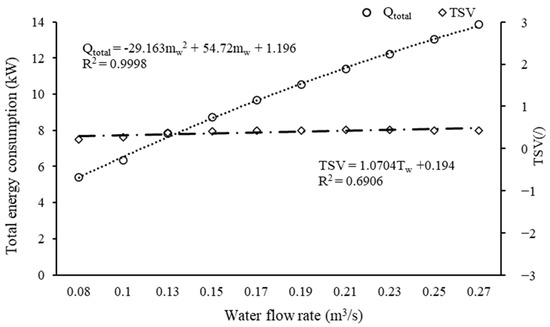
Figure 4. Impact of water flow rate on the total energy consumption and occupants’ thermal sensation. Note: ventilation rate was 0.01–0.03 kg·s−1; water temperature was 32–40 °C; air temperature was 20–40 °C.
4. Integrated Impact of Air Temperature, Water Temperature, Water Flow Rate, and Ventilation Rate on Energy Consumption
Considering the interaction between the air temperature, water temperature, water flow rate, and ventilation rate, a multiple regression model was established between these variables and the total energy consumption to understand their integrated impact better. Detailed information about this model is shown in Table 21. All the variables significantly impacted the energy consumption and no multicollinearity was identified between them (VIF < 4). In addition, the R2 of this model is 0.987, which means this regression model can explain 99% of the variability observed in the total energy consumption:Table 21. Multivariate regression model of energy consumption.
| Variables | β Coefficient | Standardized Coefficients Beta | 95.0% Confidence Interval for β | p Value a | VIF b |
|---|---|---|---|---|---|
| Air temperature (°C) | 0.193 | 0.237 | 0.188–0.197 | <0.001 | 1.441 |
| Water temperature (°C) | 0.512 | 0.388 | 0.505–0.519 | <0.001 | 1.279 |
| Ventilation rate (kg·s−1) | 62.081 | 0.122 | 59.569–64.593 | <0.001 | 1.147 |
| Water flow rate (kg·s−1) | 43.372 | 0.807 | 43.103–43.641 | <0.001 | 1.183 |
Note: a. p value less than 0.05 means the observed impact is statistically significant; b. variance inflation factor (VIF) represents how well other independent variables explain the variable.
Since units and ranges differ a lot between the air temperature, water temperature, water flow rate, and ventilation rate, the β coefficients identified in the multivariate regression model cannot be used to compare the influence of these variables. To find out the most important/influential variable in energy consumption during showering, the focus was given to the standardized coefficients of these variables obtained by establishing another regression model on the standardized form of the variables. As shown in Table 21, among the four variables, the water flow rate has the highest standardized coefficient, followed by water temperature and air temperature, and the ventilation rate has the lowest standardized coefficient. This indicates that water temperature had the most significant impact on total energy consumption. It was about twice as important as the air temperature, three times as important as the air temperature, and six times as important as the ventilation rate in predicting total energy consumption during showering.
5. Relationship between the Total Energy Consumption and Occupant’s Thermal Sensation during Showering
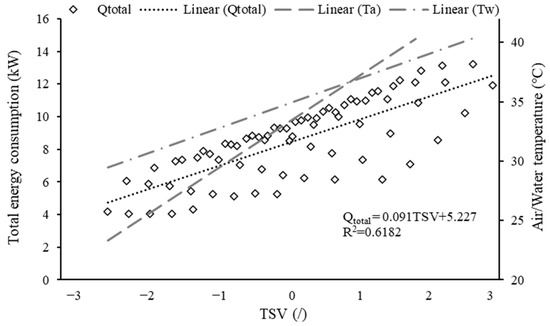
According to the Pearson correlation coefficient between the total energy consumption and an occupant’s TSV, they had a statistically significant relationship (p < 0.001). Figure 5 illustrates the correlation between the total energy consumption and the occupant’s thermal sensation during showering. As can be seen, the total energy consumption increased with the increase in occupants’ TSV. For the cases where the occupant felt neither hot (TSV > 0.5) nor cold (TSV < −0.5), the average total energy consumption rate was 5.13–5.32 kW, corresponding to an energy consumption of 0.86–0.89 kWh for a ten-minute thermally acceptable shower. Figure 5 shows the TSV and the water/air temperature relationships. It can be seen that the ranges of the water temperature and air temperature were 33.5–35.7 °C and 30.8–34.9 °C, respectively, for the thermal neutral zone, which was the same as the results reported in the above sections.Figure 5. Relationship between the total energy consumption and occupant’s thermal sensation during showering.
References
- United Nations Environment Programme. Emissions Gap Report 2020; United Nations: Nairobi, Kenya, 2020.
- The United Nations Environment Programme. The Six-Sector Solution to the Climate Crisis. The United Nations. 2020. Available online: https://www.unep.org/interactive/six-sector-solution-climate-change/ (accessed on 17 April 2023).
- Liu, X.; Lau, S.-K.; Li, H. Optimization and analysis of a multi-functional heat pump system with air source and gray water source in heating mode. Energy Build. 2014, 69, 1–13.
- Kordana, S.; Słyś, D.; Dziopak, J. Rationalization of water and energy consumption in shower systems of single-family dwelling houses. J. Clean. Prod. 2014, 82, 58–69.
- Kenway, S.J.; Scheidegger, R.; Bader, H.-P. Dynamic simulation of showers to understand water-related energy in households. Energy Build. 2019, 192, 45–62.
- Wong, L.; Mui, K.; Guan, Y. Shower water heat recovery in high-rise residential buildings of Hong Kong. Appl. Energy 2010, 87, 703–709.
- Pomianowski, M.; Johra, H.; Marszal-Pomianowska, A.; Zhang, C. Sustainable and energy-efficient domestic hot water systems: A review. Renew. Sustain. Energy Rev. 2020, 128, 109900.
- Sanders, K.T.; Webber, M.E. Evaluating the energy consumed for water use in the United States. Environ. Res. Lett. 2012, 7, 034034.
- Sprang, E.E.; Holguin, A.A.; Loge, F.J. The estimated impact of California’s urban water conservation mandate on electricity consumption and greenhouse gas emissions. Environ. Res. Lett. 2018, 13, 014016.
- Wong, L.-T.; Mui, K.-W.; Zhou, Y. Carbon Dioxide Reduction Targets of Hot Water Showers for People in Hong Kong. Water 2017, 9, 576.
- Wong, L.T.; Mui, K.W. Drainage demands of domestic washrooms in Hong Kong. Build. Serv. Eng. Res. Technol. 2009, 30, 121–133.
- Hall, M.J.; Hooper, B.D.; Postle, S.M. Domestic per Capita Water Consumption in South West England. Water Environ. J. 1988, 2, 626–631.
- Wan, K.; Yik, F. Building design and energy end-use characteristics of high-rise residential buildings in Hong Kong. Appl. Energy 2004, 78, 19–36.
- Zhu, M.; Pan, Y.; Wu, Z.; Xie, J.; Huang, Z.; Kosonen, R. An occupant-centric air-conditioning system for occupant thermal preference recognition control in personal micro-environment. Build. Environ. 2021, 196, 107749.
- Wong, L.-T.; Mui, K.-W.; Chan, Y.-W. Showering Thermal Sensation in Residential Bathrooms. Water 2022, 14, 2940.
More