DeRepfakes are becoming increasingly ubiquitous, particularly in facial manipulation. Numerous researcsearchers and companies have released multiple datasets of face deepfakes labeled to indicate different methods of forgery. However, nNaming these labels is often arbitrary and inconsistent, leading to the fact that most researchers now choose to use only one of the datasets for research work. However, researchers must use thesmultiple datasets in practical applications andto conduct traceability research. In this study, we employ some models to extract forgery features from various deepfake datasets and utWe utilize the K-means clustering method to identify datasets with similar feature values. We and analyze the feature values using the Calinski Harabasz Index method. Our findings reveal that datasets with the same or similar labels in different deepfake datasets exhibit different forgery features. We proposed the KCE system to solve this problem, which combines multiple deepfake datasets according to feature similarity. We analyzed four groups of test datasets and found that In the model trained based on KCE combined data faced unknown data types, and , the Calinski Harabasz scored 42.3% higher than the combined by forged names. Furthermore, it is 2.5% higher than the model using all data, although the latter has more training datadata by the same forgery name. It shows that this method improves the generalization ability of the model. This paper introduces a fresh perspective for effectively evaluating and utilizing diverse deepfake datasets and conducting deepfake traceability research.
- deepfake
- datasets
- correlation
- traceability
- clustering
- Calinski Harabasz
1. Introduction

Measuring the relevance of each deepfake dataset is crucial. To address this problem, We establish the KCE-System. It uses the Xception model [5] as a forgery feature extractor that maps various deepfake images into the feature space. Then, we use PCA for dimensionality reduction and the K-means method for clustering. We use these clustered datasets to retrain the Xception model and use the Calinski Harabasz Index
to judge the models' performance. To improve the credibility of the experimental results, we repeat part of the experiments on The Frequency in the Face Forgery Network (F3-Net)
and Residual Neural Network (ResNet)
. We also combine these deepfake datasets based on forgery method labels as a control group.
| Dataset | Real | Fake | Forgery Method |
|---|---|---|---|
| CelebDFv1 | |||
| DeepFake Variational Auto-Encoder (DF-VAE) | |||
| [ | 24 | 13 | ] |
| FakeAVCeleb [163] | 178 | 11,833 | Faceswap [2514], Faceswap GAN (FSGAN) [2615], Wav2Lip [2716] |
| DeepFakeMnist+ [152] | 10,000 | 10,000 | First Order Motion Model for Image Animation (FOMM) [2817] |
| DeepfakeTIMIT [111] | 320 | 640 | faceswap-GAN [2918] |
| FaceForensics++ [219] | 1000 |
- We point out that the forgery category labels in the deepfake dataset lack objectivity. Our experiments prove that some forgery category labels of the same name differ significantly across different datasets.
- We establish the KCE-System. It is a deepfake dataset similarity evaluation index system that provides a measure of the similarity between different datasets and lays the foundation for subsequent researchers to use these datasets comprehensively.
- Our experiments confirm that when the forgery method of the deepfake dataset is unknown, the model can achieve better generalization performance by training on datasets that are merged based on closer feature distances.
Our experiments prove that some forgery category labels of the same name differ significantly across different datasets. When the forgery method of the deepfake dataset is unknown, the KCE-System can achieve better generalization performance by training on merged datasets based on closer feature distances.
2. RDeepfakelated Work Datasets
2.1 Deepfake Datasets
| [ | |||
| 2210] | 409 | 795 | FaceswapPro |
| CelebDFv2 [2210] | 590 | 5639 | FaceswapPro |
| DeeperForensics1.0 [174] | 50,000 | 10,000 | |
| 5000 | |||
| Faceswap | |||
| [ | 30 | 19 | ], Deepfakes [3120], Face2Face [3221], FaceShifter [3322], NeuralTextures [3423] |
| DeepFakeDetection [3524] | 363 | 3068 | Faceswap |
| ForgeryNet [141] | 99,630 | 121,617 | ATVG-Net [3625], BlendFace, DeepFakes, DeepFakes-StarGAN-Stack, DiscoFaceGAN [3726], FaceShifter [3322], FOMM [2817], FS-GAN [2615], MaskGAN [3827], MMReplacement, SC-FEGAN [3928], StarGAN-BlendFace-Stack, StarGAN2 [4029], StyleGAN2 [4130], Talking Head Video [4231] |
| Patch-wise Face Image Forensics [2312] | * 25,000 | * 25,000 | PROGAN [4332], StyleGAN2 [4130] |
2.2 Deepfake Identification and Traceability
3. Troubles with Current Deepfake Traceability
2.2.1 Methods Based on Spectral Features
Methods Based on Spectral Features
[447] proposed a forgery detection algorithm that combines spatial and frequency domain features using an attention mechanism. The method uses a convolutional neural network and an attention mechanism to extract spatial domain features. After the Fourier transform, the frequency domain features are extracted, and finally, these features are fused for classification. Qian et al. [933] proposed a network structure called F3-Net (Frequency in Face Forgery Network) and designed a two-stream collaborative learning framework to learn the frequency domain adaptive image decomposition branch and image detail frequency statistics branch. The method has a significant lead over other methods on low-quality video. Liu et al. [4534] proposed a method based on Spatial Phase Shallow Learning (SPSL). The method combines spatial images and phase spectra to capture upsampled features of facial forgery. For forgery detection tasks, local texture information is more critical than high-level semantic information. By making the network shallower, the network is more focused on local regions. Li et al. [4635] proposed a learning framework based on frequency-aware discriminative features. They designed a single-center loss function (SCL), which only compresses the intra-class variation of real faces while enhancing the inter-class variation in the embedding space. In this way, the network can learn more discriminative features with less optimization difficulty.2.2.2 Methods Based on Generative Adversarial Network Inherent Traces
2.3 Troubles with Current Deepfake Traceability
3. Research Methods
3.1. K-Means and Calinski Harabasz Evaluation System
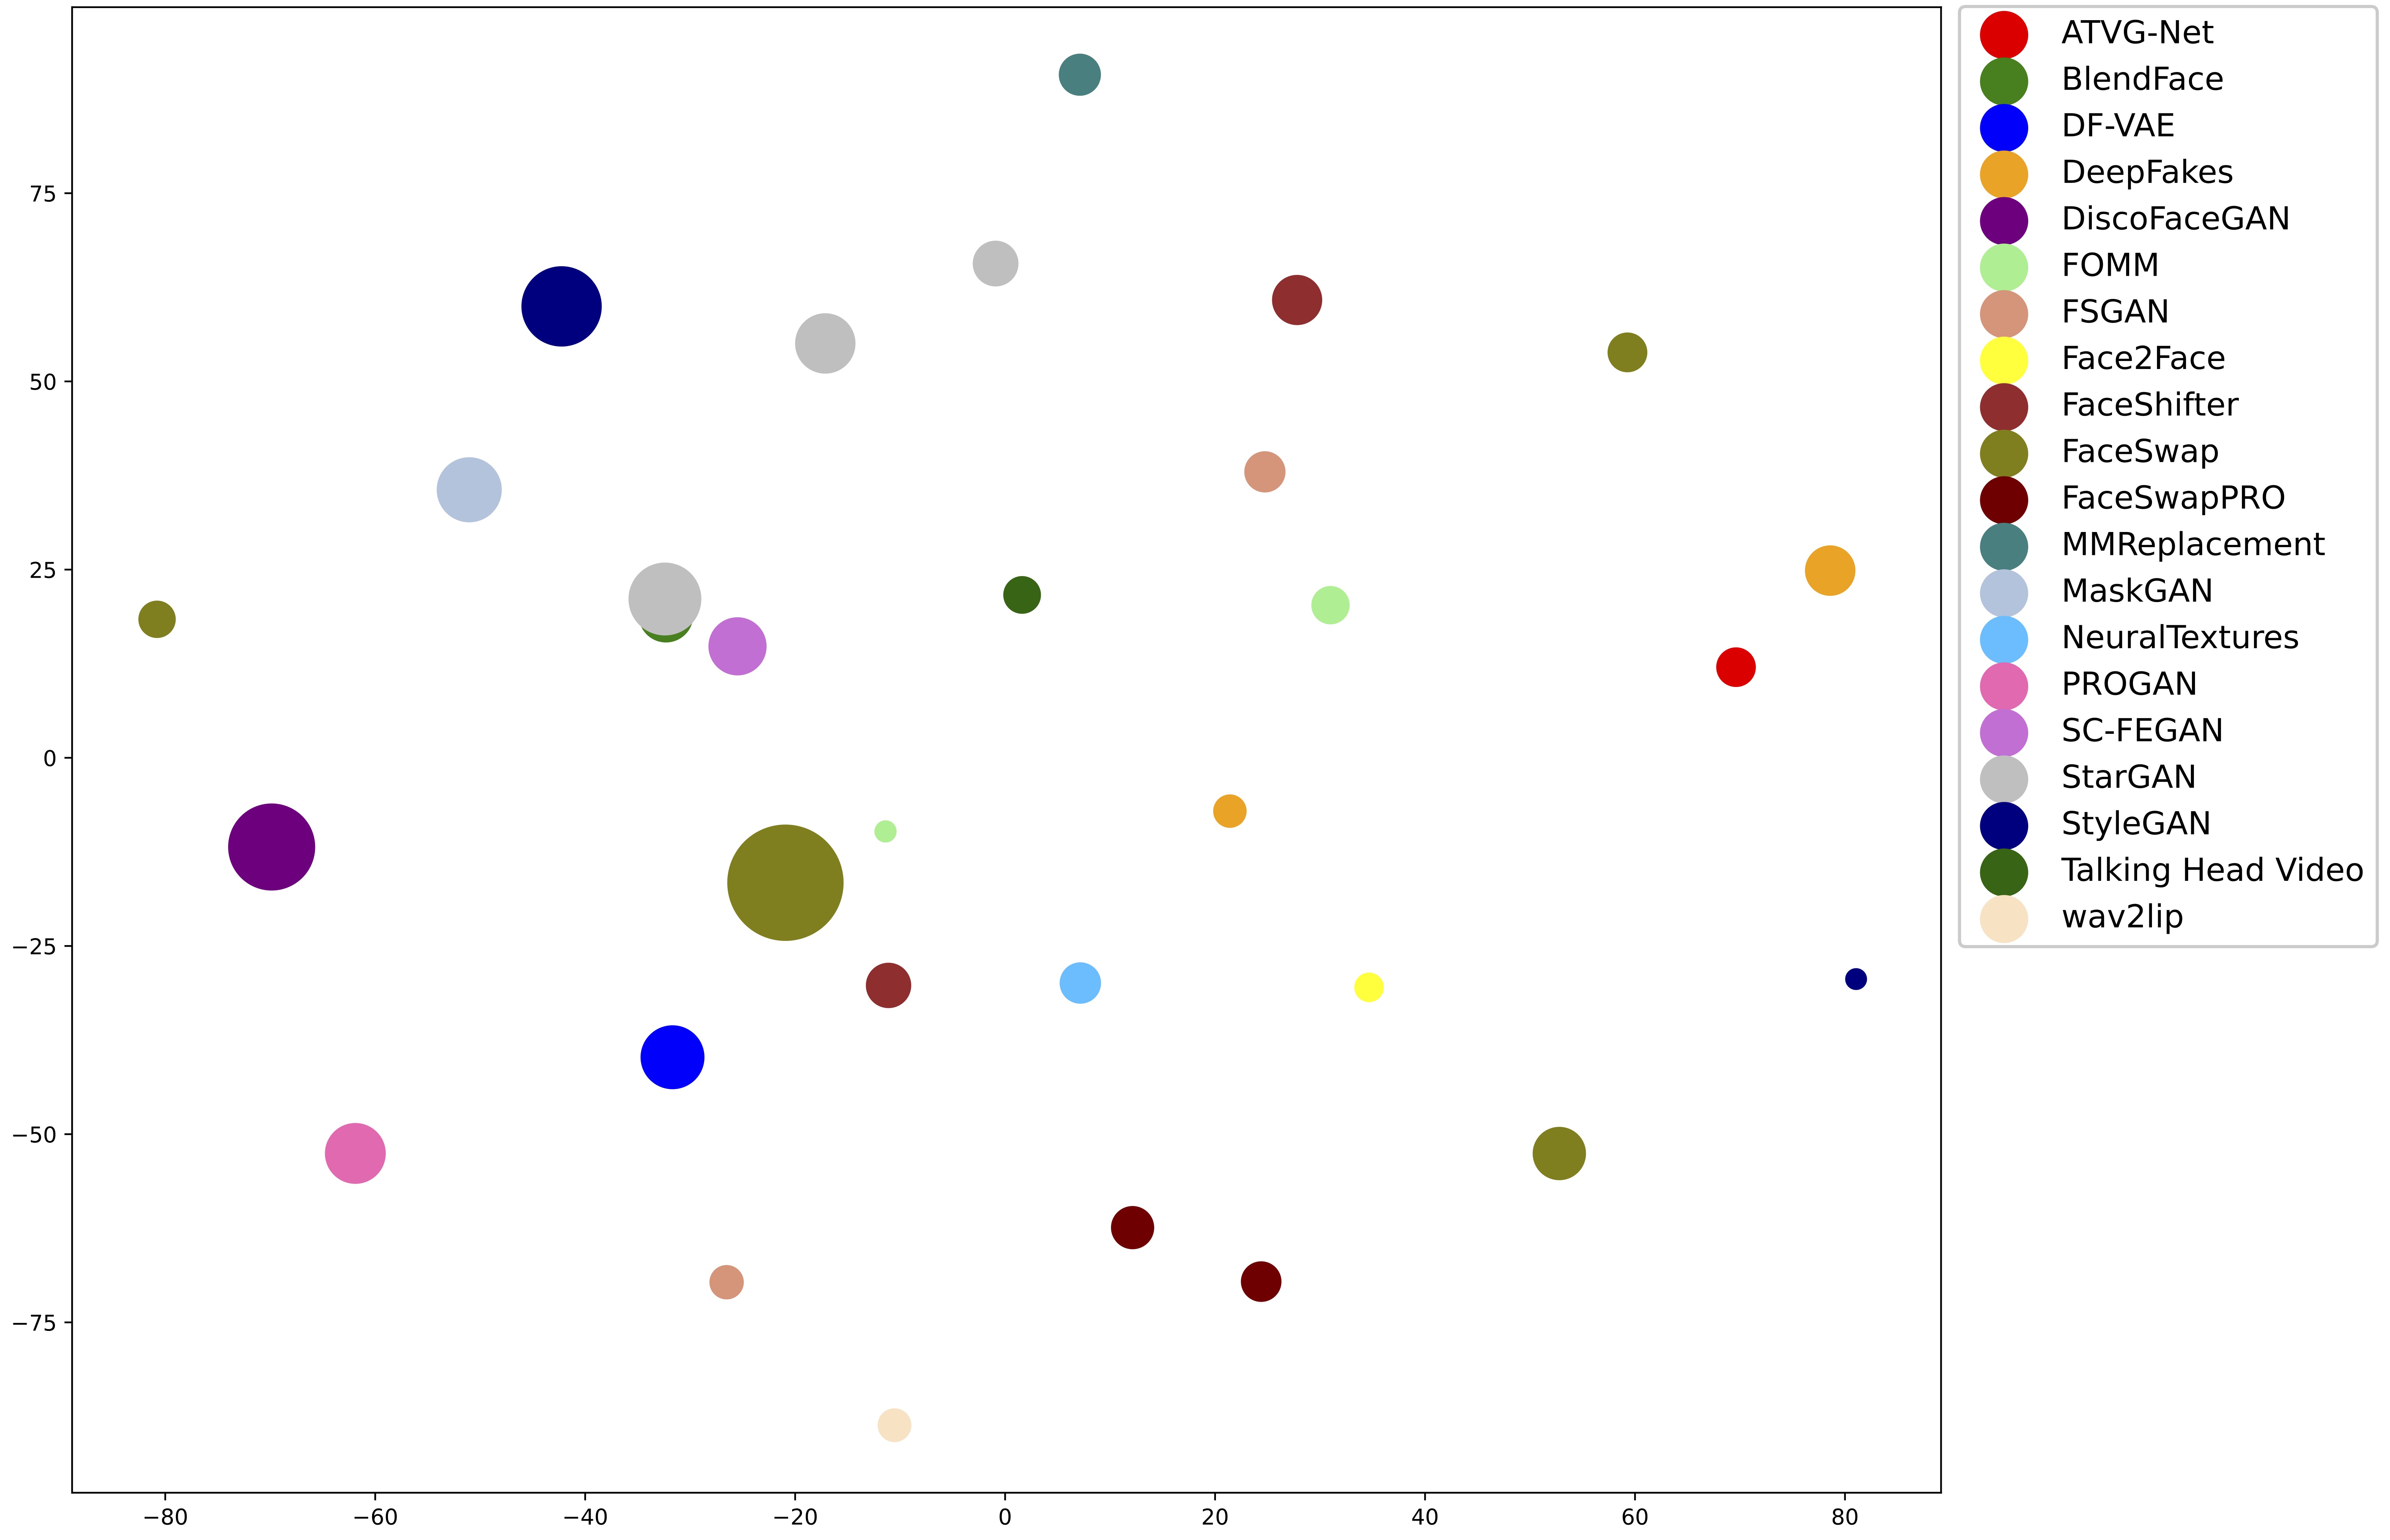
W are tcurrained an Xception model as a feature extractor using various deepfake dataseently the primary deepfake traceability method. Cumulative upsampling can cause apparent changes in the frequency domain, and minor forgery defects and real datasets as training sets. When examining different deepfake datasets in feature space, we observe that specific forgery mcompression errors can be well described in this domain. Using this information can identify fake videos. Spectrum-based methods have certain advantages in generalization because most existing image and video compression methods are also related to the frequency domain. Methods are clustered together. In contrasBased on Generative Adversarial Network Inherent Traces [36][37][38] are anot,her some forgerprimary deepfake traceability methods with similar names are separated, as shown in. The fake faces generated by generative adversarial networks have distinct Figure 2.traces Forand example, one of the FOMM forgery methods is very close to the FaceSwaptexture information compared to real-world photographs, including using an Expectation Maximization algorithm to extract local features that model the convolutional generation process. Use global image textures and method but far from ths based on globally consistent fingerprints.
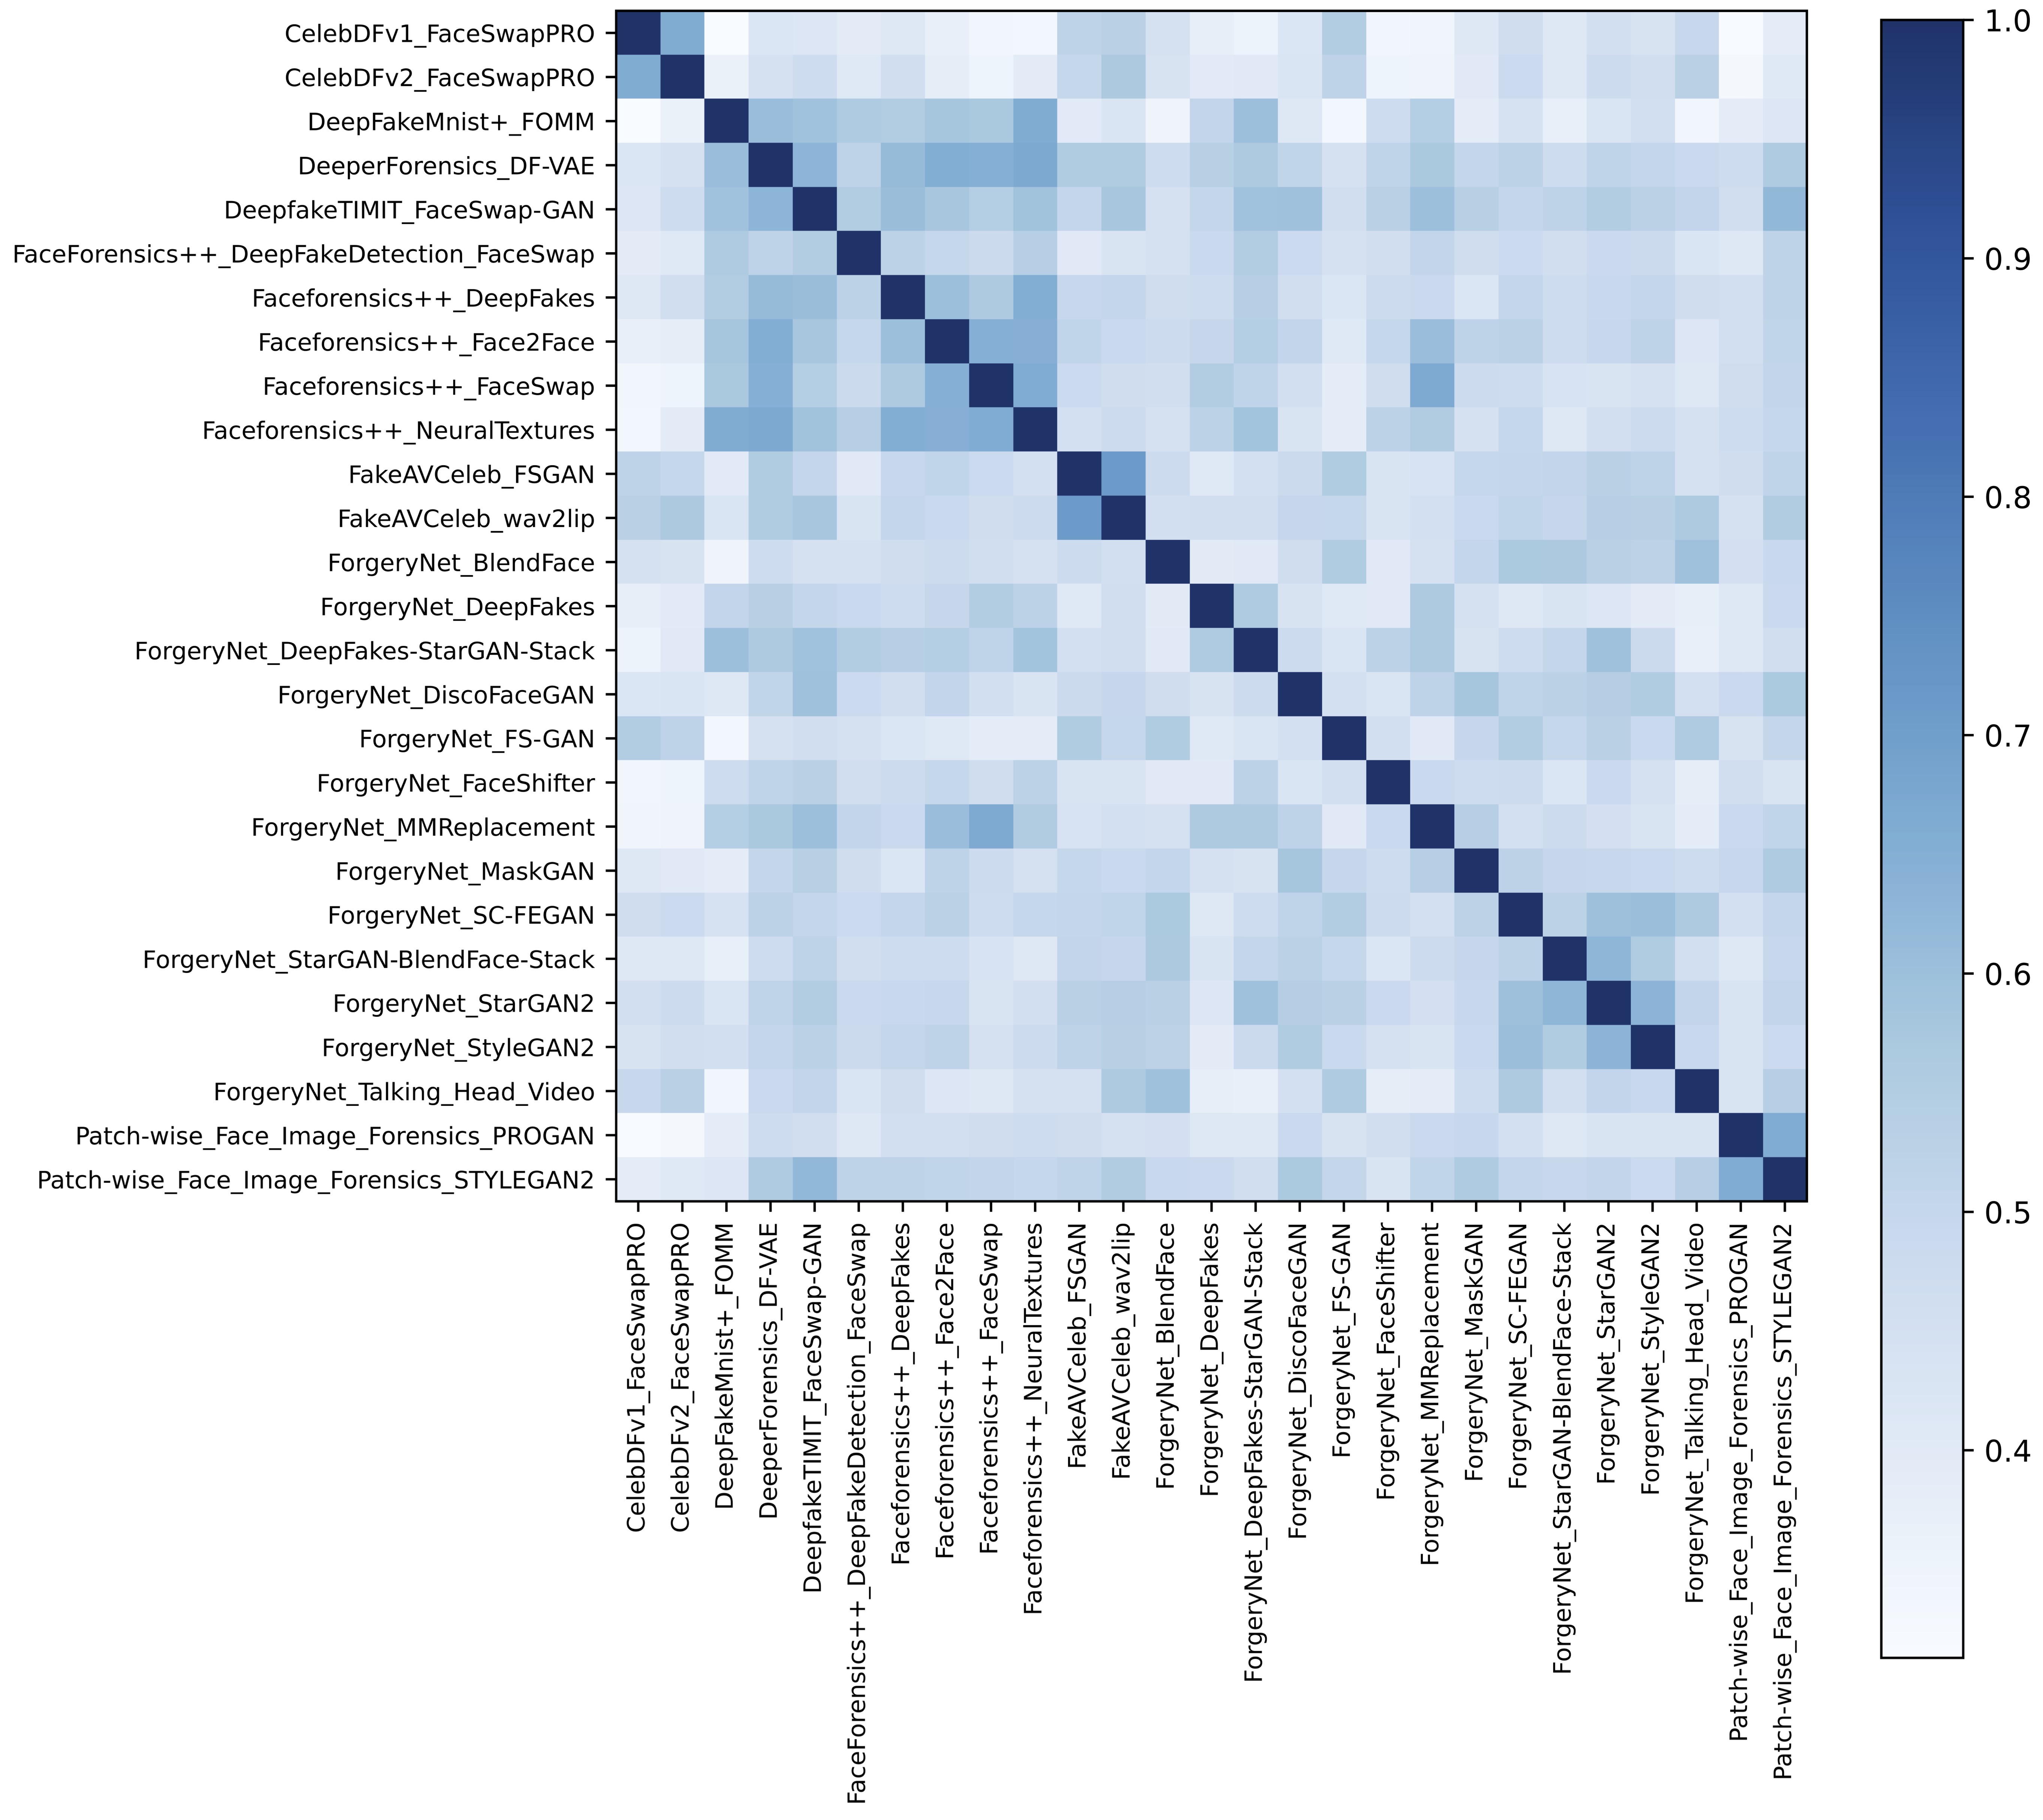
Me other FOMM forgery methods. It shows that theods based on frequency domain and model fingerprints provide traceability for different forgery methods with the same name have a significant feature gap in different datasets, and different. Although researchers claim high accuracy rates in identifying and tracing related forgery methods will have relatively similar features. The same trend can be seen in the Cosine Similarity results in, they typically only use a specific dataset for research. This approach reduces the comprehensiveness of traceability and the model’s generalization ability. Therefore, researchers need Figure 3.to Tco evaluatensider the similarity and correlation between different forgery methods across varioussamples in each dataset to make full use of these datasets. W
However, assume that incorporatingthis presents a significant challenge. Unlike typical computer vision datasets that use the same, deepfake datasets’ labels are based on technical methods and forgery methods will beneficially enhance the model’s performance. Conversely, merging differentpatterns rather than human concepts, making it impossible for humans to identify and evaluate them. The more severe problem is that the labels of forgery methods used in various deepfake datasets or dividing the similar dataset into separate subsets may adversely affect the model’s performance. We developed the K-means and Calinski Harabasz Evaluation System based on the above assumptions. For the sake of simplicity, we refer to it as the KCE-System for shortare entirely arbitrary. Some labels are based on implementation technology, while others are based on forgery modes. For example, many datasets have the label “DeepFakes.” The irregularity and ambiguity of these labeling methods make it difficult to fully utilize the forged data of various deepfake datasets. Some deepfake datasets do not indicate specific forgery methods.
4. The KCE-System
Figure 3.We Siassumilarity matrices for e that incorporating datasets that use the same forgery methods will beneficially enhance the model’s performance. Conversely, merging different forgery methods in each deepfake datasetdatasets or dividing the similar dataset into separate subsets may adversely affect the model’s performance. Based on the above assumptions, we developed the K-means and Calinski Harabasz Evaluation System. For the sake of simplicity, we refer to it as the KCE-System for short.
The KCE-System incorporates unsupervised learning. The system divided the deepfake datasets into training sets and evaluation sets. Then it trains a deepfake recognition model using training sets, and extracting high-dimensional vectors from the middle layer of the model. After dimensionality reduction, the system used the K-means clustering method to merge various deepfake datasets. Using these datasets, the system then trains the new Xception, F3-net, and ResNet models. The trained models are then used to extract 2048-dimensional or 512-dimensional values from the evaluation set as feature values. Finally, the system uses the Calinski Harabasz Index method on the feature values after dimensionality reduction to evaluate The model’s performance, as shown in Figure 42. Next, we will introduce several main parts of the system in detail.
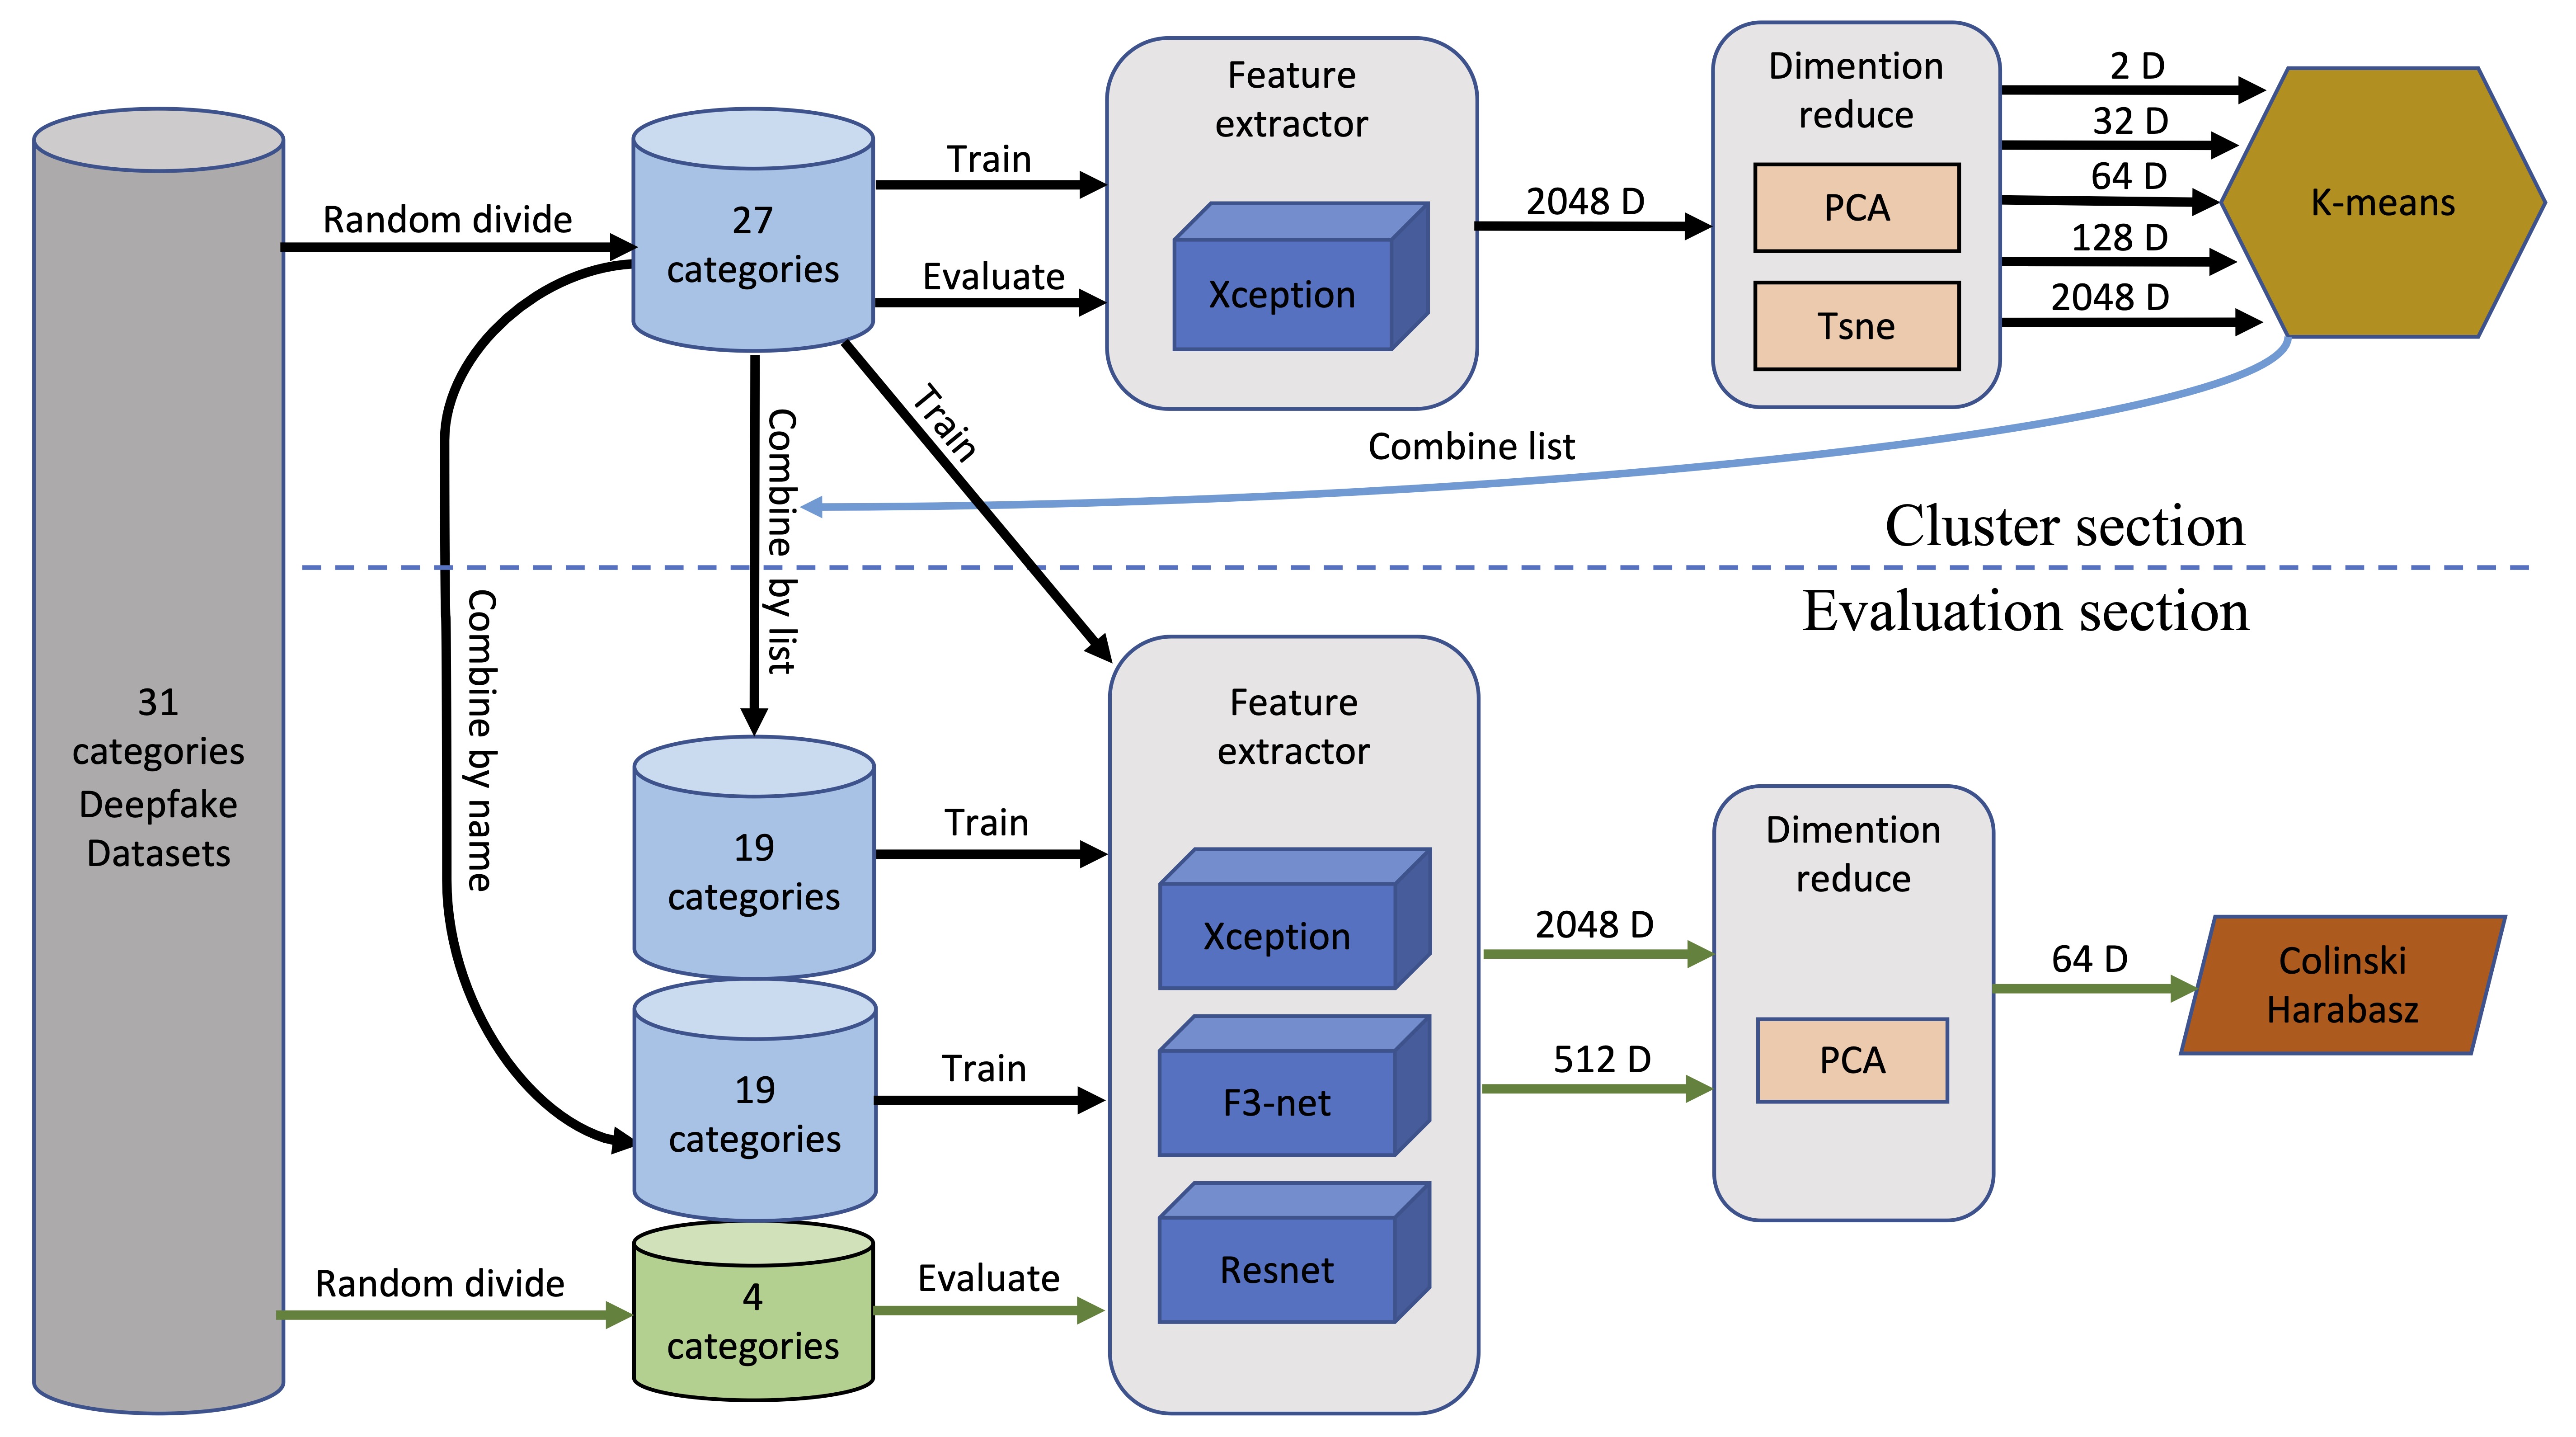
Figure 42. Overview of the KCE-System. The proposed architecture consists of two parts: the cluster section and the evaluation section.
34.21. Feature Extractor
Theoretically, when a model reaches a high classification accuracy for various categories of deep fake data, the model can extract the corresponding deepfake feature. We use the trained deepfake recognition model as a feature extractor, as the accuracy of these models in deepfake multi-classification tasks can reach more than 90%. For a comprehensive evaluation, we provide several representative models with different sizes.
The Xception [18] is a traditional CNN model based on separable convolutions with residual connections. The model has shown high accuracy when detecting deepfake videos. In terms of the training process of the feature extractor, the forgery method indicated in each dataset is used as a pseudo-labelling for multi-class training on the Xception. The training accuracy rate reaches 94%, and the model converges after three training rounds. We use the trained model extract feature on the data of 27 categories of deepfake datasets. We use it as the main Feature Extractor. We take out its 2048-dimensional data as the sample’s feature from the global pooling layer of Xception. Considering the trade-off between performance and efficiency, we select Xception as the baseline model.
The ResNet [20] is an improvement over the traditional deep neural network architecture that solves the problem of vanishing gradients and allows the training of much deeper networks. One of the main advantages of ResNet is its ability to handle deeper architectures, which leads to better accuracy in image classification tasks. Another notable model in facial forgery detection is the F3-Net, as proposed in [9]. This model leverages frequency domain analysis and comprises two branches,; one focused on learning subtles forgery patterns via Frequency-aware Image Decomposition (FAD) , and the other aimed at eextractings high-level semantics from Local Frequency Statistics (LFS). Extensive experiments have demonstrated the effectiveness of the F3-Net in identifying low-quality forgery videos. . Given the widespread applicability of the ResNet model in various computer vision fields and the unique position of the F3-Net in the domain of deepfake detection, we also select these two models as evaluation modelFeature Extractors and test them on half of the test group. To avoid the interference of the model itself on the experimental results to the greatest extent.
34.32. Dimensionality Reduction and Clustering
In this field, clustering algorithms, such as K-means [5039], Gaussian Mixture, and DBSCAN [5140] are commonly used. However, the DBSCAN algorithm is ineffective in controlling the number of clusters formed. In our system, we need to control the number of clusters formed for easy comparison with the data merged by name. The Gaussian Mixture algorithm is mainly designed for non-spherical clusters, while we focus more on the distance between categories in feature space, which emphasizes spherical clustering. Therefore, we chose to use the K-means clustering algorithm in our system.
The K-means algorithm uses Euclidean distance for clustering, but it can fail in high dimensions, so a dimension reduction method must be used. PCA [5241] and t-SNE [5342] are two methods we utilized for comparison. PCA is stable but retains less information when reduced to two or three dimensions. When reducing dimensions to 64 using PCA, the interpretable variance contribution rate can be preserved at 95.2%. From Figure 53, we can see that it effectively preserves most of the information needed for clustering. The t-SNE supports low-dimensional reduction for visual analysis but has poor stability.
We utilize five different dimensionality reduction parameters to determine the most appropriate clustering dimension. We apply the t-SNE algorithm to reduce the high-dimensional feature data to 2 dimensions and use the PCA algorithm to reduce the dimensionality to 32,64, and 128 dimensions. We also keep the 2048 dimensional original features without applying any dimensionality reduction algorithm. We then performed K-means clustering on each of these dimensions individually.
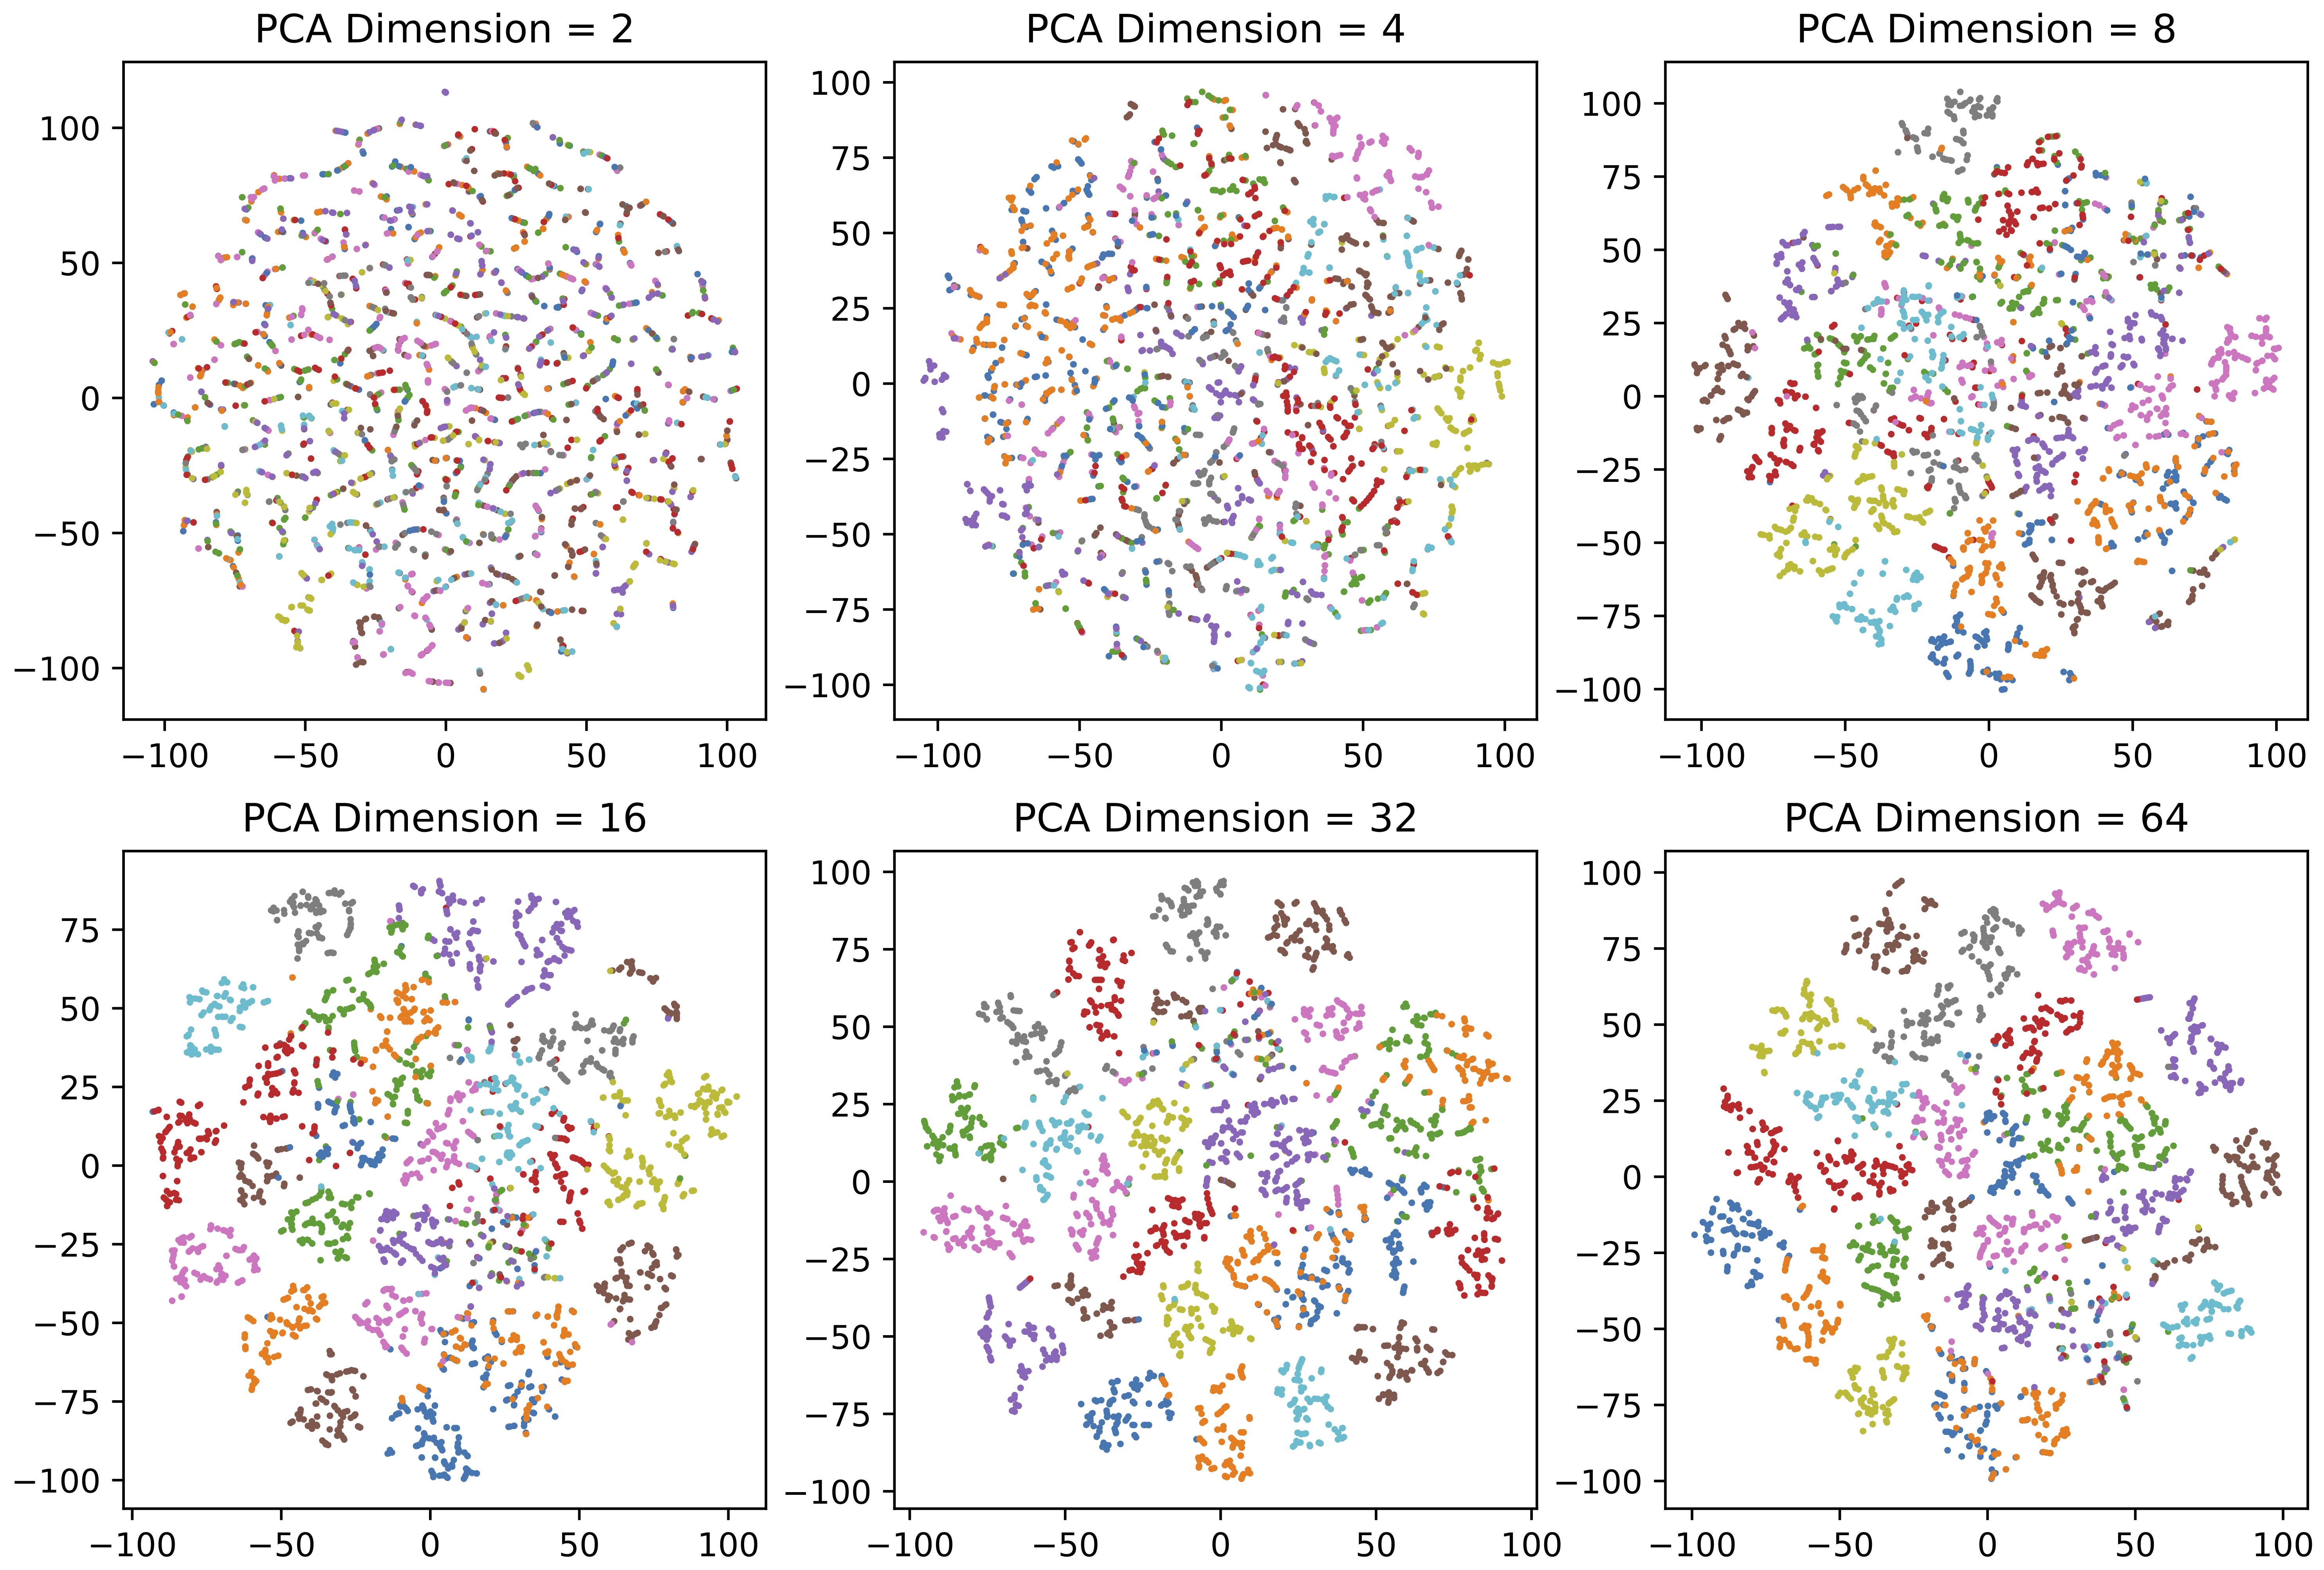
Figure 53. Illustration of dimensionality reduction using PCA. After using PCA to reduce the dimension, use the t-SNE method to reduce the dimension to two dimensions for display (Different colors indicate different forgery methods).
3.4.3 Selection of Evaluation Algorithms
We select four categories of deepfake datasets not involved in the training and clustering process as evaluation sets. We extract Xception, ResNet, and F3-net models’ global pooling layer output and use the PCA algorithm reduces the data to 128 dimensions. An example of the results in Figure 6, demonstrating a clear distinction between the four unknown deepfake categories. This figure indicates that our model has indeed learned the relevant characteristics for identifying deepfakes.
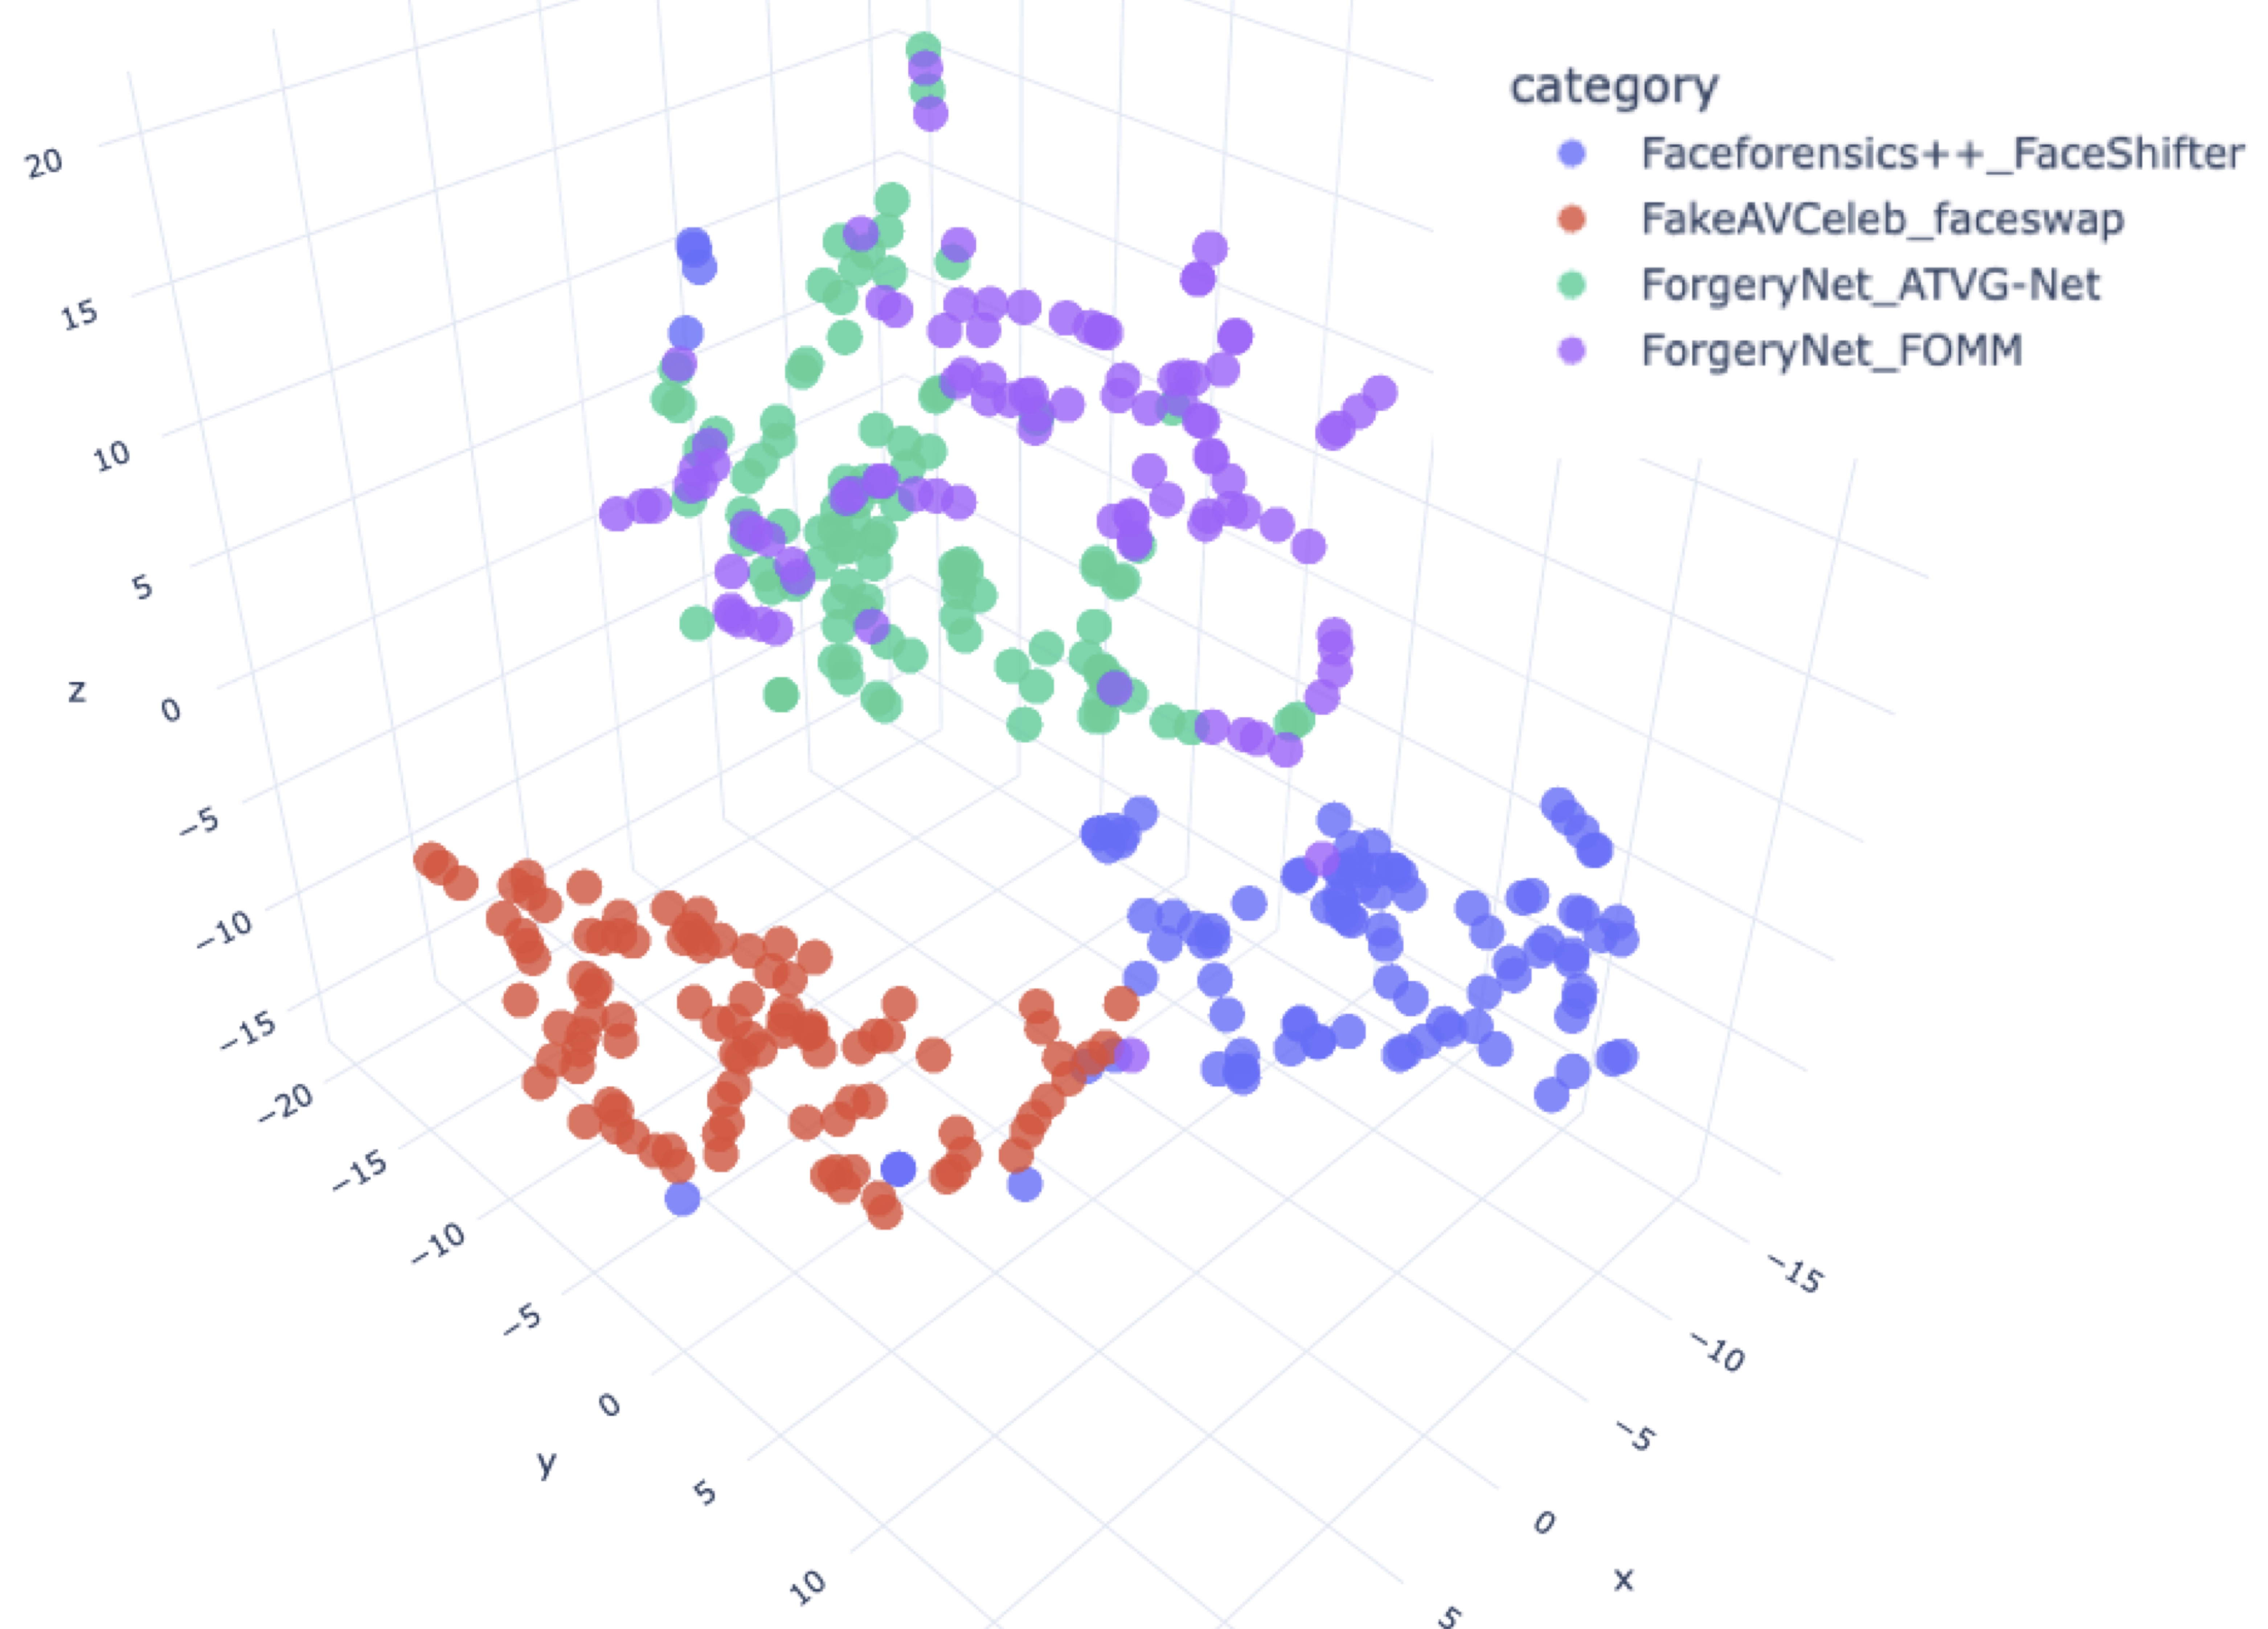
Figure 6. The model output of the evaluation sets, that be reduced to three dimensions using the t-SNE method for display.
Evaluating the performance of models trained with unreliably labeled or unlabeled data is difficult. We can not use precision and recall because we do not have a way to figure out whether each sample is classified correctly. To address this issue, we utilize the Calinski Harabasz Index [196], introduced by Calinski and Harabasz in 1974, as an effective evaluation method. This index is defined in Equation (1) as the ratio of the sum of between cluster dispersion and inter-cluster dispersion for all clusters. Therefore, the Calinski Harabasz Index can be used to evaluate the models, with higher scores indicating that the model performs better on the test datasets.
For a set of data  of size
  , which has been clustered into
  clusters, the Calinski Harabasz score s is defined as the ratio of the between-cluster dispersion means and the within-cluster dispersion, as shown in Equation (1).
 (1)
(1)
where  is trace of the between group dispersion matrix and
  is the trace of the within-cluster dispersion matrix defined by:
 (2)
(2)
 (3)
(3)
Here,  represents the set of points in cluster
 ,
,  represents the center of cluster
  ,
,  represents the center of
  , and
, and  represents the number of points in cluster
  .
.
When using the Calinski Harabasz Index to evaluate clustering quality, it can be observed that the elbow points of the Calinski Harabasz Index tend to be around 3 or 4 of cluster number, as depicted in Figure 74. The results obtained from the Calinski Harabasz Index are consistent with the number of forged method categories in the actual evaluation set. This suggests that the Calinski Harabasz Index is a valuable method to assess the model’s ability to identify new categories of deepfakes. When other training parameters remain the same, if a model’s performance is outstanding, it indicates that the quality of the training set is excellent, with fewer incorrect labels. In other words, we effectively improve the reliability of these classification labels in the training set. Therefore, the Calinski Harabasz Index can effectively evaluate the correlation of these unreliable classification labels in our system.
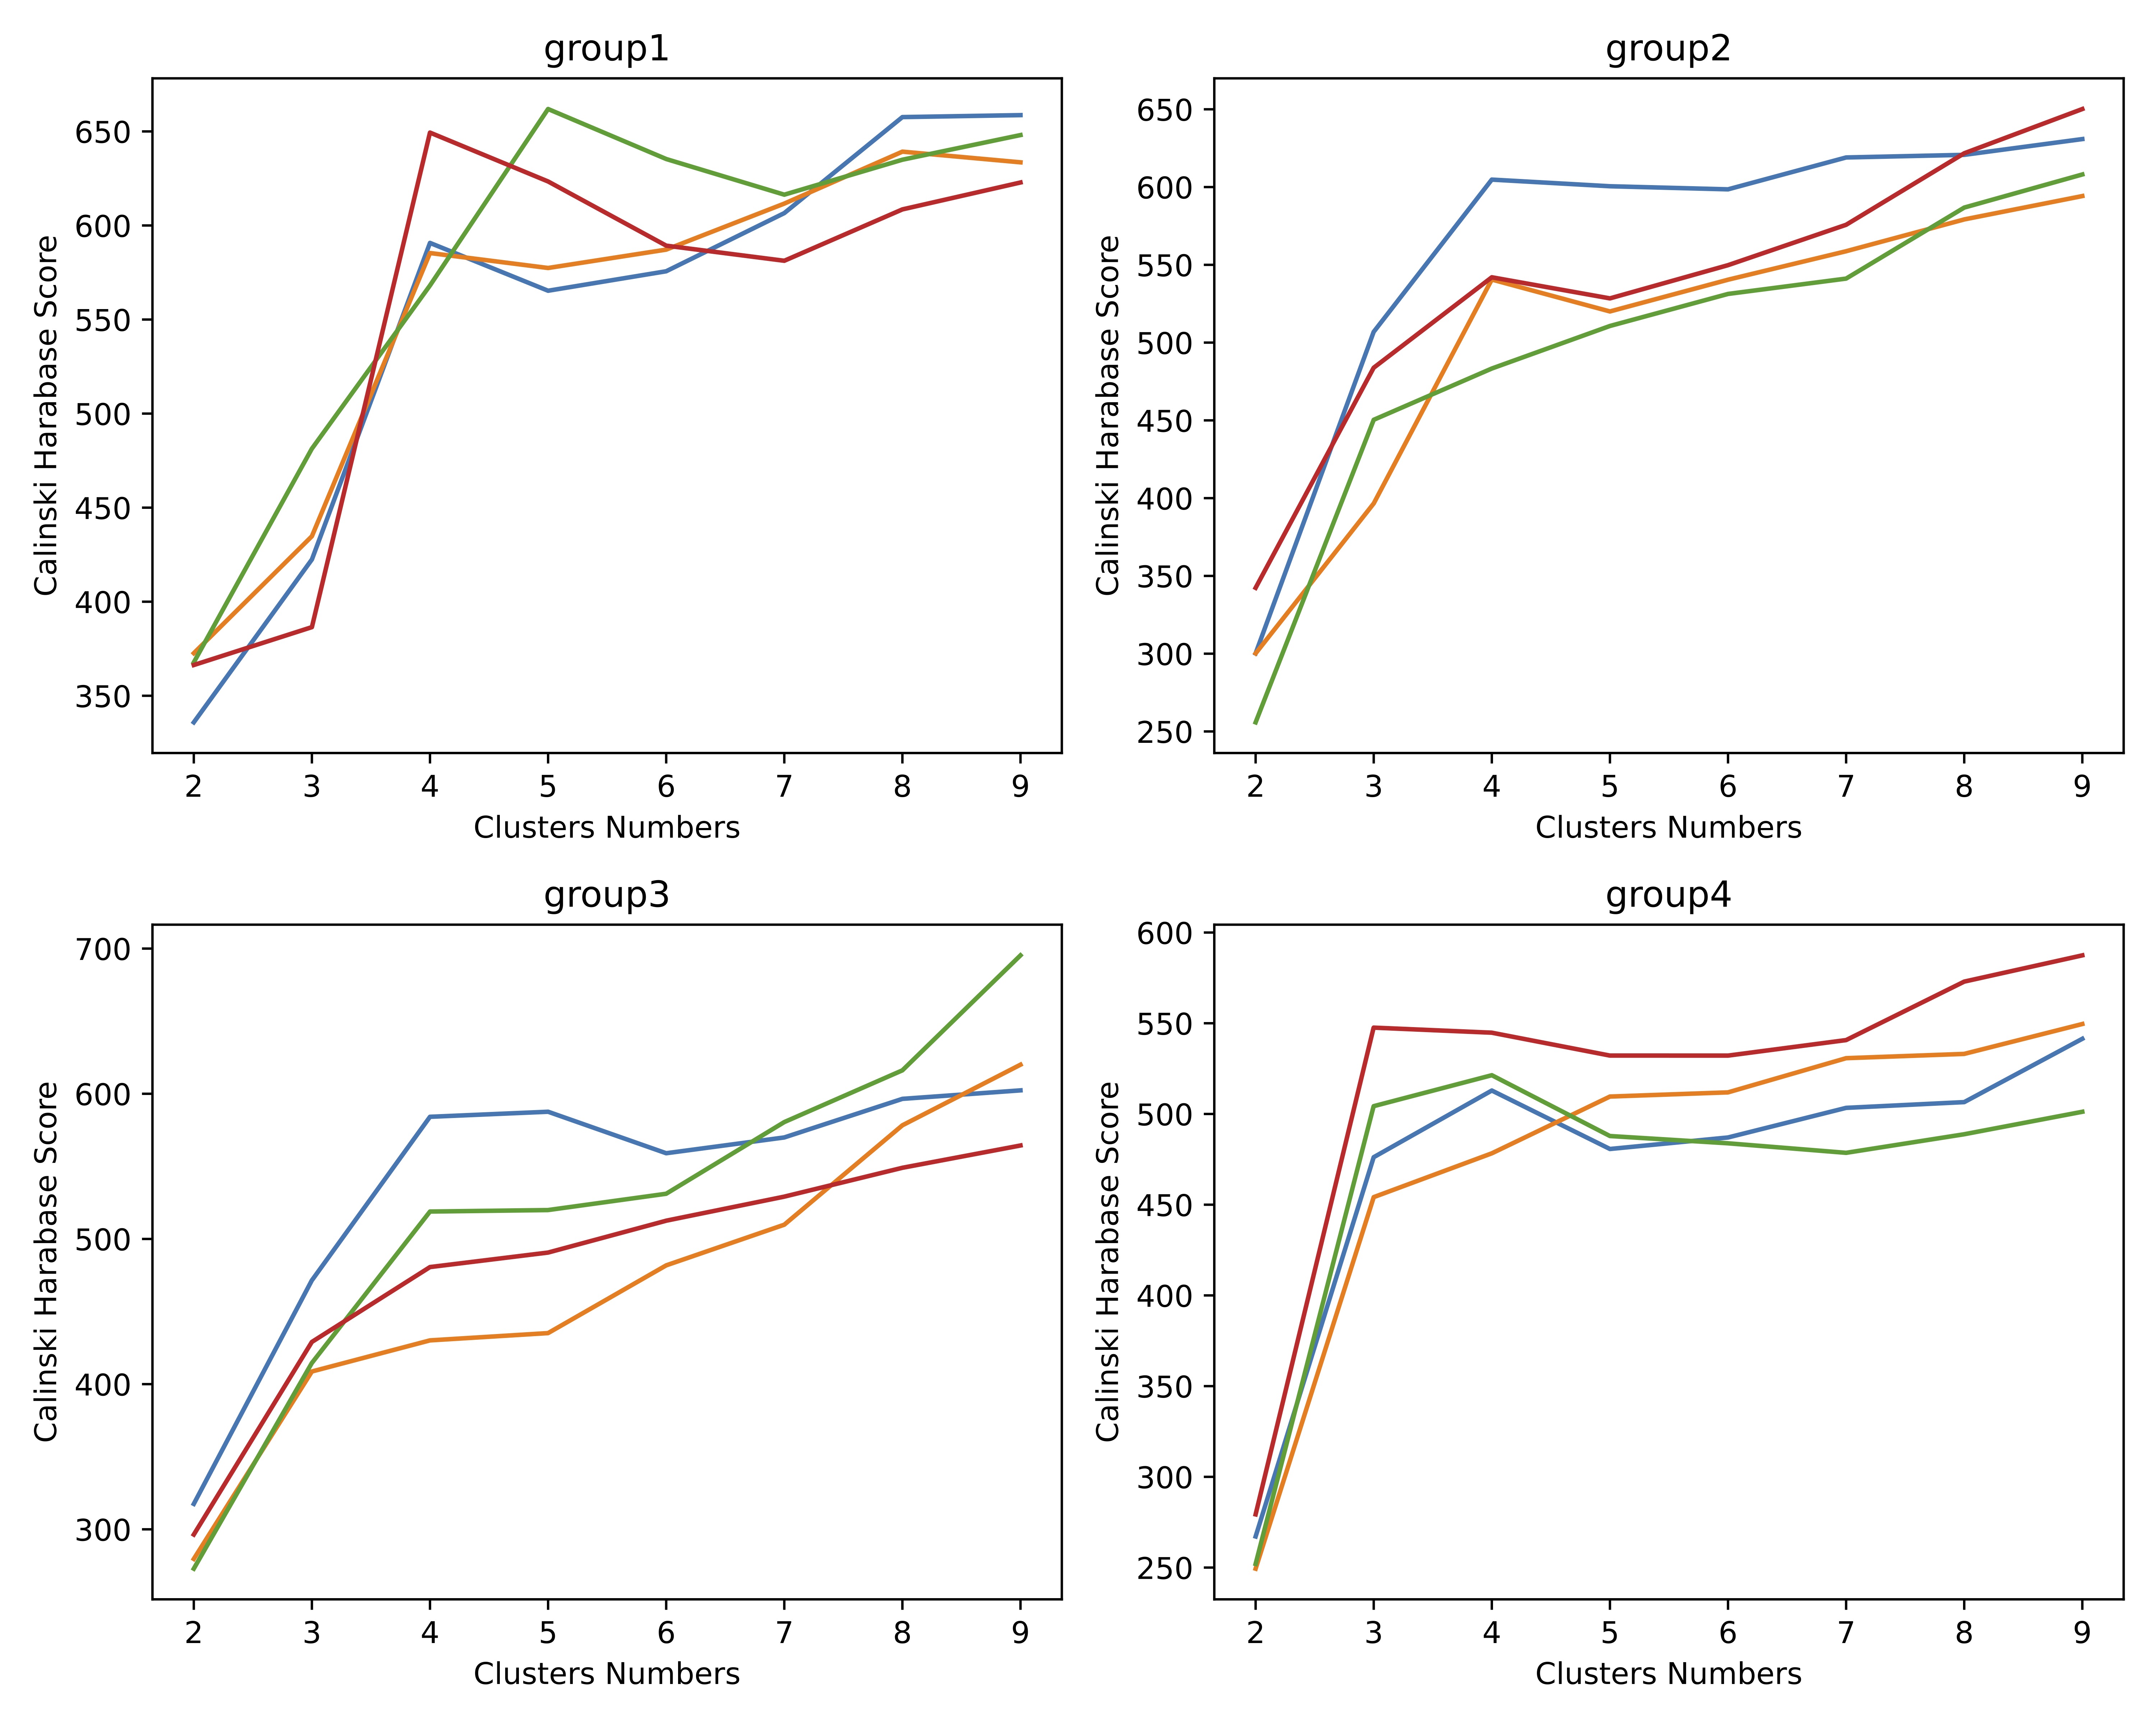
Figure 74. Using Calinski Harabasz Index to evaluate its clustering quality, it can be found that its elbow point is about 3 to 4.
45. Experiment
In this section, we first introduce the overall experimental setup. Our equipment includes four NVIDIA GeForce2080Ti GPUs. We use PyTorch to train and evaluate models, OpenCV to image data preprocessing, and Scikit-learn algorithm library for data analysis. We extract 620,000 fake face images from 10 deepfake datasets and train 40 models, including 32 Xception, 4 F3-net, and 4 ResNet models. The entire data preparation and experimental process spanned approximately 3three months.
45.1. Data Dividing and Preprocessing
We select 31 datasets labeled with forgery method names from CelebDF, DeeperForensics1.0, DeepFakeMnist+, FaceForensics++, ForgeryNet, and FakeAVCeleb,; see Table 1 for details. We use a random method to divide 31 deepfake categories into two sets, where the training set contains 27 categories, and the evaluation set contains four categories. We repeat the above division four times to obtain four sets of training sets and evaluation sets. See Table 2 for details.
Table 2. The table displays four sets of experimental data, each containing four evaluation datasets, with the remaining 27 datasets designated for training purposes.
| ForgeryNet | |
| DeepFakes-StarGAN-Stack | |
| 20,000 | |
| ForgeryNet | |
| DiscoFaceGAN | 20,000 |
| Group | Evaluation Datasets |
| 1 | Faceforensics++_FaceShifter, FakeAVCeleb_FaceSwap, ForgeryNet_ATVG-Net, ForgeryNet_FOMM |
| 2 | DeeperForensics_DF-VAE, Faceforensics++_Face2Face, FakeAVCeleb_Wav2Lip, ForgeryNet_DiscoFaceGAN |
| 3 | DeepfakeTIMIT_FaceSwap-GAN, ForgeryNet_BlendFace, ForgeryNet_StarGAN2, Patch-wise-Face-Image-Forensics _PROGAN |
| 4 | CelebDFv2_FaceSwapPRO, Faceforensics++_ NeuralTextures, ForgeryNet_FS-GAN, ForgeryNet_Talking Head Video |
We extract the frame data of each category according to the instructions of the relevant dataset and use the face detection model Retinaface [54][43] to intercept the face area. Then, we increase the side length of the imagerea by a factor of 1.25. Finally, we randomly select 20,000 fake faces of each category and save these images as test data in png format.
4
Table 2. The table displays four sets of experimental data, each containing four evaluation datasets, with the remaining 27 datasets designated for training purposes.
| Datasets | Synthesis Method | Count | Group1 | Group2 | Group3 | Group4 | ||||
| CelebDFv1 | FaceSwapPRO | 20,000 | ||||||||
| CelebDFv2 | FaceSwapPRO | 20,000 | evaluate | |||||||
| DeeperForensics | DF-VAE | 20,000 | evaluate | |||||||
| DeepFakeMnist+ | FOMM | 20,000 | ||||||||
| DeepfakeTIMIT | FaceSwap-GAN | 20,000 | evaluate | |||||||
| FaceForensics++ DeepFakeDetection | FaceSwap | 20,000 | ||||||||
| Faceforensics++ | DeepFakes | 20,000 | ||||||||
| Faceforensics++ | Face2Face | 20,000 | evaluate | |||||||
| Faceforensics++ | FaceShifter | 20,000 | evaluate | |||||||
| Faceforensics++ | FaceSwap | 20,000 | ||||||||
| Faceforensics++ | NeuralTextures | 20,000 | evaluate | |||||||
| FakeAVCeleb | FaceSwap | 20,000 | evaluate | |||||||
| FakeAVCeleb | FSGAN | 20,000 | ||||||||
| FakeAVCeleb | Wav2Lip | 20,000 | evaluate | |||||||
| ForgeryNet | ATVG-Net | 20,000 | evaluate | |||||||
| ForgeryNet | BlendFace | 20,000 | evaluate | |||||||
| ForgeryNet | DeepFakes | 20,000 | evaluate | |||||||
| ForgeryNet | FaceShifter | 20,000 | ||||||||
| ForgeryNet | FOMM | 20,000 | evaluate | |||||||
| ForgeryNet | FS-GAN | 20,000 | evaluate | |||||||
| ForgeryNet | MaskGAN | 20,000 | ||||||||
| ForgeryNet | MMReplacement | 20,000 | ||||||||
| ForgeryNet | SC-FEGAN | 20,000 | ||||||||
| ForgeryNet | StarGAN-BlendFace-Stack | 20,000 | ||||||||
| ForgeryNet | StarGAN2 | 20,000 | evaluate | |||||||
| ForgeryNet | StyleGAN2 | 20,000 | ||||||||
| ForgeryNet | Talking_Head_Video | 20,000 | evaluate | |||||||
| Patch-wise_Face_Image_Forensics | PROGAN | 20,000 | evaluate | |||||||
| Patch-wise_Face_Image_Forensics | StyleGAN2 | 20,000 |
5.2. Merge Training Data Based on the Category Name
To verify our conjecture that there is large randomness in the naming of the forged methods in the deepfake dataset, we specially merged the training set data according to the principle of the same or close to the forged method names and used them as a control group. We use the following merging rules.
| 6 |
| ForgeryNet_DeepFakes-StarGAN-Stack,ForgeryNet_StarGAN-BlendFace-Stack ,ForgeryNet_StarGAN2 |
| 7 |
| ForgeryNet_StyleGAN2, Patch-wise_Face_Image_Forensics_STYLEGAN2 |
5.3. Merge Training Data Based on the Results of K-Means Clustering
One of the purposes of our experiment is to determine the appropriate dimensionality for K-means clustering to address this type of problem. We need to ensure that we do not lose too many classification features due to excessive dimensionality reduction, nor do we cause the K-means algorithm to fail due to excessive dimensionality. SincWe we chose the Xception model as the baseline, we use the PCA algorithm to reduce the Xception model's 2048-dimensional output to 128, 64, and 32 dimensions. We also reduce it to two dimensions using the t-SNE algorithm. For the F3-net and ResNet models, we only use the PCA algorithm to reduce the output feature value to 64 dimensions since we only need to verify that our method applies to these models.
In the previous section, we created training data for the control group based on name mergers. To facilitate comparison, we ensure that the number of categories of the experimental data for each group is identical. Therefore, we use the K-means clustering algorithm to cluster these training sets based on the specified number of clusters. Groups 1, 3, and 4 have 19 clusters, while Group 2 has 17 clusters. Finally, we use the results of the K-means clustering algorithm to combine the training set.
45.4. Experimental Results
We train Xception, F3-net, and ResNet models using training data merged by K-means clustering results and category names, respectively. For comparison, we also train the same models using the original training set without merging.
To obtain feature vectors for the validation set, we used these models as feature extractors and applied PCA to reduce them to 64 dimensions. We then calculated the Calinski Harabasz Index. Please refer to Table 3 Table 4 for the result.
Table 34. The Calinski Harabasz Index results. Italicized and underlined marks indicate the best result for that group of tests.
| Model | Train Data Merge by | Group 1 CH | Group 2 CH | Group 3 CH | Group 4 CH | Avg CH |
| Xception | Without merging | 128.02825 | 117.448499 | 68.6994684 | 93.5723306 | 101.937137 |
| Xception | Name |
- Merge the FaceSwapPRO category in the CelebDFv1 dataset and the FaceSwapPRO category in the CelebDFv2 dataset.
- Merge the FOMM category in the DeepFakeMnist+ dataset and the FOMM category in the ForgeryNet dataset.
- Merge the FaceSwap-GAN category in the DeepfakeTIMIT dataset, the DeepFakeDetection FaceSwap category and the FaceSwap category in the FaceForensics++ dataset, and the faceswap category in the FakeAVCeleb dataset.
- Merge the DeepFakes category in the Faceforensics++ dataset and the DeepFakes category in the ForgeryNet dataset.
- Merge the FSGAN category in the FakeAVCeleb dataset and the FS-GAN category in the ForgeryNet dataset.
- Merge DeepFakes-StarGAN-Stack category, StarGAN-BlendFace-Stack category and StarGAN2 category in ForgeryNet dataset.
- Merge the StyleGAN2 category in the ForgeryNet dataset and the STYLEGAN2 category in the Patch-wise Face Image Forensics dataset.
We randomly sample corresponding proportions of data from the merged dataset and reassemble them into 20,000 images per categorye Table 3. The number of training set categories of the merged four groups isare that Group 1 has a total of , 3, and 4 have 19 categories, and Group 2 has 17.
Table 3. We randomly total of 17 categories, Group 3 has a total of 19 categories, and Group 4 has a total of 19sample corresponding proportions of data from the merged dataset and reassemble them into 20,000 images per categoriesy.
4
| Rule Number | Merge Categories | |||||
| 1 | CelebDFv1_FaceSwapPRO, CelebDFv1_FaceSwapPRO | |||||
| 2 | DeepFakeMnist+_FOMM, ForgeryNet_FOMM | |||||
| 3 | DeepfakeTIMIT_FaceSwap-GAN, DeepFakeDetection_FaceSwap, FaceForensics++_FaceSwap, FakeAVCeleb_FaceSwap | |||||
| 4 | Faceforensics++_DeepFakes, ForgeryNet_DeepFakes | |||||
| 5 | FakeAVCeleb_FSGAN, ForgeryNet_FS-GAN | |||||
| 84.0837009 | 73.8172086 | 74.579957 | 61.2651927 | 73.4365148 | ||
| Xception | K-means on 2048D | 124.241305 | 105.070655 | 76.2218761 | 84.212058 | 97.4364735 |
| Xception | K-means on t-SNE 2D | 103.627829 | 87.1461055 | 66.6143003 | 76.5264273 | 83.4786656 |
| Xception | K-means on PCA 64D | 137.241584 | 101.192327 | 85.2535376 | 94.2137508 | 104.4753 |
| Xception | K-means on PCA 128D | 101.197038 | 101.502163 | 74.8441997 | 86.6358341 | 91.0448087 |
| Xception | K-means on PCA 32D | 114.247635 | 89.1934801 | 62.3932779 | 75.9596147 | 85.4485019 |
| F3-net | Name | 62.6592813 | 65.6510862 | 64.1551837 | ||
| F3-net | K-means on PCA 64D | 85.361067 | 72.018708 | 78.6898875 | ||
| ResNet | Name | 42.895651 | 47.9716533 | 45.4336522 | ||
| ResNet | K-means on PCA 64D | 49.7529116 | 54.0786263 | 51.915769 |
The Calinski Harabasz Index of the model trained on the data merged by K-means is 42.27% higher than that pooled by name. Furthermore, these scores are slightly higher than those directly using the original training set, even though the original set contains more data. At the same time, the Calinski Harabasz Index is also higher at 22.66% and 14.27% in F3-net and ResNet models. These prove an appropriate combination of deepfake datasets with similar features improves the model’s generalization in the unknown forgery categories.
The Calinski Harabasz Index of the model trained on the data merged by K-means is 42.27% higher than that pooled by name. Furthermore, these scores are slightly higher than those directly using the original training set, even though the original set contains more data. At the same time, the Calinski Harabasz Index is also higher at 22.66% and 14.27% in F3-net and ResNet models. These prove an appropriate combination of deepfake datasets with similar features improves the model’s generalization in the unknown forgery categories.
Compared witompared with the other th the other three groups, the results of Group 2 are different. Furthermore, its Calinski Harabasz Index is lower than the training results on the original data. Because Group 2 has only 17 categories after the merger, with fewer training samples than other groups. More information loss can destroy the performance of the model.
56. Conclusions
ThisWe article starts with the traceability requirements of the deep forgery method. When using multiple prove the labels of various deepfake datasets, we found contain many different deepfake datasets using the same or similar label names. Confusion arises in how to use thesrandomnesses. If researchers use more than two deepfake datasets comprehensively.
We levera, combininge the Xception model to extract fake features from the deepfake dataset. Subsequently, PCA and t-SNE methods are employed to reduce dimensionality and performse datasets only based on forgery labels will hurt the model's performance. We propose K-means clustering. Then, combine the datasets based on the clustering results, and usand Calinski Harabasz evaluation systems to evaluate the combined data to train Xception, F3-net, and ResNet models, respectively. Finally, we use these models to extract features from the evaluation set and evaluate tsimilarity of various deepfake datasets, laying the foundation for future researchers to use them comprehensively. The generalization of these models using the Calinski Harabasz index as an evaluation metric. Our contributions are mainly three-fold:
- We prove the labels of various deepfake datasets contain many randomnesses. If researchers use more than two deepfake datasets, combining these datasets only based on forgery labels will hurt the performance of the model.
- We propose K-means and Calinski Harabasz evaluation systems to evaluate the similarity of various deepfake datasets, laying the foundation for future researchers to use them comprehensively.
- We prove that the generalization ability of the deepfake recognition model in the face of new samples can be improved by merging datasets with high forgery feature similarity.
Our reseability of the deepfake recognition model in the farch is only a helpful exploration for entirely using various deep forgery de of new samples can be improved by merging datasets from the source of deepwith high forgery methods. We mainlyfeature similarity.
Our research revealed the arbitrariness of label naming in deepfake datasets and the resulting troubles in the traceability of forgery methods. There is still a long way to go to solve this problem completely. In addition, different image compression algorithms and image resolutions significantly impact the fake features of deepfake datasets, which will seriously interfere with the model’s extraction of fake features from deepfake datasets, and pose a significant challenge to the identifiability and traceability of deepfake datasets. We are committed to conducting further research to address these challenges effectively.
TFurthermore, to ensure the healthy development of the field, we appeal to research institutioners and universities shouldcompanies to standardize the label nomenclature of deepfake datasets. Additionally, legislation should require digital watermarking and blockchain technology to accurately trace deepfake content to its source. Our research is a helpful exploration of the use of various deep forgery datasets, and we hope it will inspire future work in this field.
References
- Korshunov, P.; Marcel, S. Deepfakes: A new threat to face recognition? assessment and detection. arXiv 2018, arXiv:1812.08685. He, Y.; Gan, B.; Chen, S.; Zhou, Y.; Yin, G.; Song, L.; Sheng, L.; Shao, J.; Liu, Z. Forgerynet: A versatile benchmark for comprehensive forgery analysis. In Proceedings of the IEEE/CVF Conference on Computer Vision and Pattern Recognition. Institute of Electrical and Electronics Engineers, Virtual, 19–25 June 2021; pp. 4360–4369.
- Chesney, B.; Citron, D. Deep fakes: A looming challenge for privacy, democracy, and national security. Calif. L. Rev. 2019, 107, 1753. Huang, J.; Wang, X.; Du, B.; Du, P.; Xu, C. DeepFake MNIST+: A DeepFake Facial Animation Dataset. In Proceedings of the IEEE/CVF International Conference on Computer Vision, Nashville, TN, USA, 20–25 June 2021; IEEE: Piscataway, NJ, USA, 2021; pp. 1973–1982.
- Dixon, H.B., Jr. Deepfakes: More Frightening Than Photoshop on Steroids. Judges’ J. 2019, 58, 35–37. Khalid, H.; Tariq, S.; Kim, M.; Woo, S.S. FakeAVCeleb: A novel audio-video multimodal deepfake dataset. arXiv 2021, arXiv:2108.05080.
- Feldstein, S. How Artificial Intelligence Systems Could Threaten Democracy. Available online: https://scholarworks.boisestate.edu/pubadmin_facpubs/102/ (accessed on 20 December 2022).Jiang, L.; Li, R.; Wu, W.; Qian, C.; Loy, C.C. Deeperforensics-1.0: A large-scale dataset for real-world face forgery detection. In Proceedings of the IEEE/CVF Conference on Computer Vision and Pattern Recognition, Seattle, WA, USA, 13–19 June 2020; IEEE: Piscataway, NJ, USA, 2020; pp. 2889–2898.
- Verdoliva, L. Media forensics and deepfakes: An overview. IEEE J. Sel. Top. Signal Process. 2020, 14, 910–932. Chollet, F. Xception: Deep learning with depthwise separable convolutions. In Proceedings of the IEEE Conference on Computer Vision and Pattern Recognition (CVPR), Honolulu, HI, USA, 21–26 July 2017; IEEE: Piscataway, NJ, USA, 2017; pp. 1800–1807.
- Xiang, Z.; Horváth, J.; Baireddy, S.; Bestagini, P.; Tubaro, S.; Delp, E.J. Forensic analysis of video files using metadata. In Proceedings of the IEEE/CVF Conference on Computer Vision and Pattern Recognition, Virtual, 19–25 June 2021; pp. 1042–1051. Cali ́ nski, T.; Harabasz, J. A dendrite method for cluster analysis. Commun. Stat.-Theory Methods 1974, 3, 1–27.
- Qureshi, A.; Megías, D.; Kuribayashi, M. Detecting deepfake videos using digital watermarking. In Proceedings of the 2021 Asia-Pacific Signal and Information Processing Association Annual Summit and Conference (APSIPA ASC), Tokyo, Japan, 14–17 December 2021; IEEE: Piscataway, NJ, USA, 2021; pp. 1786–1793. Qian, Y.; Yin, G.; Sheng, L.; Chen, Z.; Shao, J. Thinking in frequency: Face forgery detection by mining frequency-aware clues. In Proceedings of the European Conference on Computer Vision; Springer: Berlin/Heidelberg, Germany, 2020; pp. 86–103.
- Goodfellow, I.; Pouget-Abadie, J.; Mirza, M.; Xu, B.; Warde-Farley, D.; Ozair, S.; Courville, A.; Bengio, Y. Generative adversarial networks. Commun. ACM 2020, 63, 139–144. He, K.; Zhang, X.; Ren, S.; Sun, J. Deep residual learning for image recognition. In Proceedings of the IEEE Conference on Computer Vision and Pattern Recognition, Las Vegas, NV, USA, 27–30 June 2016; IEEE: Piscataway, NJ, USA, 2016; pp. 770–778.
- Qian, Y.; Yin, G.; Sheng, L.; Chen, Z.; Shao, J. Thinking in frequency: Face forgery detection by mining frequency-aware clues. In Proceedings of the European Conference on Computer Vision; Springer: Berlin/Heidelberg, Germany, 2020; pp. 86–103. Rossler, A.; Cozzolino, D.; Verdoliva, L.; Riess, C.; Thies, J.; Nießner, M. Faceforensics++: Learning to detect manipulated facial images. In Proceedings of the IEEE/CVF International Conference on Computer Vision, Seoul, Republic of Korea, 27 October–2 November 2019; IEEE: Piscataway, NJ, USA, 2019; pp. 1–11.
- Torralba, A.; Fergus, R.; Freeman, W.T. 80 million tiny images: A large data set for nonparametric object and scene recognition. IEEE Trans. Pattern Anal. Mach. Intell. 2008, 30, 1958–1970. Li, Y.; Yang, X.; Sun, P.; Qi, H.; Lyu, S. Celeb-df: A large-scale challenging dataset for deepfake forensics. In Proceedings of the IEEE/CVF Conference on Computer Vision and Pattern Recognition, Seattle, WA, USA, 13–19 June 2020; IEEE: Piscataway, NJ, USA, 2020; pp. 3207–3216.
- Deng, J.; Dong, W.; Socher, R.; Li, L.J.; Li, K.; Fei-Fei, L. Imagenet: A large-scale hierarchical image database. In Proceedings of the 2009 IEEE Conference on Computer Vision and Pattern Recognition, Institute of Electrical and Electronics Engineers. Miami, FL, USA, 20–25 June 2009; pp. 248–255. Korshunov, P.; Marcel, S. Deepfakes: A new threat to face recognition? assessment and detection. arXiv 2018, arXiv:1812.08685.
- Griffin, G.; Holub, A.; Perona, P. Caltech-256 Object Category Dataset. Available online: https://authors.library.caltech.edu/7694/ (accessed on 12 January 2023).Lee, J. This Dataset Is a Summary of the Datasets Used in the “A Study on Patch-Wise Deepfake Image Detection” Experiment Presented at the Winter Conference of the Korean Society of Telecommunications. Available online: https://github.com/Jeonghan57/A-Study-on-Patch-Wise-Deepfake-Image-Detection (accessed on 20 December 2022).
- Schwarz, H.; Marpe, D.; Wiegand, T. Overview of the scalable video coding extension of the H. 264/AVC standard. IEEE Trans. Circuits Syst. Video Technol. 2007, 17, 1103–1120. Kingma, D.P.; Welling, M. Auto-encoding variational bayes. arXiv 2013, arXiv:1312.6114.
- He, Y.; Gan, B.; Chen, S.; Zhou, Y.; Yin, G.; Song, L.; Sheng, L.; Shao, J.; Liu, Z. Forgerynet: A versatile benchmark for comprehensive forgery analysis. In Proceedings of the IEEE/CVF Conference on Computer Vision and Pattern Recognition. Institute of Electrical and Electronics Engineers, Virtual, 19–25 June 2021; pp. 4360–4369. Korshunova, I.; Shi, W.; Dambre, J.; Theis, L. Fast face-swap using convolutional neural networks. In Proceedings of the IEEE International Conference on Computer Vision, Venice, Italy, 22–29 October 2017; IEEE: Piscataway, NJ, USA, 2017; pp. 3677–3685.
- Huang, J.; Wang, X.; Du, B.; Du, P.; Xu, C. DeepFake MNIST+: A DeepFake Facial Animation Dataset. In Proceedings of the IEEE/CVF International Conference on Computer Vision, Nashville, TN, USA, 20–25 June 2021; IEEE: Piscataway, NJ, USA, 2021; pp. 1973–1982. Nirkin, Y.; Keller, Y.; Hassner, T. Fsgan: Subject agnostic face swapping and reenactment. In Proceedings of the IEEE/CVF International Conference on Computer Vision, Seoul, Republic of Korea, 27 October–2 November 2019; IEEE: Piscataway, NJ, USA, 2019; pp. 7184–7193.
- Khalid, H.; Tariq, S.; Kim, M.; Woo, S.S. FakeAVCeleb: A novel audio-video multimodal deepfake dataset. arXiv 2021, arXiv:2108.05080. Prajwal, K.; Mukhopadhyay, R.; Namboodiri, V.P.; Jawahar, C. A lip sync expert is all you need for speech to lip generation in the wild. In Proceedings of the 28th ACM International Conference on Multimedia, New York, NY, USA, 12–16 October 2020; pp. 484–492.
- Jiang, L.; Li, R.; Wu, W.; Qian, C.; Loy, C.C. Deeperforensics-1.0: A large-scale dataset for real-world face forgery detection. In Proceedings of the IEEE/CVF Conference on Computer Vision and Pattern Recognition, Seattle, WA, USA, 13–19 June 2020; IEEE: Piscataway, NJ, USA, 2020; pp. 2889–2898. Siarohin, A.; Lathuilière, S.; Tulyakov, S.; Ricci, E.; Sebe, N. First order motion model for image animation. In Proceedings of the Advances in Neural Information Processing Systems; Curran Associates, Inc: Red Hook, NY, USA, 2019; Volume 32.
- Chollet, F. Xception: Deep learning with depthwise separable convolutions. In Proceedings of the IEEE Conference on Computer Vision and Pattern Recognition (CVPR), Honolulu, HI, USA, 21–26 July 2017; IEEE: Piscataway, NJ, USA, 2017; pp. 1800–1807.Bshaoanlu. Faceswap-GAN. Available online: https://github.com/shaoanlu/faceswap-GAN (accessed on 12 January 2023).
- Cali ́ nski, T.; Harabasz, J. A dendrite method for cluster analysis. Commun. Stat.-Theory Methods 1974, 3, 1–27.Kowalski, M. FaceSwap. Available online: https://github.com/MarekKowalski/FaceSwap/ (accessed on 12 January 2023).
- He, K.; Zhang, X.; Ren, S.; Sun, J. Deep residual learning for image recognition. In Proceedings of the IEEE Conference on Computer Vision and Pattern Recognition, Las Vegas, NV, USA, 27–30 June 2016; IEEE: Piscataway, NJ, USA, 2016; pp. 770–778.Deepfakes. Available online: https://github.com/deepfakes/faceswap (accessed on 9 January 2023).
- Rossler, A.; Cozzolino, D.; Verdoliva, L.; Riess, C.; Thies, J.; Nießner, M. Faceforensics++: Learning to detect manipulated facial images. In Proceedings of the IEEE/CVF International Conference on Computer Vision, Seoul, Republic of Korea, 27 October–2 November 2019; IEEE: Piscataway, NJ, USA, 2019; pp. 1–11. Thies, J.; Zollhofer, M.; Stamminger, M.; Theobalt, C.; Nießner, M. Face2face: Real-time face capture and reenactment of rgb videos. In Proceedings of the IEEE Conference on Computer Vision and Pattern Recognition, Las Vegas, NV, USA, 27–30 June 2016; IEEE: Piscataway, NJ, USA, 2016; pp. 2387–2395.
- Li, Y.; Yang, X.; Sun, P.; Qi, H.; Lyu, S. Celeb-df: A large-scale challenging dataset for deepfake forensics. In Proceedings of the IEEE/CVF Conference on Computer Vision and Pattern Recognition, Seattle, WA, USA, 13–19 June 2020; IEEE: Piscataway, NJ, USA, 2020; pp. 3207–3216. Li, L.; Bao, J.; Yang, H.; Chen, D.; Wen, F. Faceshifter: Towards high fidelity and occlusion aware face swapping. arXiv 2019, arXiv:1912.13457.
- Lee, J. This Dataset Is a Summary of the Datasets Used in the “A Study on Patch-Wise Deepfake Image Detection” Experiment Presented at the Winter Conference of the Korean Society of Telecommunications. Available online: https://github.com/Jeonghan57/A-Study-on-Patch-Wise-Deepfake-Image-Detection (accessed on 20 December 2022).Thies, J.; Zollhöfer, M.; Nießner, M. Deferred neural rendering: Image synthesis using neural textures. ACM Trans. Graph. (TOG) 2019, 38, 1–12.
- Kingma, D.P.; Welling, M. Auto-encoding variational bayes. arXiv 2013, arXiv:1312.6114. Dufour, N.; Andrew Gully, J. Contributing Data to Deepfake Detection Research. Available online: https://ai.googleblog.com/2019/09/contributing-data-to-deepfake-detection.html (accessed on 25 December 2022).
- Korshunova, I.; Shi, W.; Dambre, J.; Theis, L. Fast face-swap using convolutional neural networks. In Proceedings of the IEEE International Conference on Computer Vision, Venice, Italy, 22–29 October 2017; IEEE: Piscataway, NJ, USA, 2017; pp. 3677–3685. Chen, L.; Maddox, R.K.; Duan, Z.; Xu, C. Hierarchical cross-modal talking face generation with dynamic pixel-wise loss. In Proceedings of the IEEE/CVF Conference on Computer Vision and Pattern Recognition, Long Beach, CA, USA, 15–20 June 2019; IEEE: Piscataway, NJ, USA, 2019; pp. 7832–7841.
- Nirkin, Y.; Keller, Y.; Hassner, T. Fsgan: Subject agnostic face swapping and reenactment. In Proceedings of the IEEE/CVF International Conference on Computer Vision, Seoul, Republic of Korea, 27 October–2 November 2019; IEEE: Piscataway, NJ, USA, 2019; pp. 7184–7193. Deng, Y.; Yang, J.; Chen, D.; Wen, F.; Tong, X. Disentangled and controllable face image generation via 3d imitative-contrastive learning. In Proceedings of the IEEE/CVF Conference on Computer Vision and Pattern Recognition, Seattle, WA, USA, 13–19 June 2020; IEEE: Piscataway, NJ, USA, 2020; pp. 5154–5163.
- Prajwal, K.; Mukhopadhyay, R.; Namboodiri, V.P.; Jawahar, C. A lip sync expert is all you need for speech to lip generation in the wild. In Proceedings of the 28th ACM International Conference on Multimedia, New York, NY, USA, 12–16 October 2020; pp. 484–492. Lee, C.H.; Liu, Z.; Wu, L.; Luo, P. Maskgan: Towards diverse and interactive facial image manipulation. In Proceedings of the IEEE/CVF Conference on Computer Vision and Pattern Recognition, Seattle, WA, USA, 13–19 June 2020; IEEE: Piscataway, NJ, USA, 2020; pp. 5549–5558.
- Siarohin, A.; Lathuilière, S.; Tulyakov, S.; Ricci, E.; Sebe, N. First order motion model for image animation. In Proceedings of the Advances in Neural Information Processing Systems; Curran Associates, Inc: Red Hook, NY, USA, 2019; Volume 32. Jo, Y.; Park, J. Sc-fegan: Face editing generative adversarial network with user’s sketch and color. In Proceedings of the IEEE/CVF International Conference on Computer Vision, Seoul, Republic of Korea, 27 October–2 November 2019; IEEE: Piscataway, NJ, USA, 2019; pp. 1745–1753.
- Bshaoanlu. Faceswap-GAN. Available online: https://github.com/shaoanlu/faceswap-GAN (accessed on 12 January 2023).Choi, Y.; Uh, Y.; Yoo, J.; Ha, J.W. Stargan v2: Diverse image synthesis for multiple domains. In Proceedings of the IEEE/CVF Conference on Computer Vision and Pattern Recognition, Seattle, WA, USA, 13–19 June 2020; IEEE: Piscataway, NJ, USA, 2020; pp. 8188–8197.
- Kowalski, M. FaceSwap. Available online: https://github.com/MarekKowalski/FaceSwap/ (accessed on 12 January 2023).Viazovetskyi, Y.; Ivashkin, V.; Kashin, E. Stylegan2 distillation for feed-forward image manipulation. In Proceedings of the European Conference on Computer Vision, Glasgow, UK, 23–28 August 2020; Springer: Berlin/Heidelberg, Germany, 2020; pp. 170–186.
- Deepfakes. Available online: https://github.com/deepfakes/faceswap (accessed on 9 January 2023).Fried, O.; Tewari, A.; Zollhöfer, M.; Finkelstein, A.; Shechtman, E.; Goldman, D.B.; Genova, K.; Jin, Z.; Theobalt, C.; Agrawala, M. Text-based editing of talking-head video. ACM Trans. Graph. (TOG) 2019, 38, 1–14.
- Thies, J.; Zollhofer, M.; Stamminger, M.; Theobalt, C.; Nießner, M. Face2face: Real-time face capture and reenactment of rgb videos. In Proceedings of the IEEE Conference on Computer Vision and Pattern Recognition, Las Vegas, NV, USA, 27–30 June 2016; IEEE: Piscataway, NJ, USA, 2016; pp. 2387–2395. Gao, H.; Pei, J.; Huang, H. Progan: Network embedding via proximity generative adversarial network. In Proceedings of the 25th ACM SIGKDD International Conference on Knowledge Discovery & Data Mining, New York, NY, USA, 4–8 August 2019; pp. 1308–1316.
- Li, L.; Bao, J.; Yang, H.; Chen, D.; Wen, F. Faceshifter: Towards high fidelity and occlusion aware face swapping. arXiv 2019, arXiv:1912.13457. Chen, Z.; Yang, H. Attentive semantic exploring for manipulated face detection. In Proceedings of the ICASSP 2021–2021 IEEE International Conference on Acoustics, Speech and Signal Processing (ICASSP), Toronto, ON, Canada, 6–11 June 2021; IEEE: Piscataway, NJ, USA, 2021; pp. 1985–1989.
- Thies, J.; Zollhöfer, M.; Nießner, M. Deferred neural rendering: Image synthesis using neural textures. ACM Trans. Graph. (TOG) 2019, 38, 1–12. Liu, H.; Li, X.; Zhou, W.; Chen, Y.; He, Y.; Xue, H.; Zhang, W.; Yu, N. Spatial-phase shallow learning: Rethinking face forgery detection in frequency domain. In Proceedings of the IEEE/CVF Conference on Computer Vision and Pattern Recognition, Nashville, TN, USA, 20–25 June 2021; IEEE: Piscataway, NJ, USA, 2021; pp. 772–781.
- Dufour, N.; Andrew Gully, J. Contributing Data to Deepfake Detection Research. Available online: https://ai.googleblog.com/2019/09/contributing-data-to-deepfake-detection.html (accessed on 25 December 2022).Li, J.; Xie, H.; Li, J.; Wang, Z.; Zhang, Y. Frequency-aware discriminative feature learning supervised by single-center loss for face forgery detection. In Proceedings of the IEEE/CVF Conference on Computer Vision and Pattern Recognition, Nashville, TN, USA, 20–25 June 2021; IEEE: Piscataway, NJ, USA, 2021; pp. 6454–6463.
- Chen, L.; Maddox, R.K.; Duan, Z.; Xu, C. Hierarchical cross-modal talking face generation with dynamic pixel-wise loss. In Proceedings of the IEEE/CVF Conference on Computer Vision and Pattern Recognition, Long Beach, CA, USA, 15–20 June 2019; IEEE: Piscataway, NJ, USA, 2019; pp. 7832–7841. Guarnera, L.; Giudice, O.; Battiato, S. Deepfake detection by analyzing convolutional traces. In Proceedings of the IEEE/CVF Conference on Computer Vision and Pattern Recognition Workshops (CVPRW), Seattle, WA, USA, 14–19 June 2020; IEEE: Piscataway, NJ, USA, 2020; pp. 2841–2850.
- Deng, Y.; Yang, J.; Chen, D.; Wen, F.; Tong, X. Disentangled and controllable face image generation via 3d imitative-contrastive learning. In Proceedings of the IEEE/CVF Conference on Computer Vision and Pattern Recognition, Seattle, WA, USA, 13–19 June 2020; IEEE: Piscataway, NJ, USA, 2020; pp. 5154–5163. Liu, Z.; Qi, X.; Torr, P.H. Global texture enhancement for fake face detection in the wild. In Proceedings of the IEEE/CVF Conference on Computer Vision and Pattern Recognition, Seattle, WA, USA, 13–19 June 2020; IEEE: Piscataway, NJ, USA, 2020; pp. 8060–8069.
- Lee, C.H.; Liu, Z.; Wu, L.; Luo, P. Maskgan: Towards diverse and interactive facial image manipulation. In Proceedings of the IEEE/CVF Conference on Computer Vision and Pattern Recognition, Seattle, WA, USA, 13–19 June 2020; IEEE: Piscataway, NJ, USA, 2020; pp. 5549–5558. Yang, T.; Huang, Z.; Cao, J.; Li, L.; Li, X. Deepfake Network Architecture Attribution. Proc. AAAI Conf. Artif. Intell. 2022, 36, 4662–4670.
- Jo, Y.; Park, J. Sc-fegan: Face editing generative adversarial network with user’s sketch and color. In Proceedings of the IEEE/CVF International Conference on Computer Vision, Seoul, Republic of Korea, 27 October–2 November 2019; IEEE: Piscataway, NJ, USA, 2019; pp. 1745–1753. Hartigan, J.A.; Wong, M.A. Algorithm AS 136: A k-means clustering algorithm. J. R. Stat. Soc. Ser. C (Appl. Stat.) 1979, 28, 100–108.
- Choi, Y.; Uh, Y.; Yoo, J.; Ha, J.W. Stargan v2: Diverse image synthesis for multiple domains. In Proceedings of the IEEE/CVF Conference on Computer Vision and Pattern Recognition, Seattle, WA, USA, 13–19 June 2020; IEEE: Piscataway, NJ, USA, 2020; pp. 8188–8197. Ester, M.; Kriegel, H.P.; Sander, J.; Xu, X. Density-based spatial clustering of applications with noise. In Proceedings of the International Conference Knowledge Discovery and Data Mining, Portland, Oregon, 2–4 August 1996; Volume 240, pp. 11–30.
- Viazovetskyi, Y.; Ivashkin, V.; Kashin, E. Stylegan2 distillation for feed-forward image manipulation. In Proceedings of the European Conference on Computer Vision, Glasgow, UK, 23–28 August 2020; Springer: Berlin/Heidelberg, Germany, 2020; pp. 170–186. Hotelling, H. Analysis of a complex of statistical variables into principal components. J. Educ. Psychol. 1933, 24, 417.
- Fried, O.; Tewari, A.; Zollhöfer, M.; Finkelstein, A.; Shechtman, E.; Goldman, D.B.; Genova, K.; Jin, Z.; Theobalt, C.; Agrawala, M. Text-based editing of talking-head video. ACM Trans. Graph. (TOG) 2019, 38, 1–14. Van der Maaten, L.; Hinton, G. Visualizing data using t-SNE. J. Mach. Learn. Res. 2008, 9, 2579–2605.
- Gao, H.; Pei, J.; Huang, H. Progan: Network embedding via proximity generative adversarial network. In Proceedings of the 25th ACM SIGKDD International Conference on Knowledge Discovery & Data Mining, New York, NY, USA, 4–8 August 2019; pp. 1308–1316. Deng, J.; Guo, J.; Ververas, E.; Kotsia, I.; Zafeiriou, S. Retinaface: Single-shot multi-level face localisation in the wild. In Proceedings of the IEEE/CVF Conference on Computer Vision and Pattern Recognition, Seattle, WA, USA, 13–19 June 2020; IEEE: Piscataway, NJ, USA, 2020; pp. 5203–5212.
- Chen, Z.; Yang, H. Attentive semantic exploring for manipulated face detection. In Proceedings of the ICASSP 2021–2021 IEEE International Conference on Acoustics, Speech and Signal Processing (ICASSP), Toronto, ON, Canada, 6–11 June 2021; IEEE: Piscataway, NJ, USA, 2021; pp. 1985–1989.
- Liu, H.; Li, X.; Zhou, W.; Chen, Y.; He, Y.; Xue, H.; Zhang, W.; Yu, N. Spatial-phase shallow learning: Rethinking face forgery detection in frequency domain. In Proceedings of the IEEE/CVF Conference on Computer Vision and Pattern Recognition, Nashville, TN, USA, 20–25 June 2021; IEEE: Piscataway, NJ, USA, 2021; pp. 772–781.
- Li, J.; Xie, H.; Li, J.; Wang, Z.; Zhang, Y. Frequency-aware discriminative feature learning supervised by single-center loss for face forgery detection. In Proceedings of the IEEE/CVF Conference on Computer Vision and Pattern Recognition, Nashville, TN, USA, 20–25 June 2021; IEEE: Piscataway, NJ, USA, 2021; pp. 6454–6463.
- Guarnera, L.; Giudice, O.; Battiato, S. Deepfake detection by analyzing convolutional traces. In Proceedings of the IEEE/CVF Conference on Computer Vision and Pattern Recognition Workshops (CVPRW), Seattle, WA, USA, 14–19 June 2020; IEEE: Piscataway, NJ, USA, 2020; pp. 2841–2850.
- Liu, Z.; Qi, X.; Torr, P.H. Global texture enhancement for fake face detection in the wild. In Proceedings of the IEEE/CVF Conference on Computer Vision and Pattern Recognition, Seattle, WA, USA, 13–19 June 2020; IEEE: Piscataway, NJ, USA, 2020; pp. 8060–8069.
- Yang, T.; Huang, Z.; Cao, J.; Li, L.; Li, X. Deepfake Network Architecture Attribution. Proc. AAAI Conf. Artif. Intell. 2022, 36, 4662–4670.
- Hartigan, J.A.; Wong, M.A. Algorithm AS 136: A k-means clustering algorithm. J. R. Stat. Soc. Ser. C (Appl. Stat.) 1979, 28, 100–108.
- Ester, M.; Kriegel, H.P.; Sander, J.; Xu, X. Density-based spatial clustering of applications with noise. In Proceedings of the International Conference Knowledge Discovery and Data Mining, Portland, Oregon, 2–4 August 1996; Volume 240, pp. 11–30.
- Hotelling, H. Analysis of a complex of statistical variables into principal components. J. Educ. Psychol. 1933, 24, 417.
- Van der Maaten, L.; Hinton, G. Visualizing data using t-SNE. J. Mach. Learn. Res. 2008, 9, 2579–2605.