TRenewable electricity for off-grid areas is widely seen as one of the top che reliability and vulnerability ofoices in supporting local economic development in most countries, and so is Vietnam. Over the years, many isolated networks using renewable energy sources have been deployed for off-grid areas in Vietnam. However, the use of these energy sources in Vietnam’s isolated networks should be furtheris still facing many challenges due to its infancy here. The issues of reliability and vulnerability of these networks are not given the expected attention, especially modern networks with high renewable energy integration. Another challenge is that the issues of the operational security of these systems could also be negatively affected by the variable nature of renewable sources, including static and dynamic security. For this reason, this study aims to contribute to a better understanding of integrating renewable energy into isolated networks, and in this case, using solar power for the An-Binh Island grid in Vietnam. The findings from this study suggest that choosing the right structure of the power mix could contribute to improving the operational security of isolated networks. Moreover, several solutions to enhance the reliability of this grid are also proposed.
- photovoltaic
- isolated networks
- dynamic security
- static security
- Vietnam
1. Introduction
Nowadays, renewable energy sources (RES) are developing strongly in the entire world [1][2][3][1–3]. The total installed capacity of renewable power reached nearly 300 GW by 2021, accounting for 29% of total global electricity production [1]. This growth was achieved by the rise of solar and hydropower, with the majority of installed capacity coming from solar photovoltaic (PV). Renewable energy investments continue to grow, with solar energy accounting for nearly half of the total global investment in renewables. Financial incentives for renewable power generation continue to be enacted by governments despite the impact of the COVID-19 pandemic and the Ukraine crisis. Moreover, policies are also designed to ensure the successful integration of RES into energy systems, focusing on the flexibility, operational security, and resilience of networks.
Power stations using RES play an increasingly important role in electricity supply, especially in rural and remote areas [1][2][3][1–3]. Small stand-alone grids based on these energy sources are often one of the most efficient ways to power off-grid areas, especially solar-powered grids. For this reason, during the pandemic, many renewable-energy-based grid projects slowed down, but new mini-solar grids were still put into use. In addition, during the current Ukraine crisis, the competitiveness of RES with fossil fuels is being improved due to high fossil fuel prices. The deployment of RES also aims to reduce the dependence on imported fuels from abroad, thereby strengthening domestic energy security.
Renewable electricity could be supplied for domestic demand both from centralized power plants via the transmission lines and distributed grids, depending on local conditions [1][2][1,2]. Currently, distributed PV applications in residential and commercial properties are encouraged in order to reduce electricity consumption by final consumers. Moreover, the integration of distributed generation (DG) in networks is the result of the privatization of the electricity market, environmental protection from emissions, and technological advances. Furthermore, these distributed networks also enable households in developing countries to access clean electrical energy. By 2020, tens of millions of people have access to basic electrical services via the use of solar PV systems at home, and about 87% of mini-networks are operated by RES, mainly solar PV [1].
However, the presence of DG units in distribution networks also poses serious problems and challenges for them [4][5][6][4–6]. The issues of voltage violation, overvoltage, and undervoltage are often present in radial distribution networks with DG. This problem was reported to be caused by the DG units being incompatible with existing voltage regulation methods because of the bidirectional power generation. In fact, this is unavoidable in modern distribution networks where the issues of voltage drop and power loss are very important, and the variable nature of RES could negatively impact the voltage profile and thus degrade the quality of power supplied to final consumers. Nevertheless, the presence of DG is also believed to support and improve voltage profiles in these networks.
The findings in documents [7][8][9][10][11][7–11] show that DG units could minimize power losses (real and reactive power) in distribution networks, and the location and size of these DG units play an essential role in eliminating these losses. For this reason, the optimal structure of DG units in these networks should be determined to minimize losses. Several methods to determine the optimal location and size for DG units are introduced in [7][9][10][12][13][14][15][7,9,10,12–15] to improve voltage quality and reduce power losses in distribution networks. The proposed methods show that this could be achieved by choosing the proper size and position for the DG units.
In Vietnam, DG units using RES in distribution networks have been in place since the 2000s [16][17][18][19][16–19], and the latest policies also clearly demonstrate the Government’s determination in promoting the development of renewable electricity on islands across the country [20][21][20,21]. In parallel with the issuance of these mechanisms, many renewable power projects are also implemented, including isolated grid projects with RES-based DG units for off-grid areas [22], and one of these is the current isolated network on An-Binh Island (Quang Ngai Province) [23].
The islands are now considered to have a strategic role in the socioeconomic development and defense-security assurance of Vietnam [24], and therefore, it is essential to establish a solid infrastructure for sustainable development on them, especially for energy security. Due to geographical distance and other natural conditions, most of the networks on these islands are not connected to the national electricity system [18][25][18,25]. The power supply on these islands is completely dependent on diesel power and RES on site. Integrating DG units close to final consumers could reduce losses to distribution networks, but the structure of the DG units needs to be adapted to local demand as the reliability of these networks could be affected by the high integration of RES power supply, which may lead to the overloading of existing elements and other voltage violations. Moreover, vulnerability is also one of the main challenges for island networks, which manifests itself in their ability to overcome disturbances (transient or severe) in actual operation [26].
However, in Vietnam, studies on isolated networks are currently very limited. The recent investigations in [27] on isolated networks for Con-Dao Island [27](Vietnam) were also carried out based on static models for planning and design purposes. Another study of an islanded microgrid in Vietnam [28] investigated the frequency response of the system with the change in load and solar power but was built on the basis of simple hypothetical data. According to these studies, these networks also seem to face the same challenges as other RES-based distribution networks, including losses and disturbances in static and dynamic models.
In fact, studying dynamic security for isolated networks does not seem to be popular due to their simplicity. So far, no real-world studies have been conducted to investigate the issues of both static and dynamic security in isolated networks in Vietnam. Even the research results in [4][5][6][7][8][9][10][11][12][13][14][15][4–15] only stop at determining the losses in static security, while the disturbances in dynamic security have not been mentioned. For these reasons, the problems of operational security in these networks could not be detected and addressed appropriately and, as a result, lead to inefficient deployment of energy services.
To fill this gap, this paper intends to survey the operational status of the current An-Binh grid and analyze the optimal operating scenarios based on the local solar potential. Furthermore, the importance of the efficient use and transition of energy on An-Binh Island is also considered.
The structure of this paper consists of five sections. Section 2 mentions the current status of the An-Binh grid, whilst Section 3 addresses the method to simulate and analyze this grid. The results and discussion are shown in Section 4, and Section 5 contains conclusions and an outlook.
2. ApplicCurrent Statious of the An-Binh Grid
An-Binh Island belongs to the Quang Ngai Province with a total natural area of about 0.69 km2 (Figure 1) [29][30][29,30]. The island is located in the tropical monsoon climate zone with two distinct seasons in a year, a rainy season and a dry season [31]. The rainy season starts from August to December and the dry season is from January to July. The solar potential here is quite good, about 4.7 kWh/m2 a day with nearly 2430 h of sunshine a year[32][33] (Figure 2) [32,33].
The population here is quite small with about 500 people with over 100 households [29][30][29,30]. The economy is mainly agro-fishery, 60% of which involves fishery, 34% agriculture (growing onions and garlic), and 6% others. This industry is not currently robust, whereas tourism is emerging in recent years.
The An-Binh power grid is an isolated distribution network at a voltage of 0.4 kV and has a radial configuration with a unidirectional power flow [34] (Figure 2Figure 3). This power grid has been built since 2016 and is expected to achieve success in projects to transition energy and improve energy efficiency for people on the island [23][30][23,30].
The power supply on this island comes from diesel and solar [34]. Currently, the power generation mix consists of two diesel generators with a total capacity of 176 kVA (2 × 88 kVA) and ground-mounted PV systems on-site with a total capacity of 96 kWp. The lines of the An-Binh grid are mostly overhead with a total length of nearly 2700 km.
The power demand between the two seasons is markedly different, high in the dry season and low in the rainy season [34][34] (Figure 4). The monthly demand in the dry season is between 25 and 40 kW with the highest being 55.7 kW in May, while in the rainy season, the monthly demand is from 10 to 25 kW, with the lowest at 8 kW in December. Besides that, the peak hours for daily consumption also differ between the two seasons, from 9 a.m. to 4 p.m. in the dry season and from 6 p.m. to 10 p.m. in the rainy season.
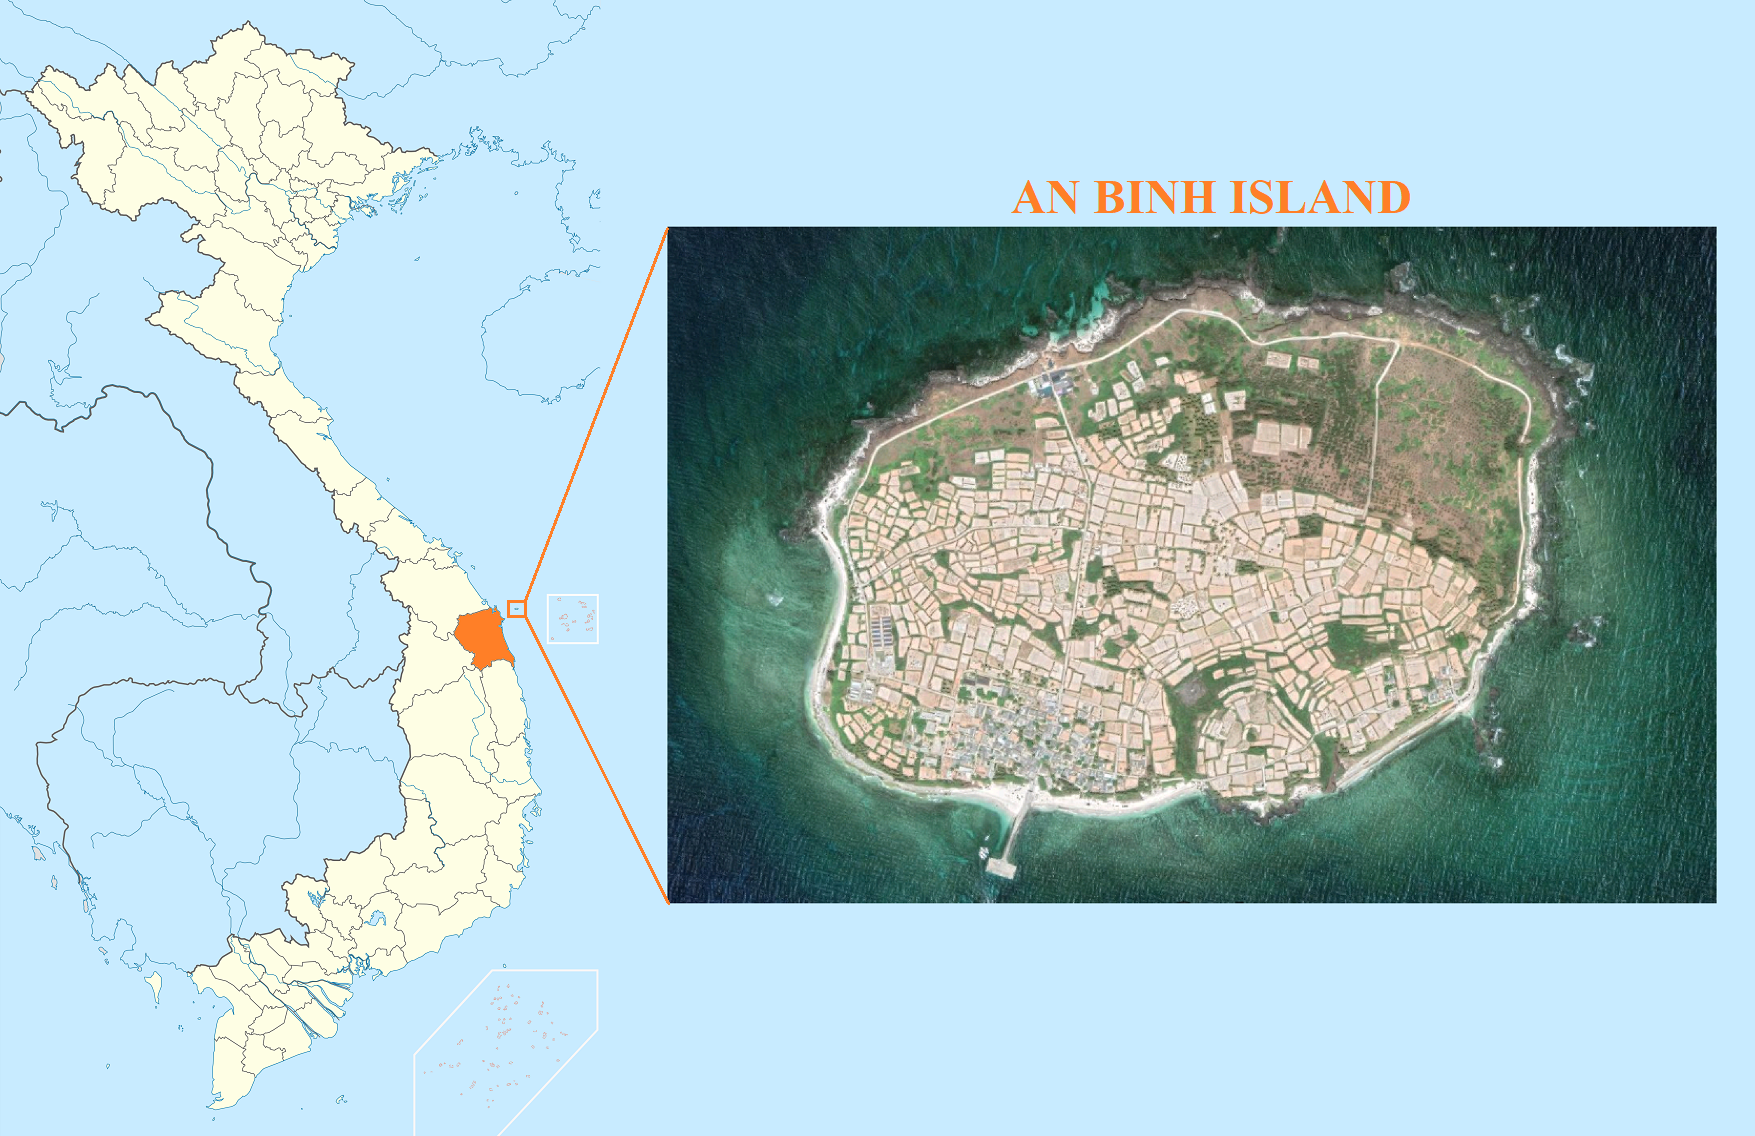
Figure 1.
An-Binh Island map [29,30].
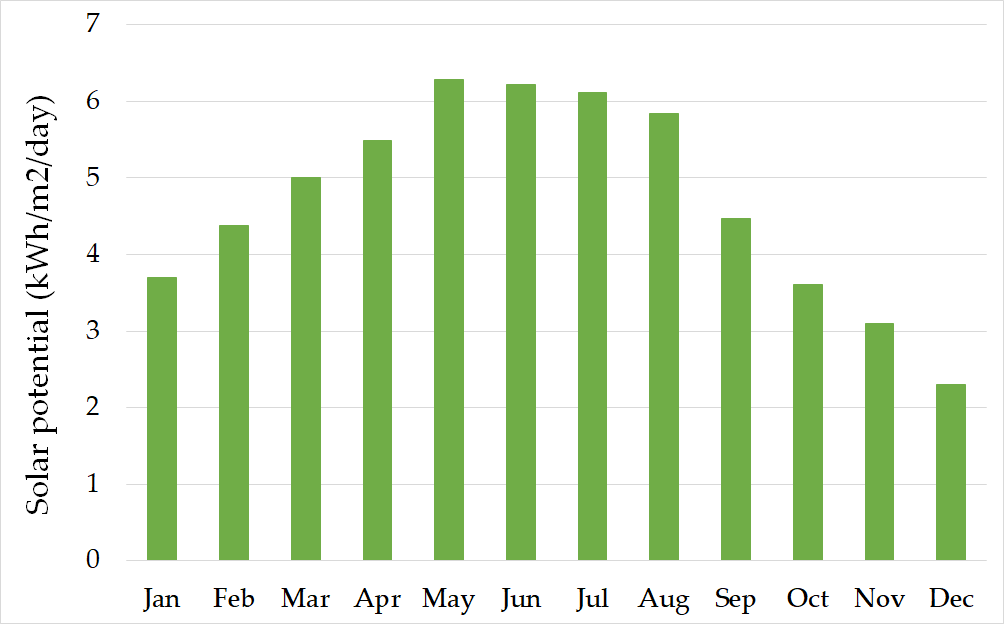
Figure 2. An-Binh power grid in NEPLAN software [34].
Solar potential on An-Binh Island [32,33].
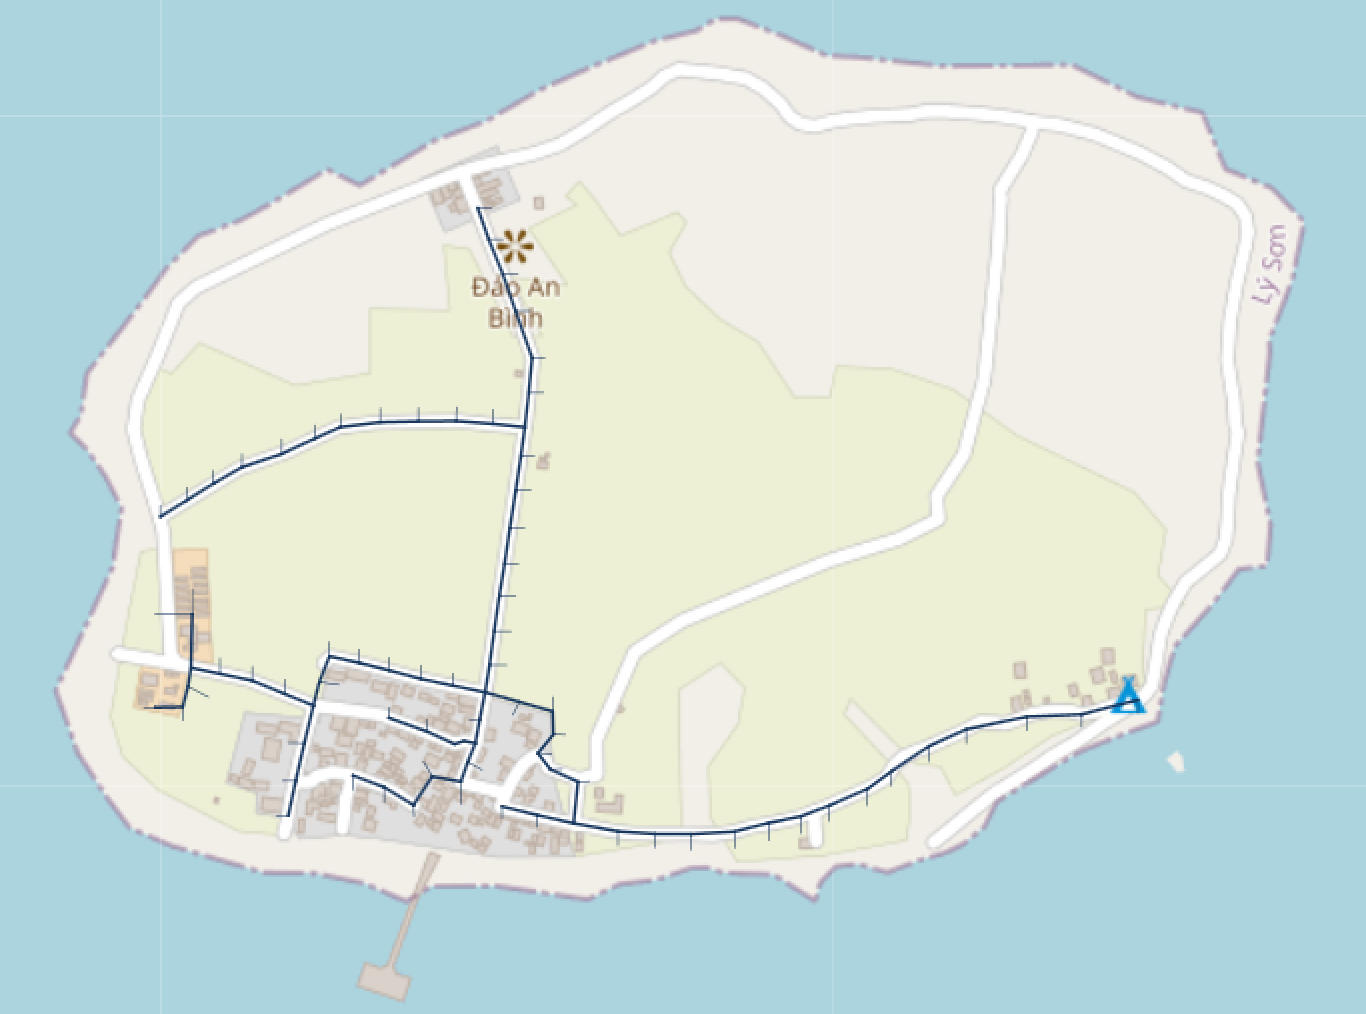
Figure 3. An-Binh power grid in NEPLAN software [34].
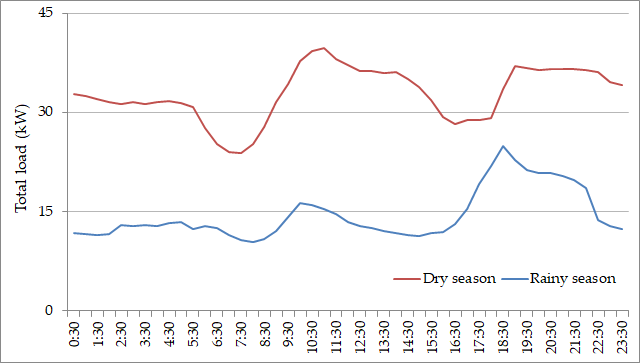
Figure 4. Daily consumption in dry and rainy seasons on An-Binh Island [34].
3. PMateroposeials and Methods
3.1. Proposed Methods
Power systems are often characterized by uncertainty in the processes of generation, transmission, and consumption [35][36][37][35–37], especially in the context of the high penetration of RES today [1][38][1,38]. Therefore, findings instochastic models are often chosen to describe and predict their behaviors [39,40], and one of the most popular models is the Monte Carlo [37,41]. This model enables researchers to observe and evaluate the behavior of networks through analogous models with transition [35][36][39][40][41][42]states that approximate reality. In this approach, they are often embedded in modern network computing programs, including the NEPLAN environment [11].
In addition, the findings in [35,36,42–45] also suggest several models for determining the electricity security of a network (Table 1). Among themThe first two models, energy system/power market and power system/market, typically represent supply–demand equilibrium in the medium and long term and are intended to be used for planning or policy making. In contrast, the models of static and dynamic power systems detail the components of a network with endogenous factors/variables toward ensuring the operational security of the infrastructure. The timeframes of these models are usually short-term periods, as in a static model, or very short-term periods, as in a dynamic model.
As mentioned at the beginning of this study, given the characteristics of these models and our approach to infrastructure operational security in the short term, static and dynamic models are interesting options for the An-Binh power grid (Figure 3Figure 5). These models could show the ability of a network to overcome disturbances and return to the normal operating state, as well as represent problems related to the reliability of the system such as power losses or voltage drops.
In this study, a static model was designed based on hourly data, and a dynamic model was embedded in this static model and surveyed with a time frame of several tens of seconds. The electrical value chains examined in the static model were power flows on lines and voltage profiles at nodes, while those in the dynamic model were the responses of frequency and voltage of the system in the face of disturbances. The results obtained were used to evaluate the stability and security of the existing system. Furthermore, these results were also analyzed and compared to choose the most optimal structure for the power mix of the system.
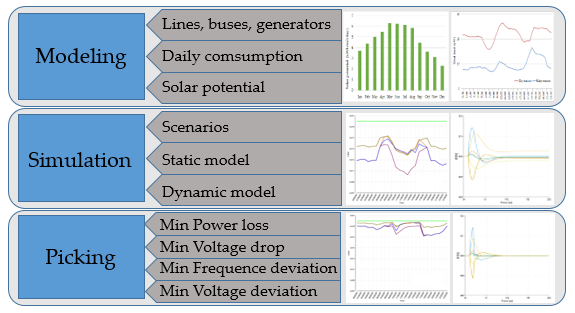 Table 1. Summary on models related to electricity security [35,36,42–45].
time ; and are the reliabimaximum and minimum voltage of DG under the local grid code; is the total number of DG units of the network.
3.2. Scenario Development
Returning to the question posed at the beginning of this study, these scenarios were designed to understand the behavior of the existing An-Binh power grid in the issues of static and dynamic security for stakeholders that may better itymprove the grid in reality.
In theory, it tand vulnerakes 8760 h to observe and check the responsiveness of the grid in a year, but not all these hours are essential [50,51]. Some operation modes at certain hours could highlight critical issues. If in these hours, no operating constraint violations occur, the grid can accommodate the remaining times as well.
Regarding the demand, the An-Binh grid reaches a peak load on Friday in May and a bottom load on Sunday ility on December. Regarding the supply, the An-Binh grid is powered by diesel generators and solar PV systems, in which solar potential is the best in May and the lowest in December.
Based on the above analysis, in order to evaluate the reliability and vulnerability of the An-Binh grid to extreme conditions, 24 h of a peak-load day in May and a bottom-load day in December were selected for simulation in this study. Besides that, two different sizes and locations of the generation mix (PV systems and diesel generators) were identified and simulated on both of the dates mentioned above. For the selected locations, location (1) was sited at the current site of the generation mix, while location (2) was another option for this mix and was located at the point of direct connection to other main branches of the system. For the selected sizes, the scale of 96 kWp solar and 74 kW diesel is the current size of the generation mix, and the other scales were assumed for both solar and diesel in order to determine the operational security of the system at a lower cost. The scenario without PV systems, scenario S1, was added as an important option to better define the impact of these systems on other components in the grid.
Table 2 and Figure 6 show the scenarios designed for these simulations.
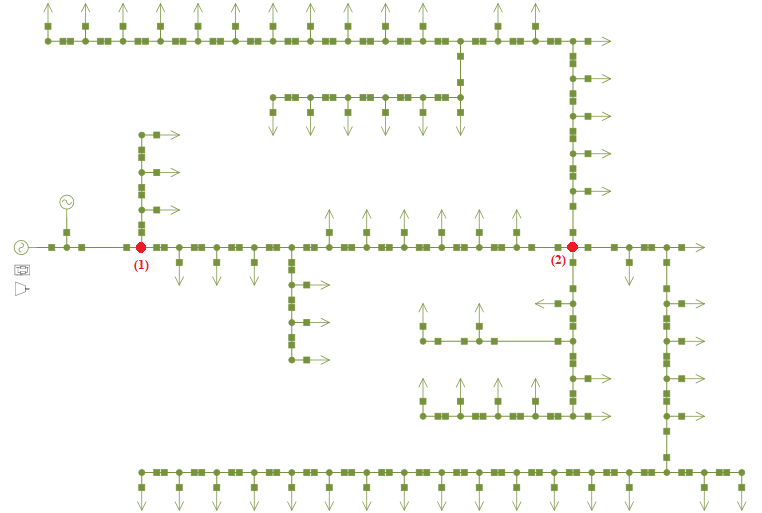
Figure 6. Diagram of the An-Binh grid in NEPLAN software.
Table 2. Summary of scenarios for the An-Binh grid.
(i/33) in all scenarios.
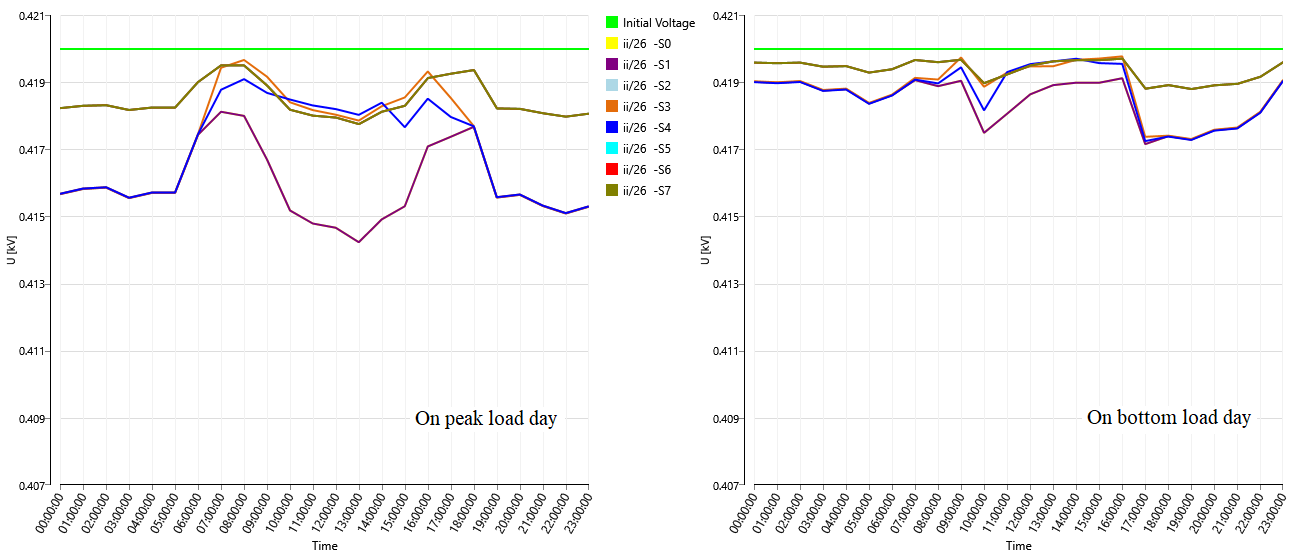
Figure 11. Voltage profiles at the northernmost node (ii/26) in all scenarios.
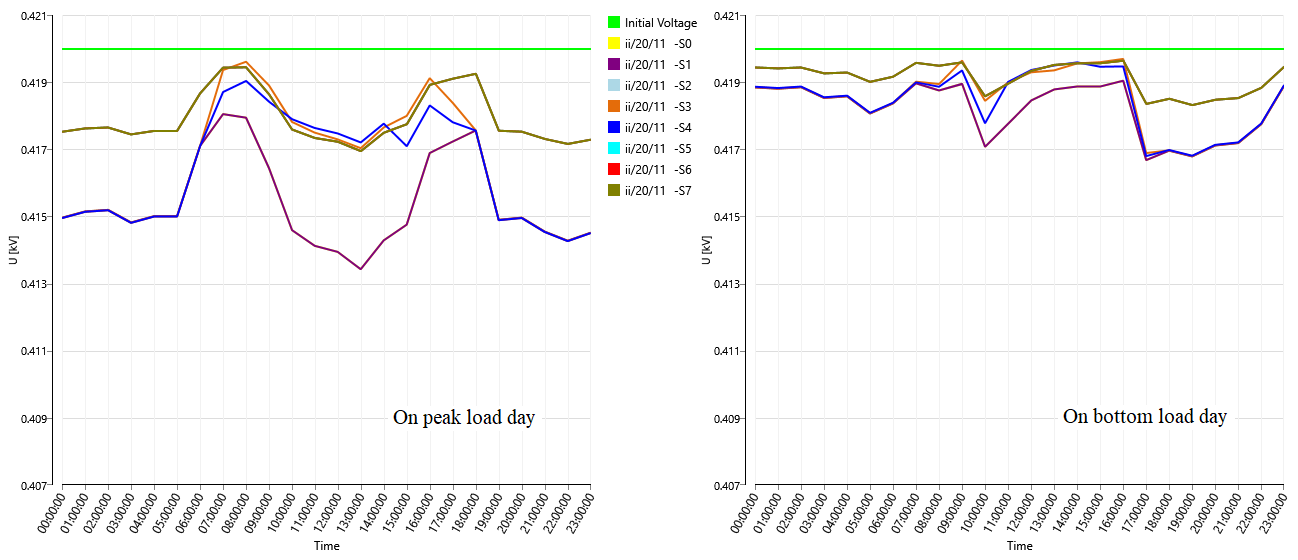
Figure 12. Voltage profiles at the westernmost node (ii/20/11) in all scenarios.
The voltage profiles in scenarios S0 and S1 were the worst, while the best profiles were observed in scenarios S2, S5, S6, and S7. In scenarios S0 and S1, the voltage at the furthest nodes dropped from 1% to 2% of the initial value on the days mentioned above. In scenario S3 (the scenario with the highest loss), the voltage profile was even better than scenario S0 on both of the two days simulated due to the presence of PV systems at the central point of the grid in location (2). Placing the entire generation units at location (2) with a reasonable generation capacity, as in scenarios S2, S5, S6, and S7, also contributed to a significant improvement in the voltage profiles at these nodes.
4.2.2. Analysis for Dynamic Security
Dynamic analysis was studied to consider the ability to restore and maintain the stability of the An-Binh power grid against threats, including transient and severe disturbances [35,54]. These threats consisted of short circuits in buses connected to diesel generators for a few seconds and sudden power outages from PV systems due to the absence of sunlight for several hours.
Transient Disturbance
The ability to maintain the synchronism of the An-Binh power grid after a transient disturbance was investigated. This disturbance came from short-circuit faults in a few seconds at the connection buses with diesel generators before any protective systems were available.
The results show that the frequency and voltage deviated from the initial value in this incident in all scenarios, including before and after protection systems were activated (Figures 13–16).
Before the intervention of protection systems, the frequency and voltage of the grid could not be restored to the initial value (Figure 13). In most scenarios, however, they restored themselves to the values within a narrow range of the initial state, with the exception of scenarios S3 and S7. After 10 s from the fault, the voltage in scenarios S3 and S7 was maintained at a deviation level from the initial value ranging from 26% to 40%, while the frequency deviation was around 0.5%. The best recovery of frequency and voltage belonged to scenario S5 with a difference of only 0.06% and 2.1%.
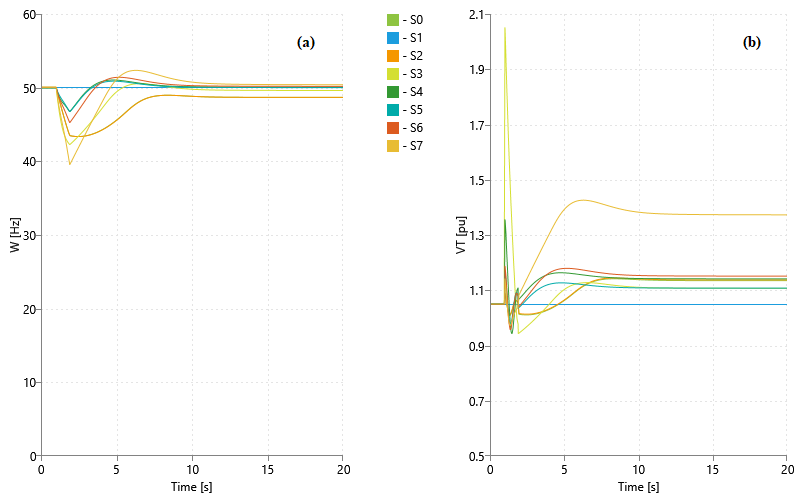
After the fault was cleared, only the frequency in all scenarios could be restored to the initial state within the time specified by the Vietnamese grid code [52,53], while the recovery of the voltage was more difficult depending on the duration of the event (Figures 14–16).
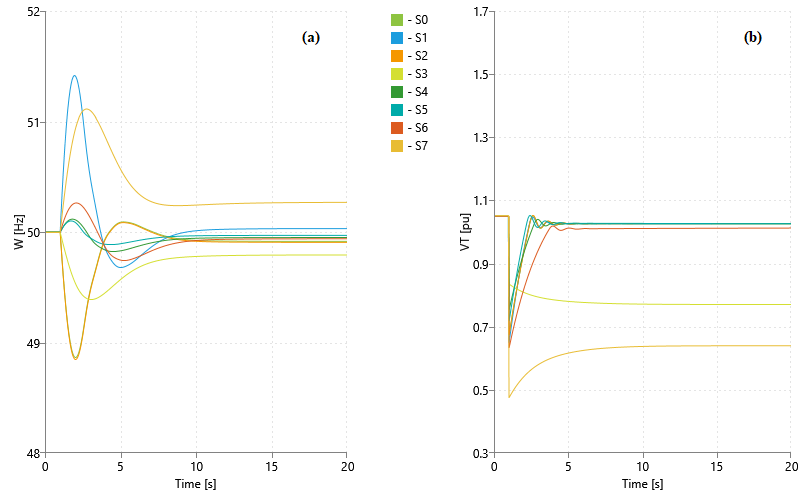
Figure 13. Frequency (a) and voltage (b) responses without fault clearance in all scenarios.
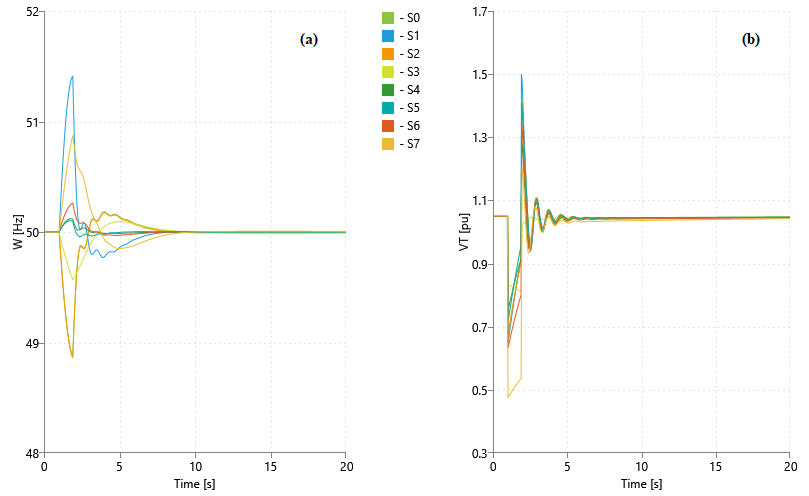
Figure 14. Frequency (a) and voltage (b) responses for 1 s before fault clearance in all scenarios.
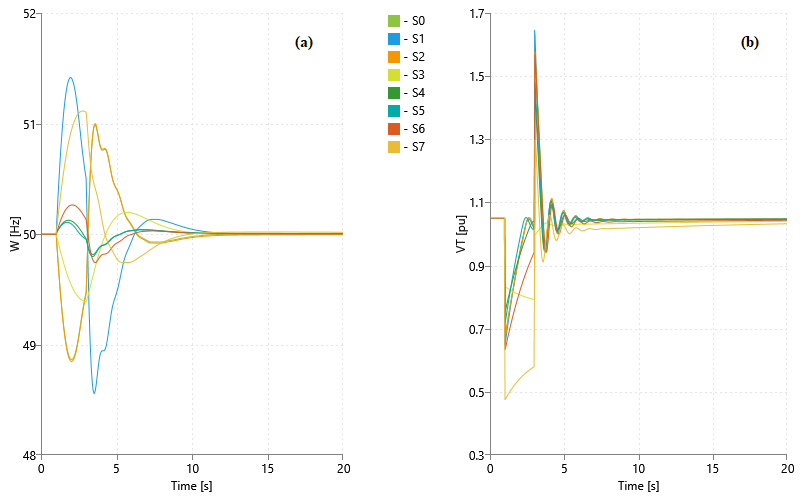
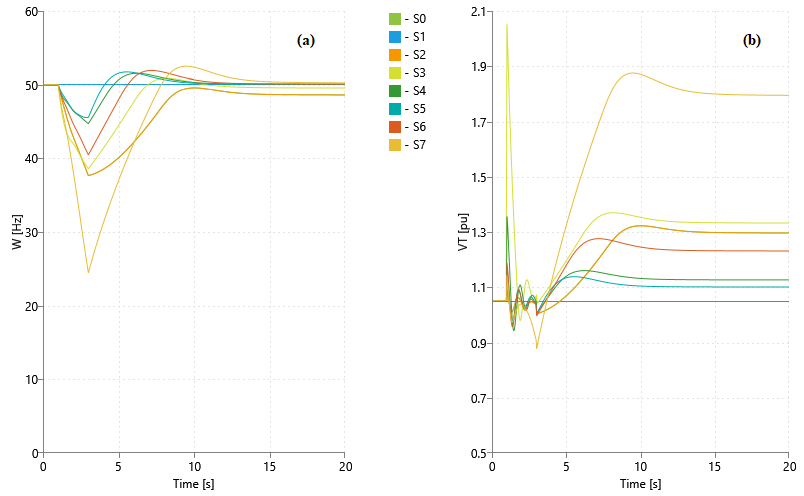
Figure 15. Frequency (a) and voltage (b) responses for 2 s before fault clearance in all scenarios.
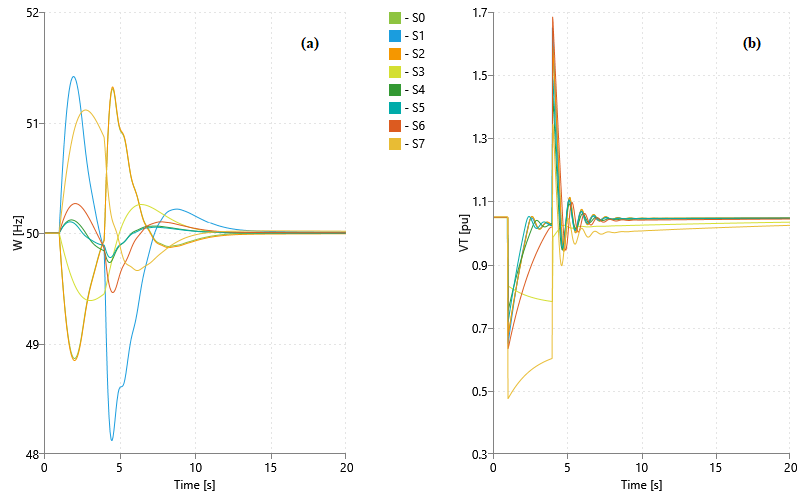
Figure 16. Frequency (a) and voltage (b) responses for 3 s before fault clearance in all scenarios.
Regarding frequency stability after fault clearance, the frequency fluctuatiow the scenarios desin margin in scenario S1 was the worst, with 3% to 4% before converging to the rated value, while this margin in scenarios S4 and S5 was the smallest, with less than 0.5%. Nevertheless, all these oscillations were cleared in around 10 s after the protection system went live.
Regardined for these simulationsg voltage stability after fault clearance, the voltage recovery in this fault depended on how long the fault occurred before the protection system was activated. The voltage stability was perfect for all scenarios according to the Vietnamese grid code [52,53] when the fault was cleared after 1 s, but this could be completely broken for scenarios S3 and S7 at the 3 s fault clearance time. For the 2 s fault clearance time, the voltage in most scenarios recovered to the initial state within the time allowed in the Vietnamese grid code [52,53], while this was not possible in scenario S7 or did not recover perfectly in scenario S3. For the 1 s fault clearance time, scenarios S1, S6, and S7 were the worst, with voltage fluctuation margins ranging between 40% and 55% of the initial value, whereas this margin was the best in scenarios S3 and S4 with 23% and 28%. For the 3 s fault clearance time, scenarios S3 and S4 were still the best, with voltage deviations around 30% of the initial value; by contrast, in other scenarios, these values all increased to 60%. However, the voltage in scenario S3 was not able to recover to the initial state as in scenario S4.

Severe Disturbance
The ability to stabilize the frequency and voltage of the An-Binh grid was considered under a severe fault in several hours. This fault came from a sudden power outage from PV systems due to the absence of sunlight and led to an imbalance of active power between supply and demand.
The results show that the frequency of this grid was completely unbalanced in all scenarios before generating active power at the set point of diesel generators (Figures 17–19). However, the voltage recovery of the network in all scenarios was better than that after the activation of diesel generators. The activation time of the diesel generators surveyed in this study was 1 s and 2 s after the fault had occurred.
Before the activation of diesel generators, the frequency and voltage of the system completely deviated from the initial value and could not be restored to the initial value for the first 10 s (Figure 17). After 20 s from fault, only the frequency in scenarios S4 and S5 could be maintained at a difference of around 2.5% of the initial state, whereas the voltage deviation in scenario S5 was the best with 0.2%, and it was 0.5% in scenario S4. Scenario S7 was the worst in terms of both voltage and frequency imbalances, with deviations of up to 32% and 90%.
After the activation of diesel generators, the frequency in most scenarios could be restored to the values within the narrow range specified in the Vietnamese grid code [52,53], whereas this was not possible for the voltage recovery (Figures 18 and 19).
For the frequency stability after the activation of diesel generators, the frequency fluctuation margin in scenarios S0 and S2 was the worst, with nearly 3% of the rated value, whereas this margin was the best in scenario S5 with only 0.1%, and it was 0.2% in scenarios S4 and S6. Nevertheless, the stability time of all these frequencies was different depending on when the diesel units were activated: the earlier the activation, the sooner the stability.
For the voltage stability after the activation of diesel generators, the voltage deviation in scenario S7 was the worst, ranging between 30% and 70% from the initial value depending on the activation time, whereas this was the best in scenario S5 with about 5% for both 1 s and 2 s diesel activation times after fault. This difference in other scenarios was nearly 10% with the 1 s activation time but increased to more than 20% when the activation time was 2 s after fault, except for scenario S4, with around 8% for both experiments.
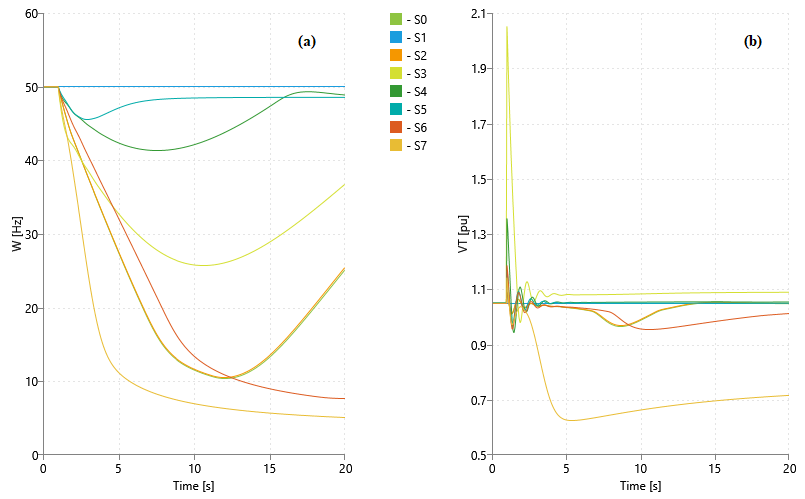
Figure 417. Diagram of the An-Binh grid in NEPLAN software.
Frequency (a) and voltage (b) responses without activating diesel units in all scenarios.
TablFigure 18. Summary of scenarios for the An-Binh grid.
Frequency (a) and voltage (b) responses in 1 s before activating diesel units in all scenarios.
|
Scenario |
Location |
PV Systems |
Diesel Generators |
|
S0 (baseline) |
(1) |
96 kWp |
74 kW |
|
S1 |
(1) |
- |
74 kW |
|
S2 |
(2) |
96 kWp |
74 kW |
|
S3 |
(1) |
- |
74 kW |
|
(2) |
96 kWp |
- |
|
|
S4 |
(1) |
- |
74 kW |
|
(2) |
48 kWp |
- |
|
|
S5 |
(2) |
48 kWp |
74 kW |
|
S6 |
(2) |
48 kWp |
50 kW |
|
Model |
Function |
Time Horizon |
|
|
Energy system/power market |
Focuses on the energy/electricity security dimension of a country/region, including infrastructure, energy resources, markets, and regulations. Providing simplified descriptions of the components in the system/market. |
Years to Decades |
|
|
Power system/market |
Focuses on the supply–demand balance, and simplified the components of the system, including infrastructure, energy sources, related markets, and regulations. Providing simplified descriptions of the components in the system/market. |
Months to Years |
|
|
Static power system/network |
Focusing on the reliability of infrastructure dimension, modeled as endogenous factors/variables in the electricity value chain. Providing detailed descriptions of components in the system/network. |
Hours to Months |
|
|
Dynamic power system/network |
Focusing on the vulnerability of infrastructure dimension, modeled as endogenous factors/variables in the electricity value chain. Providing detailed descriptions of components in the system/network. |
Seconds to Minutes |
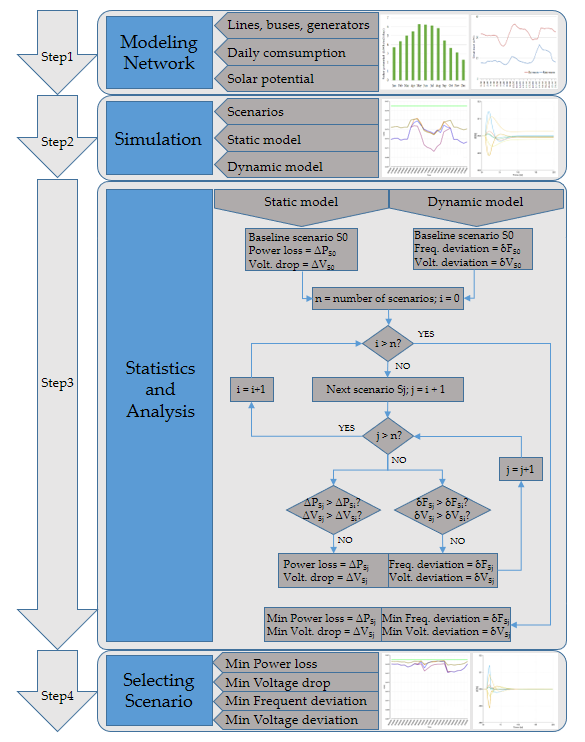
Figure 35. Flowchart of the method proposed.
Flowchart of the method proposed.
The quantities in terms of power flow and voltage could be determined according to Equations (1)–(5) [35,36].
S7 | ||
(2) | ||
48 kWp | ||
25 kW | ||
|
|
(1) |
|
|
|
(2) |
|
|
|
(3) |
|
|
|
(4) |
|
|
(5) |
where and are the real and reactive power transmitted from node to ; and are the voltages at nodes and ; is the conductivity of the line between nodes and ; and are the angles of and at nodes and ; is the complex angle of ; and are the total real and reactive power losses; is the voltage drop during transfer power from node to ; is the set of lines from node to ; is the total number of buses of the network.
Stability problems (synchronous, voltage, or frequency) could be investigated according to the following Equations (6) and (7) [35,36,45,46].
|
|
(6) |
|
(7) |
where and are the vectors of differential–algebraic constraints of the real and reactive powers; is a vector of the loading factors; is a vector of the bus voltage angles; and is a vector of the bus voltage magnitudes. The starting point for stability analysis is usually the power flow, and the initial values of or are determined by 0.
Thereby, at the point of voltage collapse, the deviations of voltage angle and magnitude are represented in Equations (8)–(10) [35,36,45,46]
|
|
(8) |
|
with |
(9) |
|
with |
(10) |
where , , , and are the deviations in the real and reactive powers, voltage angles, and magnitudes, respectively; is the Jacobian matrix.
In this study, PV systems acted as order to ene of the instability factors in the system, and the constraints were defined according to the following equations and inequalities (11)–(13) [35,36,47–49]:
|
|
(11) |
|
(12) |
|
|
(13) |
where is the power output of DG using fuel f at time ; is the total demand at time ; is the operation time of DG by time ; is the energy corresponding to the fuel reserve limit of DG for power generation; and are the maximum aluate nd minimum power output of DG after deducting self-use and backup; is the voltage of DG using fuel f at
|
Scenario |
Location |
PV Systems |
Diesel Generators |
|
S0 (baseline) |
(1) |
96 kWp |
74 kW |
|
S1 |
(1) |
- |
74 kW |
|
S2 |
(2) |
96 kWp |
74 kW |
|
S3 |
(1) |
- |
74 kW |
|
(2) |
96 kWp |
- |
|
|
S4 |
(1) |
- |
74 kW |
|
(2) |
48 kWp |
- |
|
|
S5 |
(2) |
48 kWp |
74 kW |
|
S6 |
(2) |
48 kWp |
50 kW |
|
S7 |
(2) |
48 kWp |
25 kW |
4. Simulation and Results
4.1. Simulation Process
As discussed in the Methods section, models of the static and dynamic systems were used to analyze the reliability and vulnerability of the An-Binh grid (Figure 5). The parameters of the real An-Binh network were set for the generators, lines, and loads in the simulated grid. The operation of this grid complies with the Vietnamese grid code [52,53], in which the voltage and frequency are allowed to fluctuate within ±5% and ±2% of the rated values, respectively. In the event of disturbances, the recovery criteria for voltage and frequency could be considered following Equations (14) and (15) [52,53].
|
with t < 10 s after fault clearance |
(14) |
|
with t < 30 min after fault clearance |
(15) |
where and are the voltage and frequency of the component in % of the rated values and .
As a matter of fact, power losses and voltage drops are inevitable in any network, and disturbances could appear at any time due to the constant variation in supply and demand. For this reason, voltage profiles at all nodes and power losses (real and reactive power) on all lines were considered in all of the above scenarios. In addition, the voltage and frequency resilience of the simulated grid was also tested against several disturbances, including transient and severe faults. As a result, a scenario with the lowest losses was chosen as the optimal solution for the An-Binh grid. NEPLAN software [11] was used to simulate and analyze the models in this study.
4.2. Simulation Results
4.2.1. Analysis for Static Security
Static analysis was studied to examine the ability of the An-Binh infrastructure to balance supply and demand on typical extreme days, including peak-load and bottom-load days [35,36,42]. This analysis was also used to determine the energy losses in this grid and voltage profiles at each bus in all scenarios.
Energy Losses
Figures 7 and 8 below show the simulated results of the energy losses on the days mentioned in all scenarios. The average losses of reactive and real power on the peak-load day were from 3 to 8 times higher than on the bottom-load day. These losses in scenario S3 were the highest, over 20 times higher than the baseline scenario (S0). The energy losses in scenarios S2, S5, S6, and S7 were the lowest with the generation mix at the same location (2) despite the difference in the total installed capacity. The energy losses in scenarios S0 and S1 were similar to that of the generation mix at location (1), even with the addition of PV systems in scenario S0. This was the same for scenarios S2 and S5 with the generation mix at the same location (2), while these losses in scenarios S3 and S4 were significantly different when dispersing the generation units at different locations.
Moreover, the worst losses in all scenarios occurred on the lines directly connected to these generation units (Figure 9). For both peak-load and bottom-load days, the power flows in scenario S3 reached the operating limit of these lines during the time when solar power was injected into the grid, while in scenario S4, they ranged from 30% to 50%. However, these lines only operated at around 10% of their capacity in the remaining scenarios.
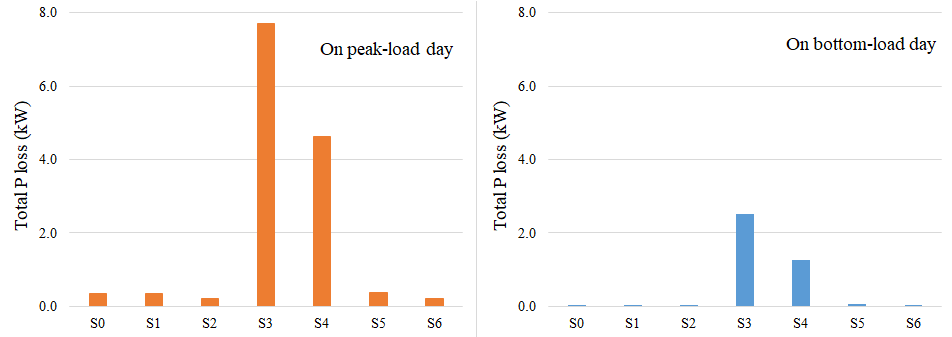
Figure 7. Total average real energy losses in all Scenarios.
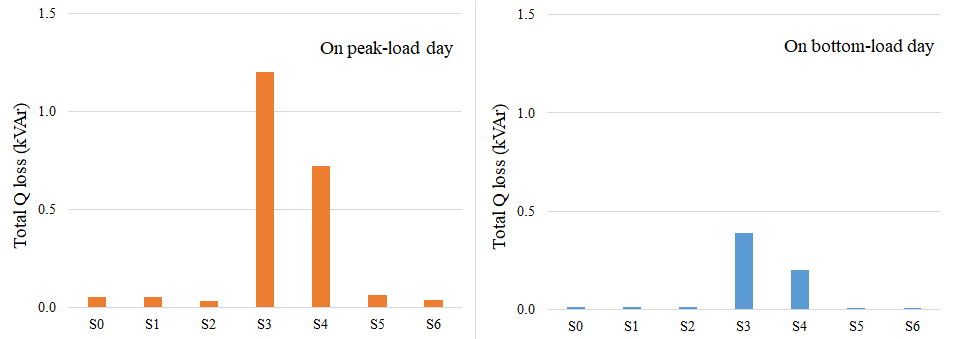
Figure 8. Total average reactive energy losses in all Scenarios.
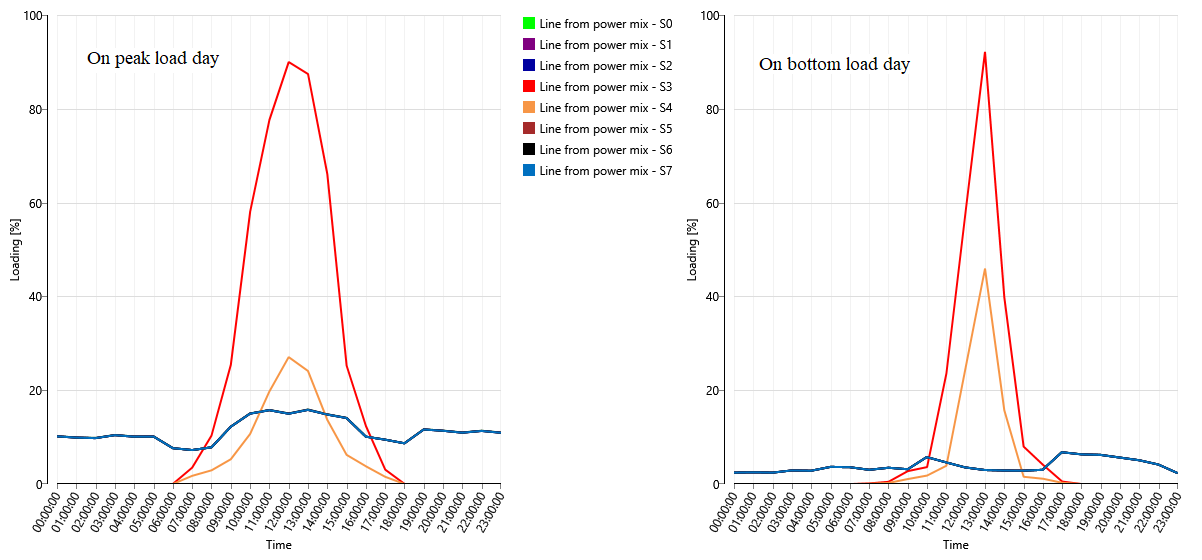
Figure 9. Loading on the lines connected to generation units in all Scenarios.
Voltage Drop
As a common phenomenon in networks, the voltage drop occurs during the power transfer across long lines. In the An-Binh power grid, voltage profiles at some of the most remote nodes were also considered on the year’s peak- and bottom-load days (Figures 10–12).
Regarding the simulation results, the voltage drop, as expected, on the peak-load day was deeper than the bottom-load day in all the scenarios but still within the acceptable range of the Vietnamese grid code [52,53]. At the same node, the voltage drop during the peak load hours was steeper than during off-peak hours for both peak- and bottom-load days. Moreover, the voltage profiles at the easternmost node (i/33) was lower than that of the northernmost and westernmost nodes (ii/26 and ii/20/11).
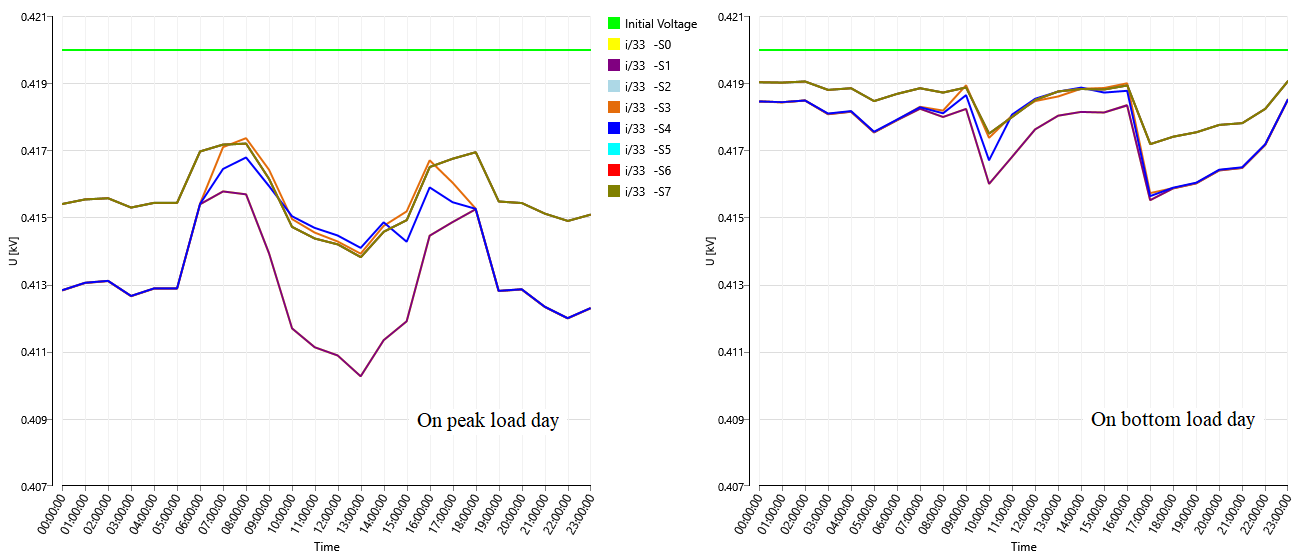
Figure 10. Voltage profiles andt the easternmost node Figure 19. Frequency (a) and voltage (b) responses in 2 s before activating diesel units in all scenarios.
45. Critical ContributDiscussions
It is self-evident that the ability to match demand reflects the generation adequacy of the An-Binh grid at the reference time [43][55]. The results show that the An-Binh grid completely meets the current demand of the island community, even with excess capacity up to double the needs during peak hours of the summer peak day. The power loss on lines and the voltage profile at nodes are still within the allowable range of the Vietnamese grid code but not the best solution for the current system.
Solar PV systems integrated into this grid allowed for a reduction in power loss and improvement in the voltage profile at nodes, but not all locations or sizes could achieve that. The central location (2) seems to be the most adequate one and also the weakest point in the structure and operation of this system [44][45][46][56–58]. The structural weakness of this location refers to the potential for damage to the system when it is disconnected from other components in the grid, whereas its operational weakness focuses on the cascading faults of overload and overvoltage.
The findings in this study also suggest that location (2) is a good choice for the generation mix in improving the voltage profile at nodes but not for the power loss problem of the entire grid. In all the scenarios with PV systems linked at location (2), the voltage profile at nodes was improved compared with the PV systems connected at location (1), but this improvement was not significant between the simulated PV system sizes (scenarios S2 and S5, S3, and S4).
For the power loss, there was no difference between the two locations selected with the same size of PV systems (scenarios S0 and S2). Even the presence of PV systems at location (2) posed a loss challenge for the An-Binh grid, even as the losses in scenarios S3 and S4 were much higher than in the other scenarios. This problem is attributed to the incompatibility due to bidirectional power generation from DG units, diesel generators, and PV systems set at two different locations [4–6]. However, at the same location, the smaller the PV system size, the lower the total power loss (scenarios S3 and S4, S2, and S5). This also shows that the An-Binh grid could operate well, with a total generating capacity lower than the current capacity.
Besides the point indicated about the static security of the An-Binh grid, dynamic analysis on this grid once again confirmed the challenges of integrating RES into modern networks [4456–4658], specifically solar power here. The integration of PV systems increased An-Binh’s vulnerability to both transient and severe disturbances, and depending on the extent of PV production in the generation mix, the degree of this vulnerability was different.
In our experiments for the transient disturbances on the An-Binh grid, the presence of PV systems contributed to enhancing the resilience of the system from faults (scenarios S4 and S5), but they could also exacerbate the impact of these events on the system (scenarios S3 and S7). Moreover, the implementation of PV systems is considered to have a certain impact on the recovery time of networks [26]. These impacts were positive or negative depending on their size and location in this study in (scenarios S3 and S4, S5, and S7) in the 3 s fault clearance experiment. This also shows that smaller size and location (2) would be good options for PV systems, and protection systems should be established to clear short-circuit faults within a critical time of 1 s.
In our experiments considering the severe disturbances on the An-Binh grid, most of the scenarios with PV systems before fault clearance did not meet the frequency stability within the range specified in the Vietnamese grid code [47][48][52,53], while the voltage recovered better than in the fault-clearing experiments. The active power imbalance in this case seems to have caused the frequency of the grid to deviate completely from the rated value and lead to voltage instability due to fluctuations in the reactive power [26]. Scenario S7 was the worst for both the frequency and voltage stability of the system, whereas scenario S5 was the best in this study for ensuring dynamic security. The frequency and voltage responses after troubleshooting in scenarios S4 and S6 were also quite good but not in the remaining scenarios. These results once again show that choosing the right location and size for the power mix are very important to improve the resilience of the existing An-Binh grid.
Based on the experiments and analysis above, the best option for the current An-Binh grid would be scenario S5, in which the power mix of 48 kWp solar and 74 kW diesel is located at the grid center point. In addition, protection systems should be established to clear faults within a critical time of 1 s for ensuring the operational security of the system. Moreover, compared with the current An-Binh grid (scenario S0), scenario S6 with 48 kWp solar and 50 kW diesel is also a good option, as it could contribute to saving up to half the total investment cost for the power mix and reducing up to a third of emissions to the local environment [49][59].
56. Conclusions
This study contributes to the existing knowledge of the impact of solar PV systems on the operational security of isolated networks, here the An-Binh Island grid in Vietnam. The results show that the variable nature of solar power can exacerbate the problems of operational security on islanded networks, but these problems can be ameliorated by choosing the right location and size for PV systems.
The studies on static and dynamic models of the current An-Binh power grid are of benefit to stakeholders who may consider and apply these models for other isolated networks in practice. The static and dynamic security analyses in this study also contribute to the assessment of the reliability and vulnerability of these systems.
The evidence from this study suggests that the location and size of the current power mix are not the best options for the An-Binh grid. The adjustment of the size and location of the supply system is really necessary to achieve optimal and sustainable development for this system. However, this study is limited by the use of diesel power to ensure operational security for the current An-Binh power grid. Besides this limitation, the use of 100% renewable electricity with storage was not considered in this work.
For these reasons, these findings provide insights for the next steps in studies on the networks using 100% renewable electricity on Vietnam islands, including emission reduction and environmental protection. Moreover, further research regarding the impact of renewable power in isolated networks would be of great benefit in determining their potential for growth and expansion in off-grid areas in Vietnam.
References
- REN21. Renewables 2021. Global Status Report; REN21 Secretariat: Paris, France, 2021; ISBN 9783948393038.
- IEA. Renewables 2021-Analysis and Forecast to 2026; International Energy Agency: Paris, France, 2021.
- IEA. Renewable Energy Market Update—May 2022; International Energy Agency: Paris, France, 2022.
- Balamurugan, K.; Srinivasan, D.; Reindl, T. Impact of distributed generation on power distribution systems. Energy Procedia 2012, 25, 93–100. https://doi.org/10.1016/j.egypro.2012.07.013.
- Safigianni, A.S.; Koutroumpezis, G.N.; Poulios, V.C. Mixed distributed generation technologies in a medium voltage network. Electr. Power Syst. Res. 2013, 96, 75–80. https://doi.org/10.1016/j.epsr.2012.10.017.
- Sedighi, M.; Igderi, A.; Parastar, A. Sitting and sizing of distributed generation in distribution network to improve of several parameters by PSO algorithm. In Proceedings of the 2010 9th International Power and Energy Conference (IPEC 2010), Singapore, 27–29 October 2010; pp. 1083–1087. https://doi.org/10.1109/IPECON.2010.5696977.
- Naik, G.; Khatod, D.; Sharma, M. Optimal Allocation of Distributed Generation in Distributed Network. In Proceedings of the 2012 IACSIT Coimbatore Conferences, Shanghai, China, 27–29 March 2012; Volume 28, pp. 42–46.
- Injeti, S.K.; Kumar, N.P. Optimal Planning of Distributed Generation for Improved Voltage Stability and Loss Reduction. Int. J. Comput. Appl. 2011, 15, 40–46. https://doi.org/10.5120/1910-2545.
- Parizad, A.; Khazali, A.; Kalantar, M. Optimal placement of distributed generation with sensitivity factors considering voltage stability and losses indices. In Proceedings of the 2010 18th Iranian Conference on Electrical Engineering, ICEE 2010, Isfahan, Iran, 11–13 May 2010; pp. 848–855. https://doi.org/10.1109/IRANIANCEE.2010.5506959.
- Reddy, S.C.; Prasad, P.V.N.; Laxmi, A.J. Power quality and reliability improvement of distribution system by optimal number, location and size of DGs using Particle Swarm Optimization. In Proceedings of the 2012 IEEE 7th International Conference on Industrial and Information Systems, ICIIS 2012, Chennai, India, 6–9 August 2012. https://doi.org/10.1109/ICIInfS.2012.6304840.
- Viral, R.; Khatod, D.K. Optimal planning of distributed generation systems in distribution system: A review. Renew. Sustain. Energy Rev. 2012, 16, 5146–5165. https://doi.org/10.1016/j.rser.2012.05.020.
- Jamian, J.J.; Mustafa, M.W.; Mokhlis, H.; Abdullah, M.N. Comparative study on Distributed Generator sizing using three types of Particle Swarm Optimization. In Proceedings of the 3rd International Conference on Intelligent Systems Modelling and Simulation, ISMS 2012, Kota Kinabalu, Malaysia, 8–10 February 2012; pp. 131–136. https://doi.org/10.1109/ISMS.2012.71.
- Ameri, A. Al; Nichita, C.; Riouch, T.; El-Bachtiri, R. Genetic Algorithm for optimal sizing and location of multiple distributed generations in electrical network. In Proceedings of the International Conference on Modern Electric Power Systems, MEPS 2015, Wroclaw, Poland, 6–9 July 2015. https://doi.org/10.1109/MEPS.2015.7477194.
- Moradi, M.H.; Abedini, M. A combination of genetic algorithm and particle swarm optimization for optimal DG location and sizing in distribution systems. Int. J. Electr. Power Energy Syst. 2012, 34, 66–74. https://doi.org/10.1016/j.ijepes.2011.08.023.
- Shaaban, M.; Petinrin, J.O. Sizing and siting of distributed generation in distribution systems for voltage improvement and loss reduction. Int. J. Smart Grid Clean Energy 2013, 2, 350–356. https://doi.org/10.12720/sgce.2.3.350-356.
- Prime Minister. Decision 1855/QD-TTg of Approving Vietnam’s National Energy Development Strategy up to 2020, with Vision to 2050; Vietnam Government: Hanoi, Vietnam, 2007.
- Prime Minister. Decision 1208/QD-TTg Dated July 21, 2011 of Approving the National Master Plan for Power Development in the 2011–2020 Period, with Considerations to 2030; Vietnam Government: Hanoi, Vietnam, 2011.
- Prime Minister. Decision 428/QD-TTg of Approval of the Revised National Power Development Master Plan for the 2011–2020 Period with the Vision to 2030; Vietnam Government: Hanoi, Vietnam, 2016.
- Prime Minister. Decision 2068/QD-TTg of Approving the Viet Nam’s Renewable Energy Development Strategy up to 2030 with an Outlook to 2050; Vietnam Government: Hanoi, Vietnam, 2015.
- Prime Minister. Resolution 36-NQ/TW of the 8th Conference of the 12th Central Steering Committee of the Communist Party on Strategy for Sustainable Development of Vietnam’s Ocean Economy by 2030, with Visions towards 2045; Vietnam Government: Hanoi, Vietnam, 2018.
- Prime Minister. Resolution 26-NQ/TW of Promulgating the Government’s Master Plan and 5-Year Plan to Implement Resolution 36-NQ/TW of the 8th Conference of the 12th Party Central Committee on the Sustainable Development Strategy Sustainable Marine Economy of Vietnam to 20; Vietnam Government: Hanoi, Vietnam, 2020.
- Prime Minister. Decision 2081/QD-TTg of Approving the Program on Electricity Supply in Rural, Mountainous and Island Areas in Period of 2013–2020; Vietnam Government: Hanoi, Vietnam, 2013.
- EVNCPC Solar Power Plant on An-Binh Island. Available online: https://cpc.vn/vi-vn/Tin-tuc-su-kien/Tin-tuc-chi-tiet/articleId/34681 (accessed on 20 March 2022).
- Dung, N.T. Economic development of sea-island tourism attached to the assurance of defense and security in the current context of integration. Sci. Technol. Dev. 2016, 19, 20–27.
- MoIT. The Draft of Vietnam National Power Development Plan Period 2021–2030, Vision to 2045; Ministry of Industry and Trade: Hanoi, Vietnam, 2022.
- IRENA. Transforming Small-Island Power Systems. Technical Planning Studies for the Integration of Variable Renewables; International Renewable Energy Agency: Abu Dhabi, United Arab Emirates, 2019; ISBN 978-92-9260-074-7.
- Tran, Q.T.; Davies, K.; Sepasi, S. Isolation Microgrid Design for Remote Areas with the Integration of Renewable Energy: A Case Study of Con Dao Island in Vietnam. Clean Technol. 2021, 3, 804–820. https://doi.org/10.3390/cleantechnol3040047.
- Nguyen, V.T.; Hoang, D.H.; Nguyen, H.H.; Le, K.H.; Truong, T.K.; Le, Q.C. Analysis of Uncertainties for the Operation and Stability of an Islanded Microgrid. In Proceedings of the 2019 International Conference on System Science and Engineering, ICSSE 2019, Dong Hoi, Vietnam, 20–21 July 2019; pp. 178–183. https://doi.org/10.1109/ICSSE.2019.8823105.
- VNM. Administrative Map of Quang Ngai Province in 2022. Available online: https://bandovietnam.com.vn/ban-do-tinh-quang-ngai (accessed on 18 February 2022).
- People’s Committee. Decision 89-QD-UBND of Approving the 2017 Land Use Planning of the Ly Son Island District; People’s Committee of Quang Ngai Province: Ly Son, Vietnam, 2017.
- MPI. Natural-Economic-Social Conditions in Quang Ngai Province. Available online: https://www.mpi.gov.vn/Pages/tinhthanhchitiet.aspx?idTinhThanh=31#tabs1 (accessed on 24 March 2022).
- WB Group Solar Resource Maps for More than 200 Countries on the World. Available online: https://solargis.com/maps-and-gis-data/download (accessed on 18 May 2022).
- Polo, J.; Martínez, S.; Fernandez-Peruchena, C.M.; Navarro, A.A.; Vindel, J.M.; Gastón, M.; Ramírez, L.; Soria, E.; Guisado, M.V.; Bernardos, A.; et al. Maps of Solar Resource and Potential in Vietnam; Vietnam Ministry of Industry and Trade: Hanoi, Vietnam, 2015.
- MoIT. Decision 4813/QD-BCT on the Approval of the Quang-Ngai Power Development Plan for the 2016–2025 Period with the Vision to 2035; Vietnam Ministry of Industry and Trade: Hanoi, Vietnam, 2016.
- Saadat, H. Power System Analysis; Mc Graw-Hill: Singapore, 1999; ISBN 00701167587.
- Kundur, P. [Prabha Kundur] Power System Stability and Control; McGraw-Hill Education: New York, NY, USA, 2005; ISBN 9780070359581.
- Allan, R.; Billinton, R. Probabilistic assessment of power systems. Proc. IEEE 2000, 88, 140–162. https://doi.org/10.1109/5.823995.
- REN21. Renewables 2020. Global Status Report; REN21 Secretariat: Paris, France, 2020; ISBN 978-3-9818911-7-1.
- Foley, A.M.; Ó Gallachóir, B.P.; Hur, J.; Baldick, R.; McKeogh, E.J. A strategic review of electricity systems models. Energy 2010, 35, 4522–4530. https://doi.org/10.1016/j.energy.2010.03.057.
- Aien, M.; Hajebrahimi, A.; Fotuhi-Firuzabad, M. A comprehensive review on uncertainty modeling techniques in power system studies. Renew. Sustain. Energy Rev. 2016, 57, 1077–1089. https://doi.org/10.1016/j.rser.2015.12.070.
- Rei, A.M.; Schilling, M.T.; Melo, A.C.G. Monte Carlo simulation and contingency enumeration in bulk power systems reliability assessment. In Proceedings of the 2006 9th International Conference on Probabilistic Methods Applied to Power Systems, PMAPS, Stockholm, Sweden, 11–15 June 2006. https://doi.org/10.1109/PMAPS.2006.360222.
- Deane, J.P.; Gracceva, F.; Chiodi, A.; Gargiulo, M.; Gallachóir, B.P.Ó. Assessing power system security. A framework and a multi model approach. Int. J. Electr. Power Energy Syst. 2015, 73, 283–297. https://doi.org/10.1016/j.ijepes.2015.04.020.
- Bompard, E.; Huang, T.; Wu, Y.; Cremenescu, M. Classification and trend analysis of threats origins to the security of power systems. Int. J. Electr. Power Energy Syst. 2013, 50, 50–64. https://doi.org/10.1016/j.ijepes.2013.02.008.
- Johansson, J.; Hassel, H.; Zio, E. Reliability and vulnerability analyses of critical infrastructures: Comparing two approaches in the context of power systems. Reliab. Eng. Syst. Saf. 2013, 120, 27–38. https://doi.org/10.1016/j.ress.2013.02.027.
- Hatziargyriou, N.; Milanovic, J.; Rahmann, C.; Ajjarapu, V.; Canizares, C.; Erlich, I.; Hill, D.; Hiskens, I.; Kamwa, I.; Pal, B.; et al. Definition and Classification of Power System Stability—Revisited & Extended. IEEE Trans. Power Syst. 2021, 36, 3271–3281. https://doi.org/10.1109/TPWRS.2020.3041774.
- NASEM. Analytic Research Foundations for the Next-Generation Electric Grid; The National Academies Press: Washington, DC, USA, 2016; ISBN 9780309392310.
- Bompard, E.; Gao, C.; Masera, M.; Napoli, R.; Russo, A.; Stefanini, A.; Xue, F. Approaches to the Security Analysis of Power Systems: Defence Strategies against Malicious Threats; Office for Official Publications of the European Communities: Luxembourg, 2007.
- Duncan, R.A.; Seymore, G.E.; Streiffert, D.L.; Engberg, D.J. Optimal Hydrothermal Coordination for Multiple Reservoir River Systems. IEEE Power Eng. Rev. 1985, PER-5, 43. https://doi.org/10.1109/MPER.1985.5526581.
- Rudolf, A. A genetic algorithm for solving the unit commitment problem of a hydro-thermal power system. IEEE Trans. Power Syst. 1999, 14, 1460–1468. https://doi.org/10.1109/59.801929.
- Andriopoulos, N.; Georgantas, I.; Makrygiorgou, D.I.; Skipis, D.; Dikaiakos, C.; Moraitis, I.; Botsis, A.; Papadaskalopoulos, D. Coordinating Capacity Calculation via Electricity Market Coupling: Insights from the H2020 CROSSBOW Project. Electricity 2022, 3, 182–201.
- Han, X.; Bindner, H. Grid Modeling, Analysis and Simulation of Different Scenarios for a Smart Low-Voltage Distribution Grid. In Proceedings of the IEEE PES ISGT Europe 2013, Lyngby, Denmark, 6–9 October 2013. https://doi.org/10.1109/ISGTEurope.2013.6695478.
- MoIT. Circular 39/2015/TT-BCT on Electricity Distribution System; Vietnam Ministry of Industry and Trade: Hanoi, Vietnam, 2015.
- MoIT. Circular 30/2019/TT-BCT of Amendments and Supplements to Several ARTICLES of Circular 25/2016/TT-BCT of Electricity Transmission System and Circular 39/2015/TT-BCT of Electricity Distribution System; Vietnam Ministry of Industry and Trade: Hanoi, Vietnam, 2019.
- Mirošević, M.; Maljković, Z.; Milković, M. Diesel-generator-units dynamic analysis during the start-up of induction motors drives. In Proceedings of the 2005 European Conference on Power Electronics and Applications 2005, Dresden, Germany, 11–14 September 2005; pp. 1–7. https://doi.org/10.1109/epe.2005.219380.
- ENTSO-E. Scenario Outlook and Adequacy Forecast 2014–2030; European Netwwork of Transmission System Operators for Electricity: Brussels, Belgium, 2014.
- Cuadra, L.; Salcedo-Sanz, S.; Del Ser, J.; Jiménez-Fernández, S.; Geem, Z.W. A critical review of robustness in power grids using complex networks concepts. Energies 2015, 8, 9211–9265. https://doi.org/10.3390/en8099211.
- Crucitti, P.; Latora, V.; Marchiori, M. A topological analysis of the Italian electric power grid. Phys. A Stat. Mech. Its Appl. 2004, 338, 92–97. https://doi.org/10.1016/j.physa.2004.02.029.
- Carreras, B.A.; Lynch, V.E.; Dobson, I.; Newman, D.E. Complex dynamics of blackouts in power transmission systems. Chaos 2004, 14, 643–652. https://doi.org/10.1063/1.1781391.
- CT Climate Transparency Report. Vietnam’s Climate Action and Responses to the COVID-19 Crisis 2020. Available online: https://www.climate-transparency.org/wp-content/uploads/2021/11/Vietnam-CP2020.pdf (accessed on 20 January 2023).
Disclaimer/Publisher’s Note: The statements, opinions and data contained in all publications are solely those of the individual author(s) and contributor(s) and not of MDPI and/or the editor(s). MDPI and/or the editor(s) disclaim responsibility for any injury to people or property resulting from any ideas, methods, instructions or products referred to in the content.